LSBM203 Managerial Finance: Portfolio Analysis and Recommendations
VerifiedAdded on 2022/12/30
|16
|3558
|85
Report
AI Summary
This report provides a comprehensive managerial finance portfolio analysis of Tesco and Sainsburry, focusing on ratio analysis and investment appraisal techniques. The ratio analysis covers key metrics such as current ratio, quick ratio, gross profit ratio, P/E ratio, net profit ratio, capital gearing ratio, return on capital employed, inventory turnover ratio, dividend payout ratio, and earnings per share, comparing the financial performance of both companies in 2018 and 2019. The report interprets these ratios to assess liquidity, solvency, and profitability, and offers recommendations for improvement. Additionally, the report briefly touches upon capital investment appraisal and its limitations for long-term decision-making. Desklib offers a range of study tools and resources, including past papers and solved assignments to support students.

Managerial Financial
Portfolios
Portfolios
Paraphrase This Document
Need a fresh take? Get an instant paraphrase of this document with our AI Paraphraser
Table of Contents
INTRODUCTION...........................................................................................................................3
PORTFOLIO 1.................................................................................................................................3
Ratio analysis:..............................................................................................................................3
Interpretation:...............................................................................................................................5
Recommendations:.....................................................................................................................12
Limitations for using ratio analysis for knowing firms financial position:...............................13
PORTFOLIO 2...............................................................................................................................13
Investment appraisal techniques for project A and project B:...................................................13
Interpretation:.............................................................................................................................14
Limitations of using investment appraisal techniques for long term decision-making:............14
CONCLUSION..............................................................................................................................15
REFERENCES..............................................................................................................................16
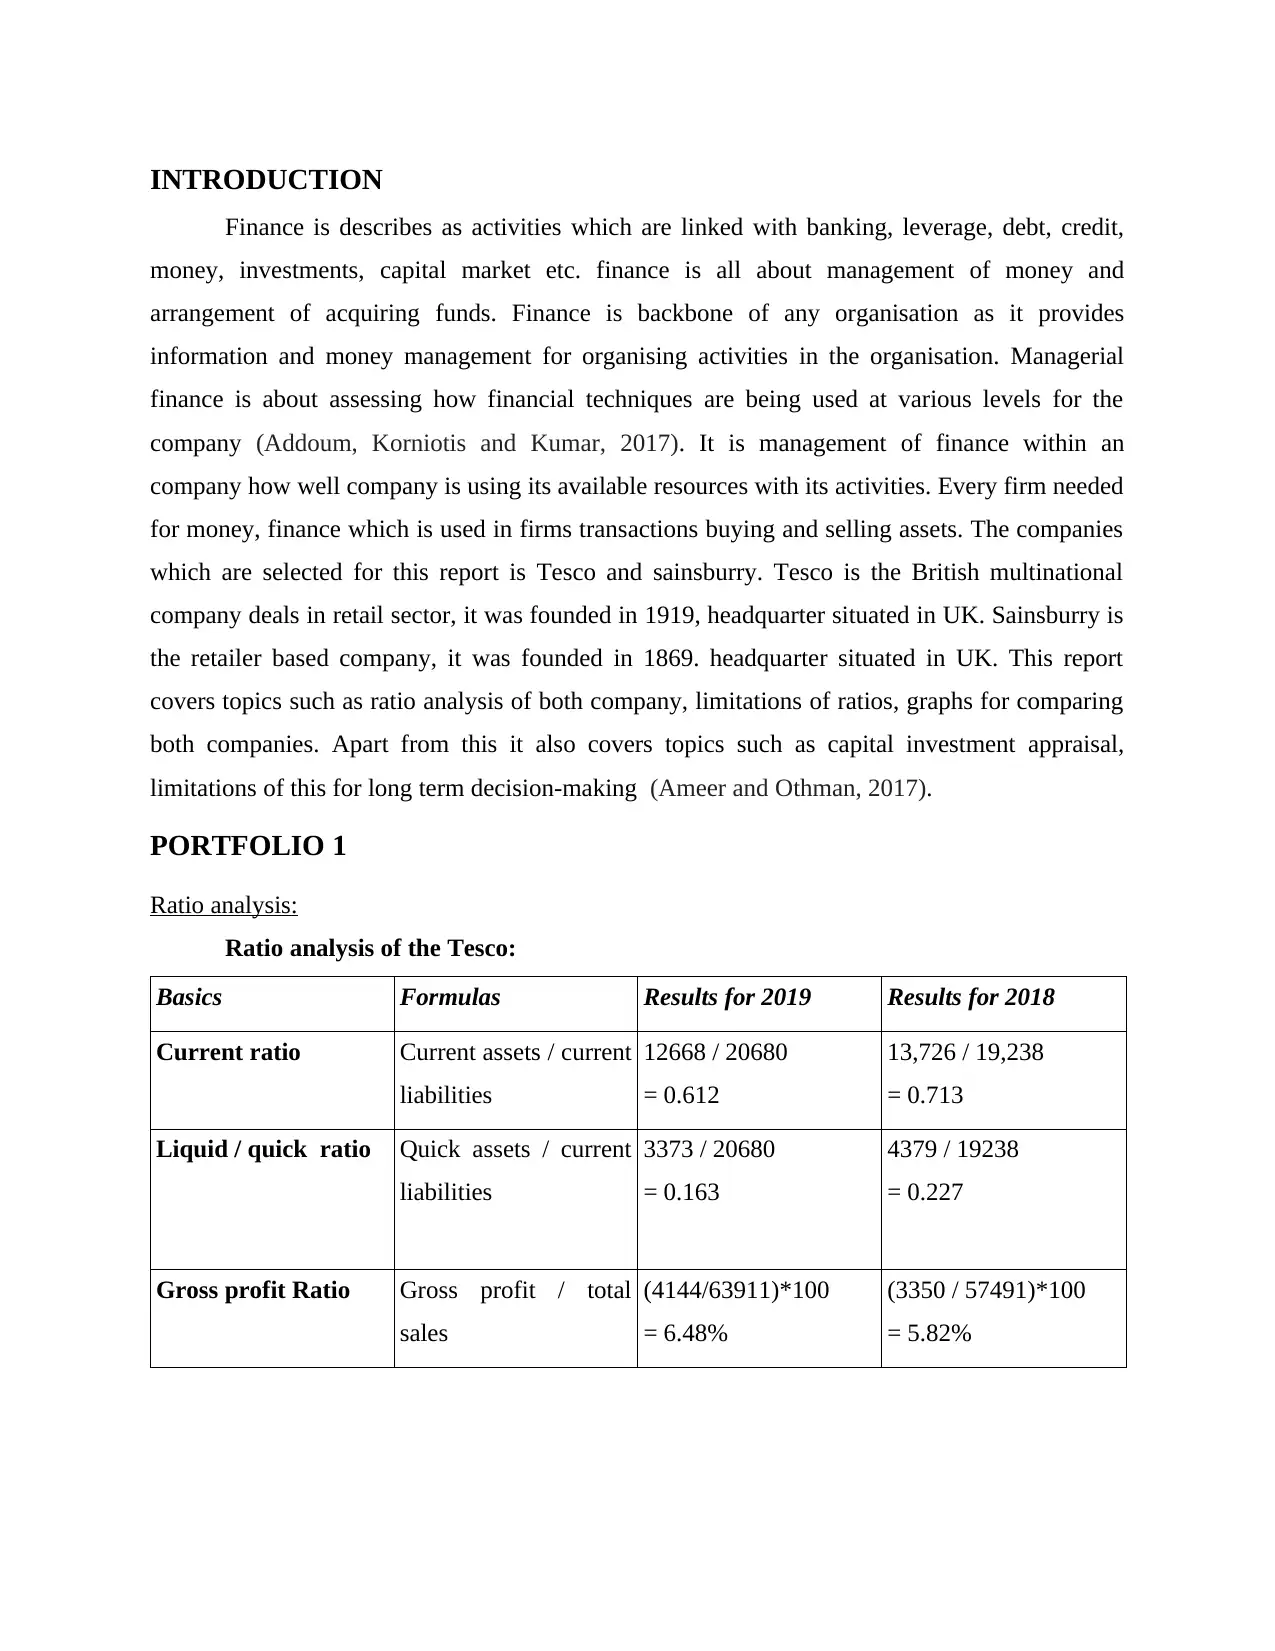
INTRODUCTION
Finance is describes as activities which are linked with banking, leverage, debt, credit,
money, investments, capital market etc. finance is all about management of money and
arrangement of acquiring funds. Finance is backbone of any organisation as it provides
information and money management for organising activities in the organisation. Managerial
finance is about assessing how financial techniques are being used at various levels for the
company (Addoum, Korniotis and Kumar, 2017). It is management of finance within an
company how well company is using its available resources with its activities. Every firm needed
for money, finance which is used in firms transactions buying and selling assets. The companies
which are selected for this report is Tesco and sainsburry. Tesco is the British multinational
company deals in retail sector, it was founded in 1919, headquarter situated in UK. Sainsburry is
the retailer based company, it was founded in 1869. headquarter situated in UK. This report
covers topics such as ratio analysis of both company, limitations of ratios, graphs for comparing
both companies. Apart from this it also covers topics such as capital investment appraisal,
limitations of this for long term decision-making (Ameer and Othman, 2017).
PORTFOLIO 1
Ratio analysis:
Ratio analysis of the Tesco:
Basics Formulas Results for 2019 Results for 2018
Current ratio Current assets / current
liabilities
12668 / 20680
= 0.612
13,726 / 19,238
= 0.713
Liquid / quick ratio Quick assets / current
liabilities
3373 / 20680
= 0.163
4379 / 19238
= 0.227
Gross profit Ratio Gross profit / total
sales
(4144/63911)*100
= 6.48%
(3350 / 57491)*100
= 5.82%
⊘ This is a preview!⊘
Do you want full access?
Subscribe today to unlock all pages.
Trusted by 1+ million students worldwide
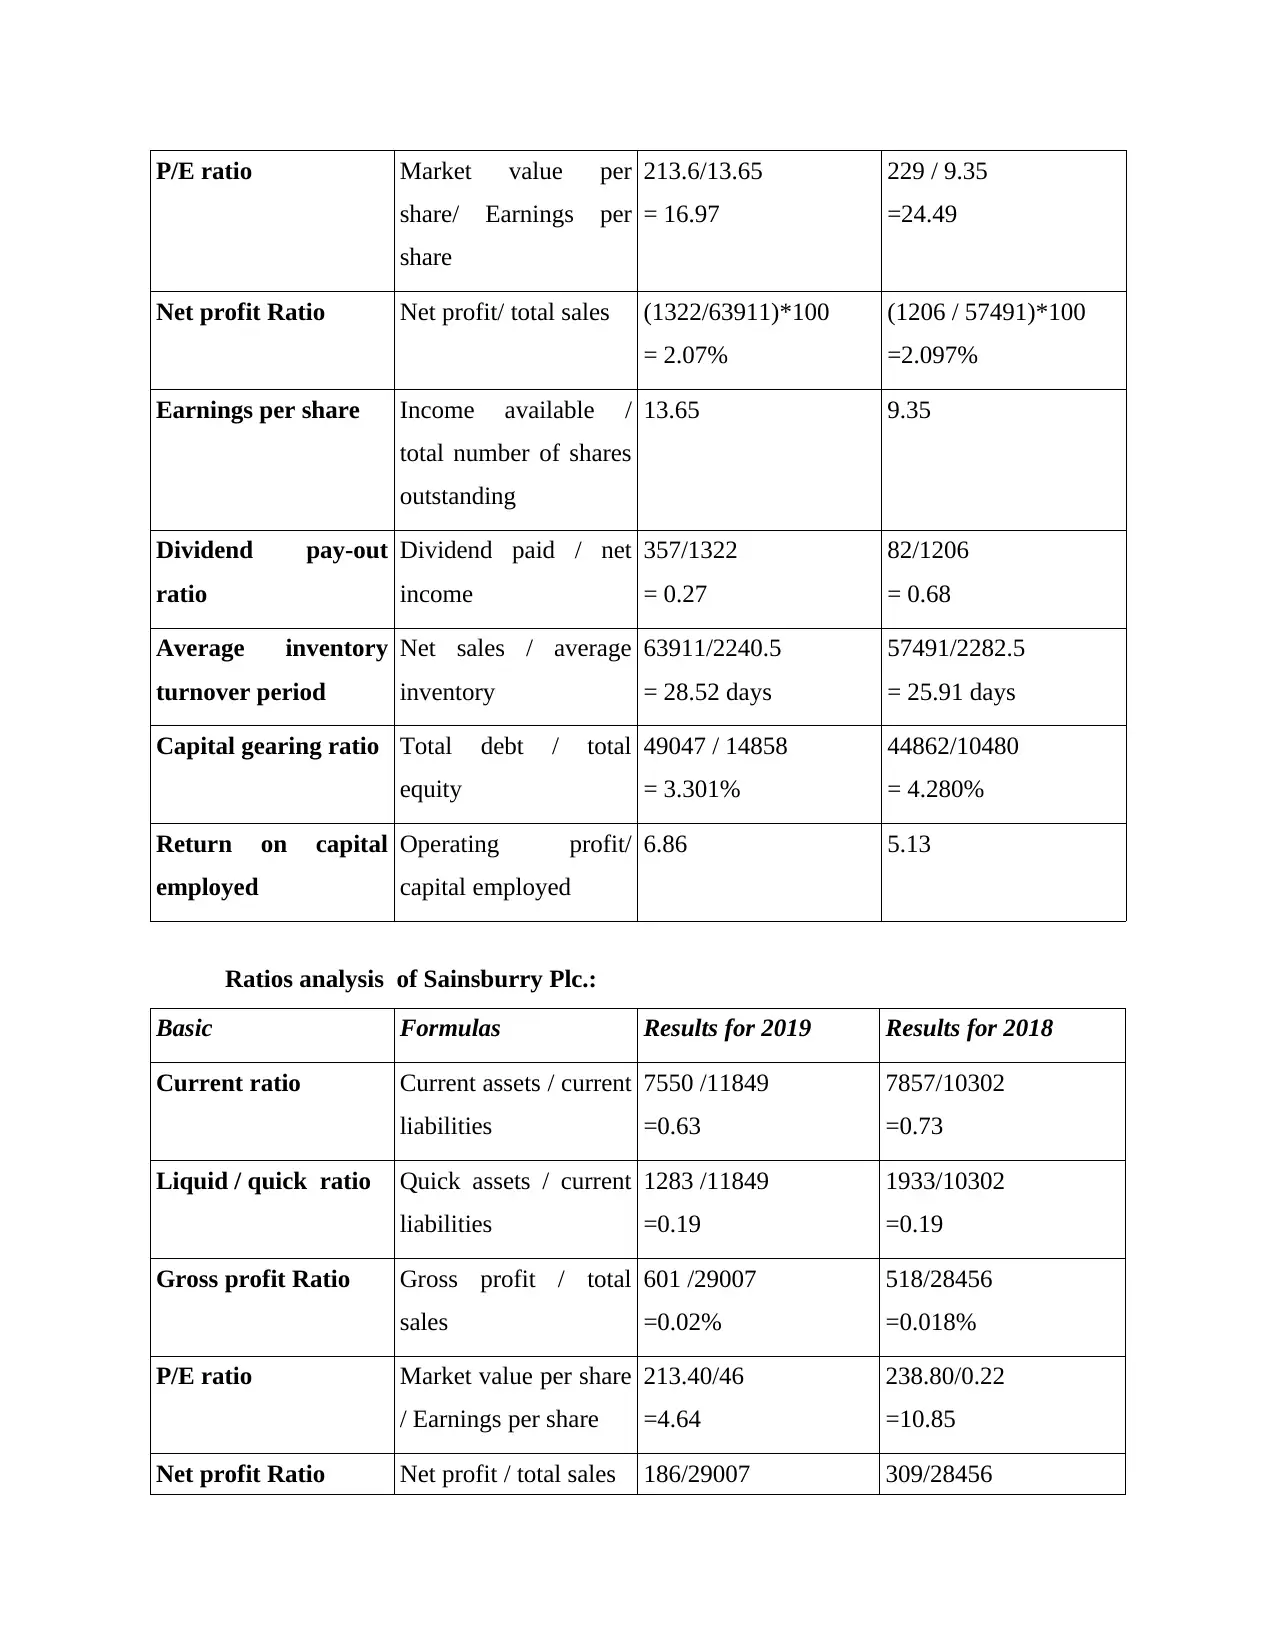
P/E ratio Market value per
share/ Earnings per
share
213.6/13.65
= 16.97
229 / 9.35
=24.49
Net profit Ratio Net profit/ total sales (1322/63911)*100
= 2.07%
(1206 / 57491)*100
=2.097%
Earnings per share Income available /
total number of shares
outstanding
13.65 9.35
Dividend pay-out
ratio
Dividend paid / net
income
357/1322
= 0.27
82/1206
= 0.68
Average inventory
turnover period
Net sales / average
inventory
63911/2240.5
= 28.52 days
57491/2282.5
= 25.91 days
Capital gearing ratio Total debt / total
equity
49047 / 14858
= 3.301%
44862/10480
= 4.280%
Return on capital
employed
Operating profit/
capital employed
6.86 5.13
Ratios analysis of Sainsburry Plc.:
Basic Formulas Results for 2019 Results for 2018
Current ratio Current assets / current
liabilities
7550 /11849
=0.63
7857/10302
=0.73
Liquid / quick ratio Quick assets / current
liabilities
1283 /11849
=0.19
1933/10302
=0.19
Gross profit Ratio Gross profit / total
sales
601 /29007
=0.02%
518/28456
=0.018%
P/E ratio Market value per share
/ Earnings per share
213.40/46
=4.64
238.80/0.22
=10.85
Net profit Ratio Net profit / total sales 186/29007 309/28456
Paraphrase This Document
Need a fresh take? Get an instant paraphrase of this document with our AI Paraphraser
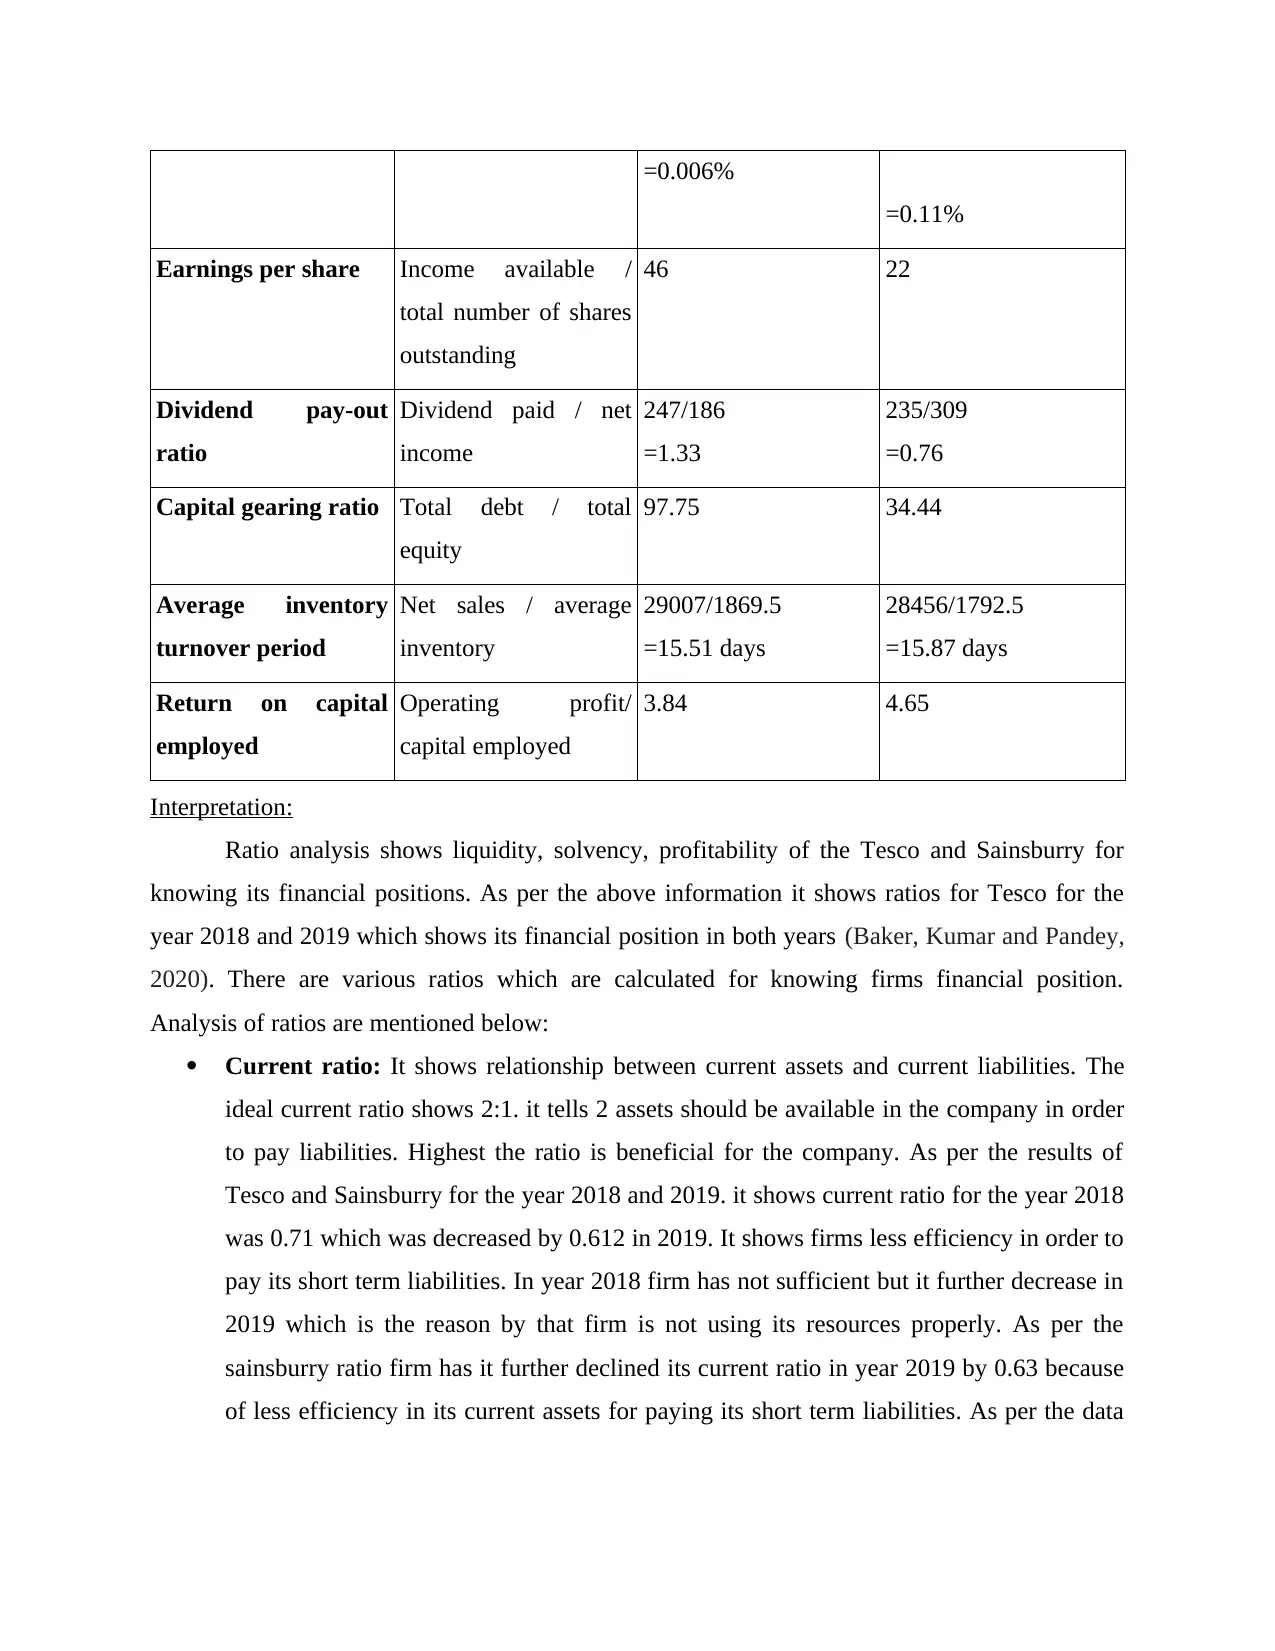
=0.006%
=0.11%
Earnings per share Income available /
total number of shares
outstanding
46 22
Dividend pay-out
ratio
Dividend paid / net
income
247/186
=1.33
235/309
=0.76
Capital gearing ratio Total debt / total
equity
97.75 34.44
Average inventory
turnover period
Net sales / average
inventory
29007/1869.5
=15.51 days
28456/1792.5
=15.87 days
Return on capital
employed
Operating profit/
capital employed
3.84 4.65
Interpretation:
Ratio analysis shows liquidity, solvency, profitability of the Tesco and Sainsburry for
knowing its financial positions. As per the above information it shows ratios for Tesco for the
year 2018 and 2019 which shows its financial position in both years (Baker, Kumar and Pandey,
2020). There are various ratios which are calculated for knowing firms financial position.
Analysis of ratios are mentioned below:
Current ratio: It shows relationship between current assets and current liabilities. The
ideal current ratio shows 2:1. it tells 2 assets should be available in the company in order
to pay liabilities. Highest the ratio is beneficial for the company. As per the results of
Tesco and Sainsburry for the year 2018 and 2019. it shows current ratio for the year 2018
was 0.71 which was decreased by 0.612 in 2019. It shows firms less efficiency in order to
pay its short term liabilities. In year 2018 firm has not sufficient but it further decrease in
2019 which is the reason by that firm is not using its resources properly. As per the
sainsburry ratio firm has it further declined its current ratio in year 2019 by 0.63 because
of less efficiency in its current assets for paying its short term liabilities. As per the data
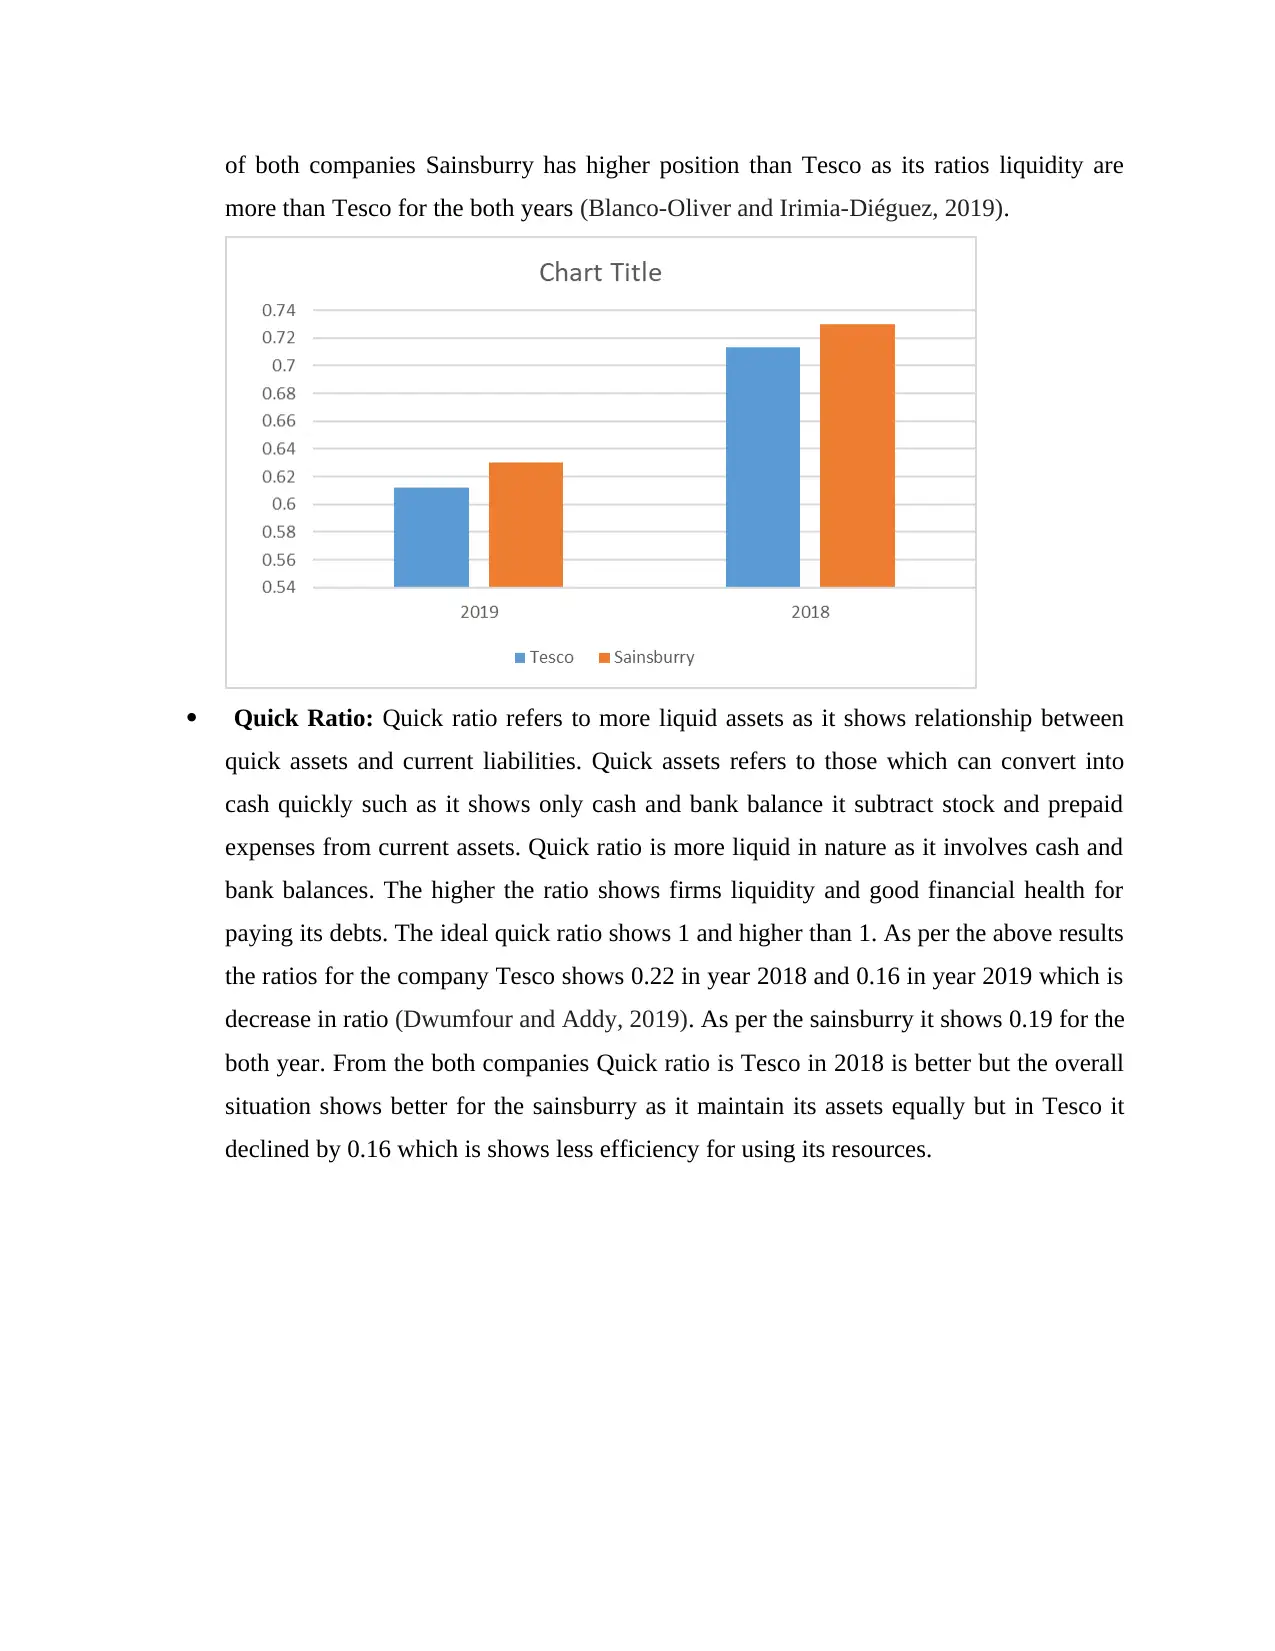
of both companies Sainsburry has higher position than Tesco as its ratios liquidity are
more than Tesco for the both years (Blanco-Oliver and Irimia-Diéguez, 2019).
Quick Ratio: Quick ratio refers to more liquid assets as it shows relationship between
quick assets and current liabilities. Quick assets refers to those which can convert into
cash quickly such as it shows only cash and bank balance it subtract stock and prepaid
expenses from current assets. Quick ratio is more liquid in nature as it involves cash and
bank balances. The higher the ratio shows firms liquidity and good financial health for
paying its debts. The ideal quick ratio shows 1 and higher than 1. As per the above results
the ratios for the company Tesco shows 0.22 in year 2018 and 0.16 in year 2019 which is
decrease in ratio (Dwumfour and Addy, 2019). As per the sainsburry it shows 0.19 for the
both year. From the both companies Quick ratio is Tesco in 2018 is better but the overall
situation shows better for the sainsburry as it maintain its assets equally but in Tesco it
declined by 0.16 which is shows less efficiency for using its resources.
⊘ This is a preview!⊘
Do you want full access?
Subscribe today to unlock all pages.
Trusted by 1+ million students worldwide
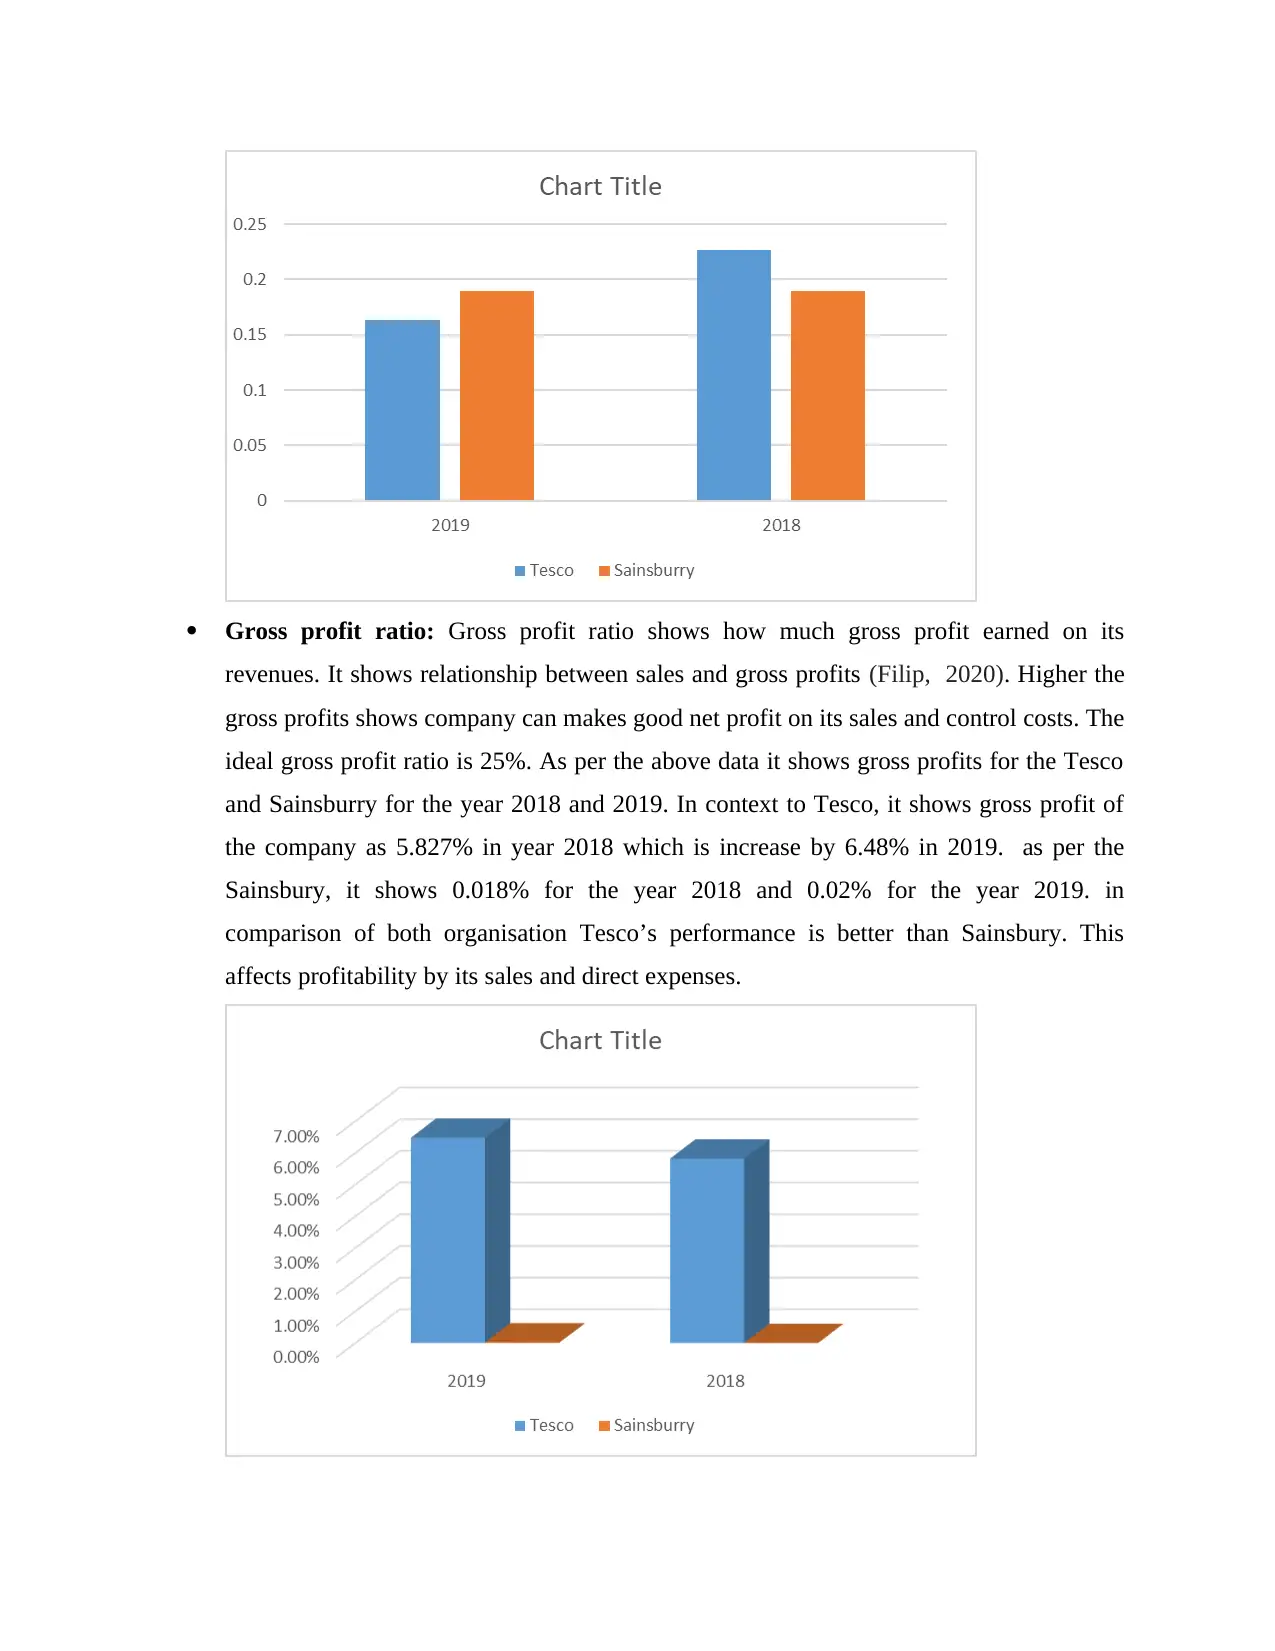
Gross profit ratio: Gross profit ratio shows how much gross profit earned on its
revenues. It shows relationship between sales and gross profits (Filip, 2020). Higher the
gross profits shows company can makes good net profit on its sales and control costs. The
ideal gross profit ratio is 25%. As per the above data it shows gross profits for the Tesco
and Sainsburry for the year 2018 and 2019. In context to Tesco, it shows gross profit of
the company as 5.827% in year 2018 which is increase by 6.48% in 2019. as per the
Sainsbury, it shows 0.018% for the year 2018 and 0.02% for the year 2019. in
comparison of both organisation Tesco’s performance is better than Sainsbury. This
affects profitability by its sales and direct expenses.
Paraphrase This Document
Need a fresh take? Get an instant paraphrase of this document with our AI Paraphraser
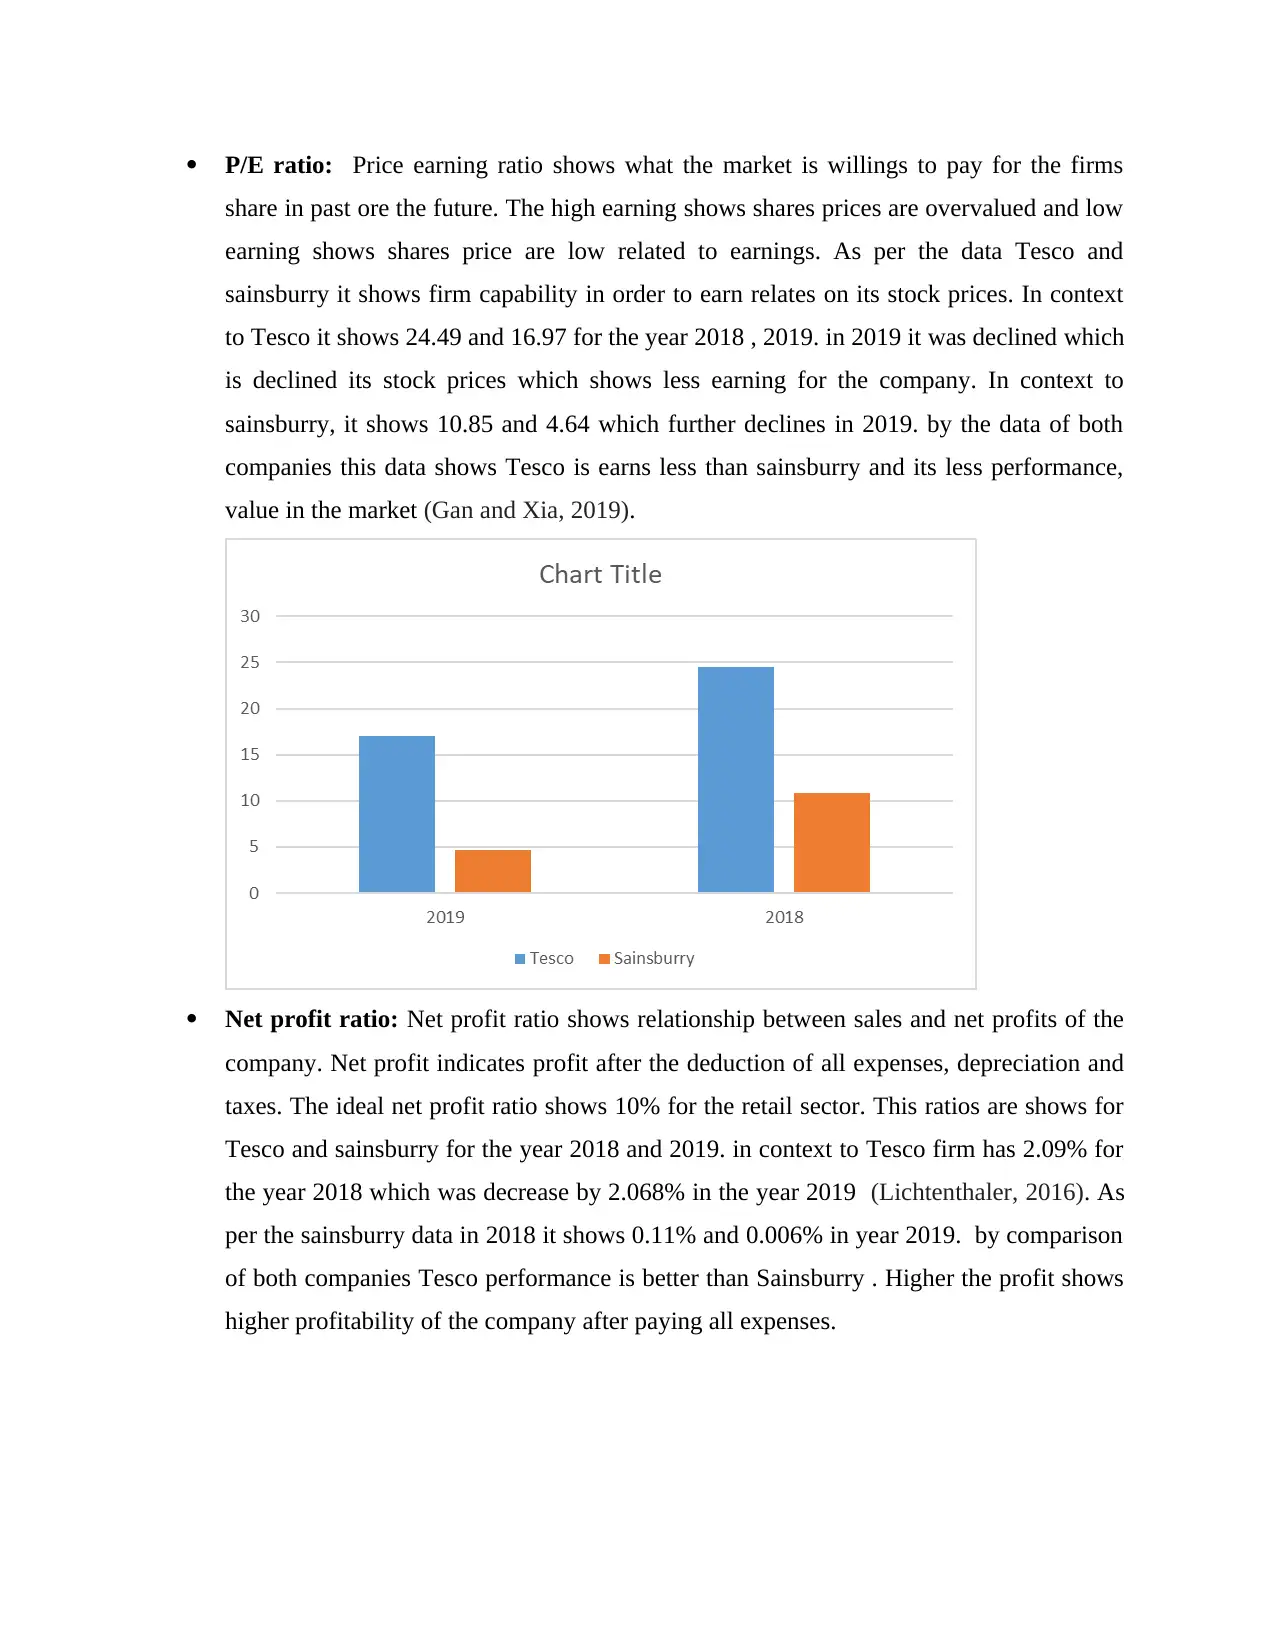
P/E ratio: Price earning ratio shows what the market is willings to pay for the firms
share in past ore the future. The high earning shows shares prices are overvalued and low
earning shows shares price are low related to earnings. As per the data Tesco and
sainsburry it shows firm capability in order to earn relates on its stock prices. In context
to Tesco it shows 24.49 and 16.97 for the year 2018 , 2019. in 2019 it was declined which
is declined its stock prices which shows less earning for the company. In context to
sainsburry, it shows 10.85 and 4.64 which further declines in 2019. by the data of both
companies this data shows Tesco is earns less than sainsburry and its less performance,
value in the market (Gan and Xia, 2019).
Net profit ratio: Net profit ratio shows relationship between sales and net profits of the
company. Net profit indicates profit after the deduction of all expenses, depreciation and
taxes. The ideal net profit ratio shows 10% for the retail sector. This ratios are shows for
Tesco and sainsburry for the year 2018 and 2019. in context to Tesco firm has 2.09% for
the year 2018 which was decrease by 2.068% in the year 2019 (Lichtenthaler, 2016). As
per the sainsburry data in 2018 it shows 0.11% and 0.006% in year 2019. by comparison
of both companies Tesco performance is better than Sainsburry . Higher the profit shows
higher profitability of the company after paying all expenses.
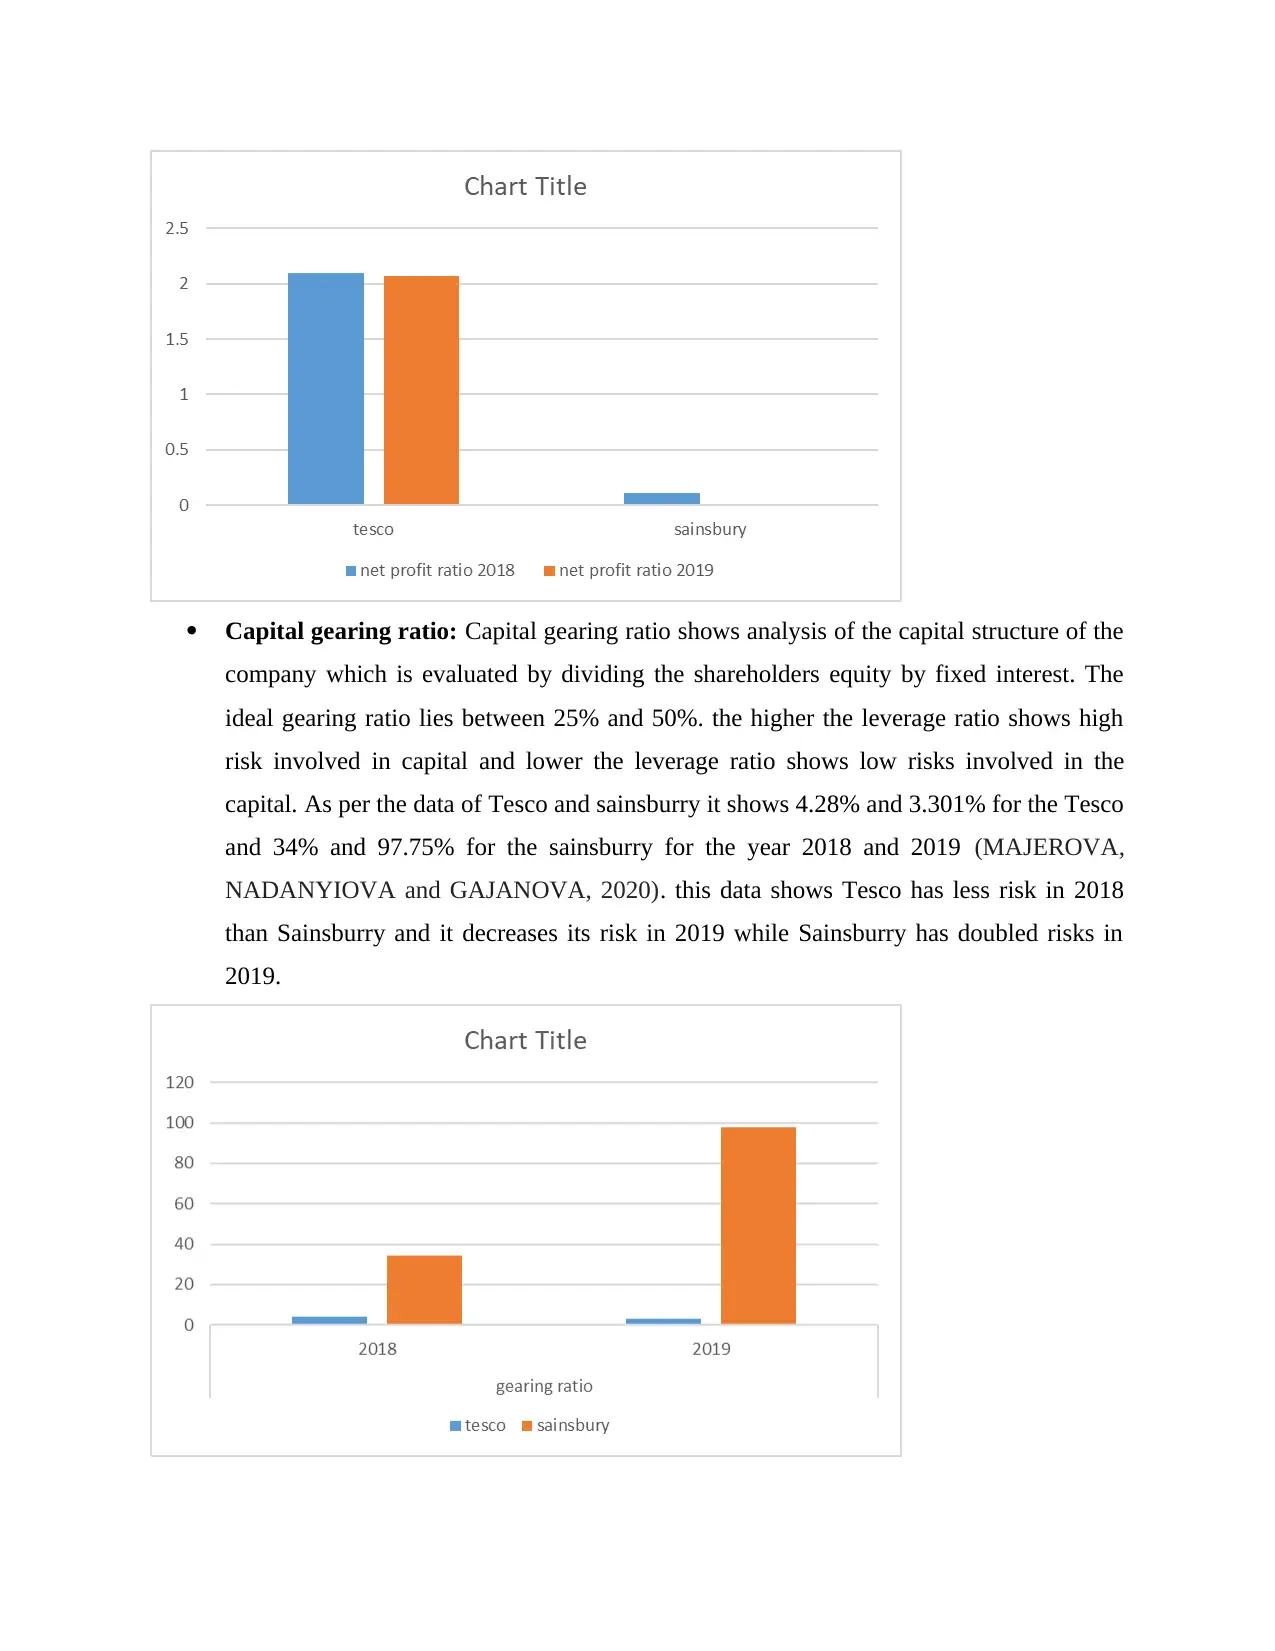
Capital gearing ratio: Capital gearing ratio shows analysis of the capital structure of the
company which is evaluated by dividing the shareholders equity by fixed interest. The
ideal gearing ratio lies between 25% and 50%. the higher the leverage ratio shows high
risk involved in capital and lower the leverage ratio shows low risks involved in the
capital. As per the data of Tesco and sainsburry it shows 4.28% and 3.301% for the Tesco
and 34% and 97.75% for the sainsburry for the year 2018 and 2019 (MAJEROVA,
NADANYIOVA and GAJANOVA, 2020). this data shows Tesco has less risk in 2018
than Sainsburry and it decreases its risk in 2019 while Sainsburry has doubled risks in
2019.
⊘ This is a preview!⊘
Do you want full access?
Subscribe today to unlock all pages.
Trusted by 1+ million students worldwide
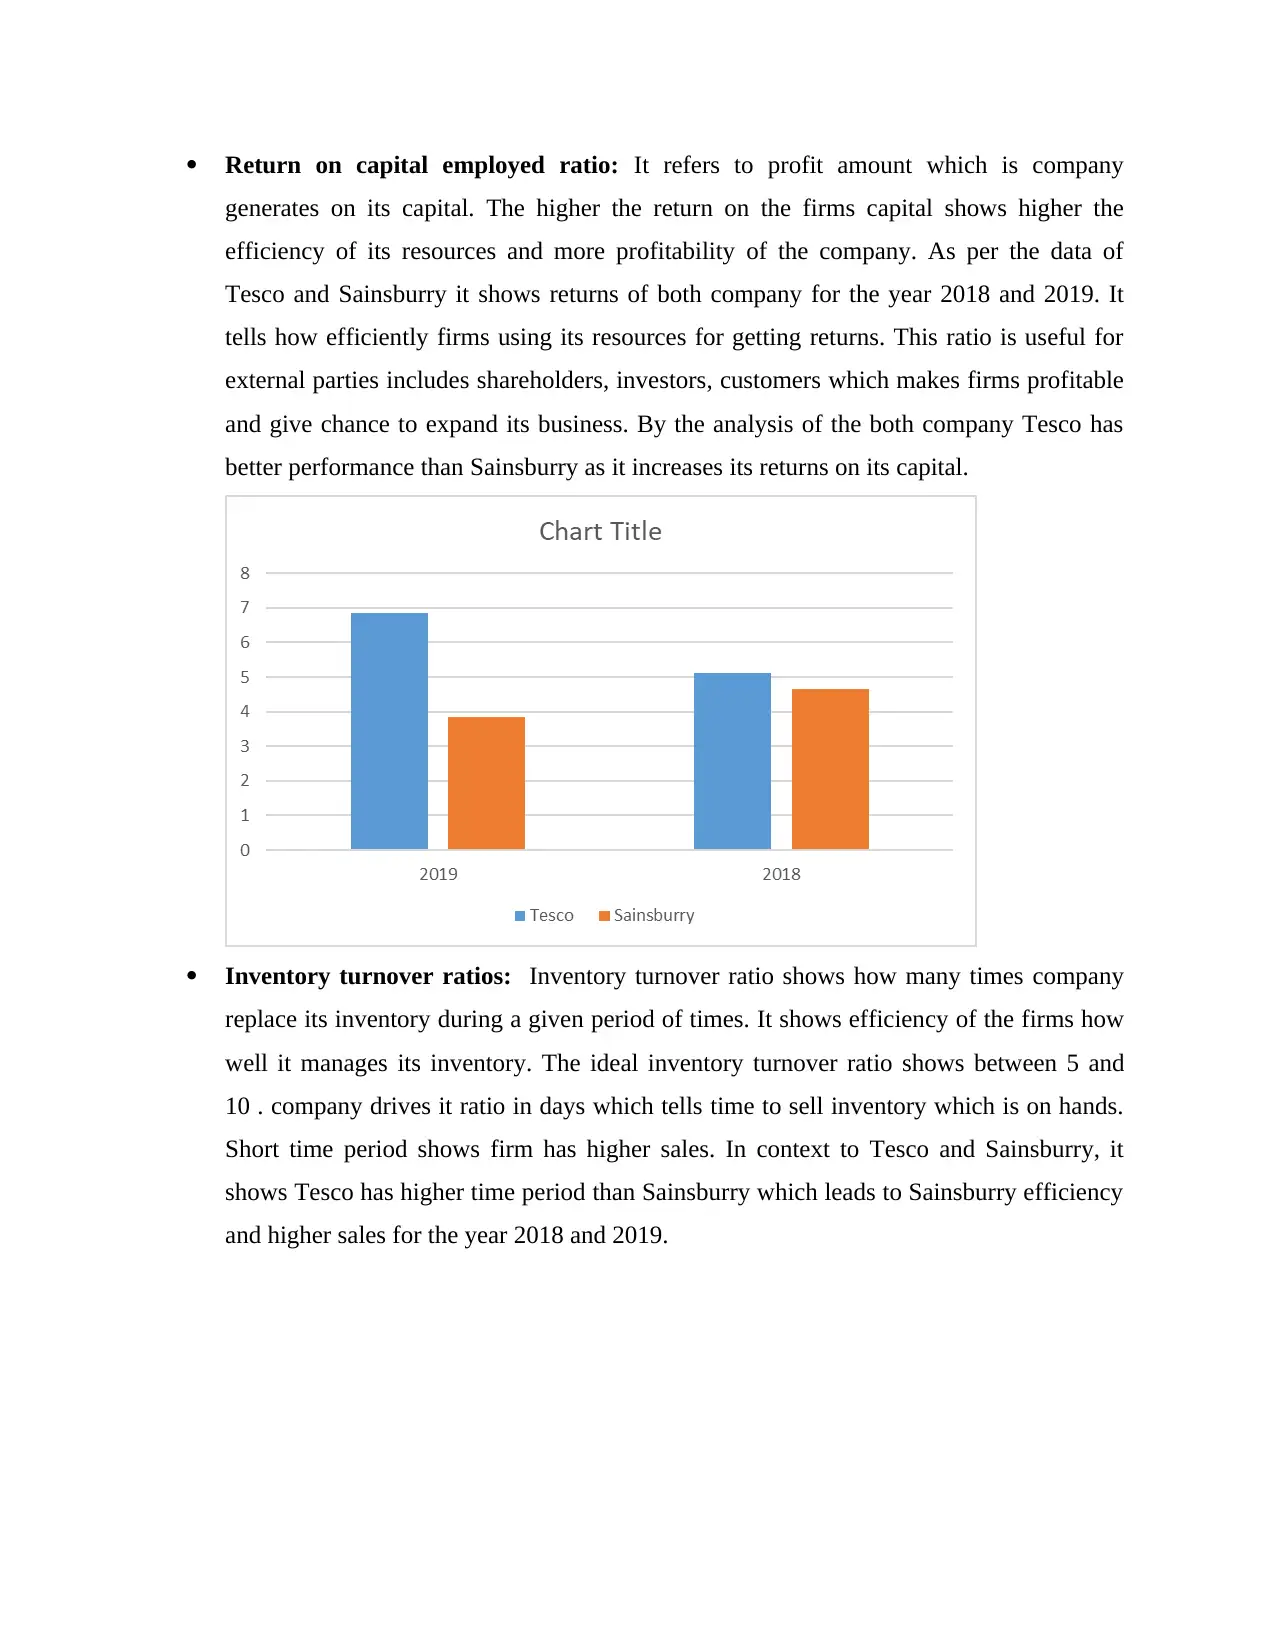
Return on capital employed ratio: It refers to profit amount which is company
generates on its capital. The higher the return on the firms capital shows higher the
efficiency of its resources and more profitability of the company. As per the data of
Tesco and Sainsburry it shows returns of both company for the year 2018 and 2019. It
tells how efficiently firms using its resources for getting returns. This ratio is useful for
external parties includes shareholders, investors, customers which makes firms profitable
and give chance to expand its business. By the analysis of the both company Tesco has
better performance than Sainsburry as it increases its returns on its capital.
Inventory turnover ratios: Inventory turnover ratio shows how many times company
replace its inventory during a given period of times. It shows efficiency of the firms how
well it manages its inventory. The ideal inventory turnover ratio shows between 5 and
10 . company drives it ratio in days which tells time to sell inventory which is on hands.
Short time period shows firm has higher sales. In context to Tesco and Sainsburry, it
shows Tesco has higher time period than Sainsburry which leads to Sainsburry efficiency
and higher sales for the year 2018 and 2019.
Paraphrase This Document
Need a fresh take? Get an instant paraphrase of this document with our AI Paraphraser
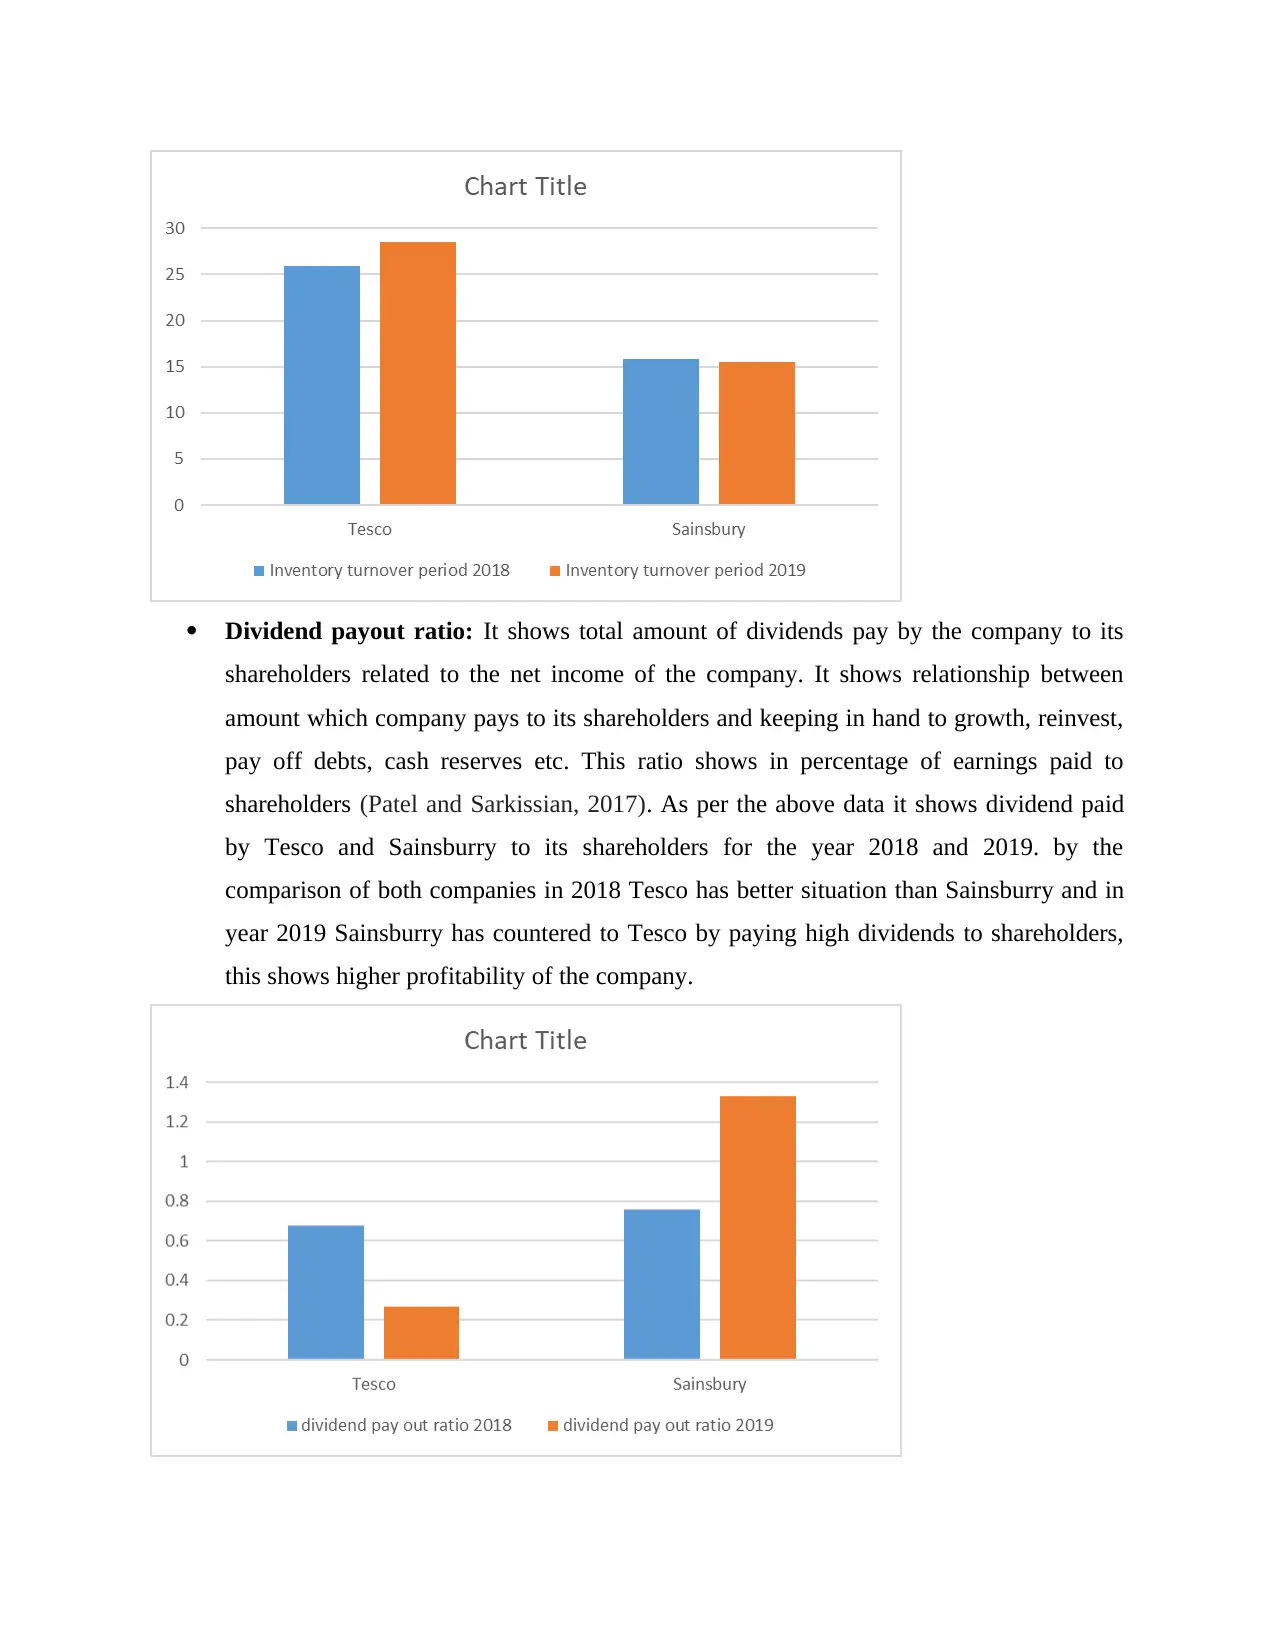
Dividend payout ratio: It shows total amount of dividends pay by the company to its
shareholders related to the net income of the company. It shows relationship between
amount which company pays to its shareholders and keeping in hand to growth, reinvest,
pay off debts, cash reserves etc. This ratio shows in percentage of earnings paid to
shareholders (Patel and Sarkissian, 2017). As per the above data it shows dividend paid
by Tesco and Sainsburry to its shareholders for the year 2018 and 2019. by the
comparison of both companies in 2018 Tesco has better situation than Sainsburry and in
year 2019 Sainsburry has countered to Tesco by paying high dividends to shareholders,
this shows higher profitability of the company.
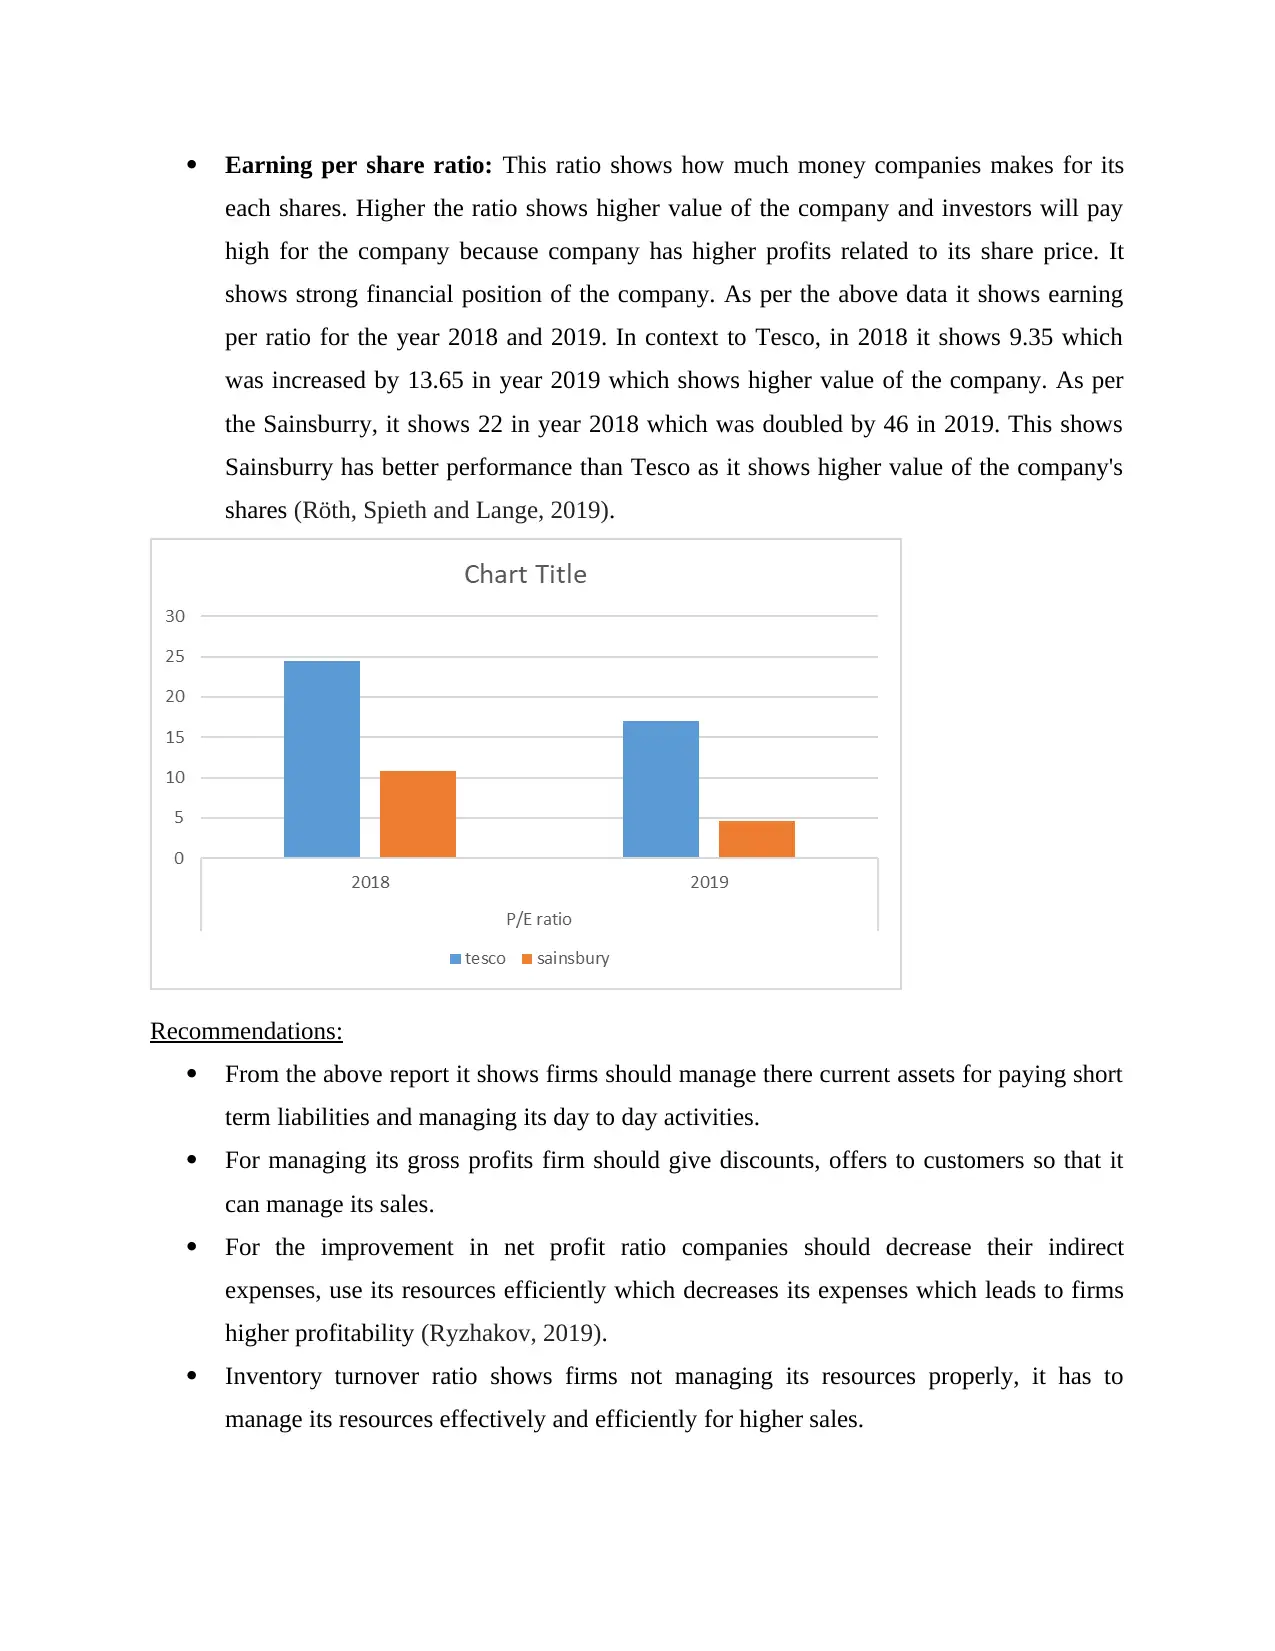
Earning per share ratio: This ratio shows how much money companies makes for its
each shares. Higher the ratio shows higher value of the company and investors will pay
high for the company because company has higher profits related to its share price. It
shows strong financial position of the company. As per the above data it shows earning
per ratio for the year 2018 and 2019. In context to Tesco, in 2018 it shows 9.35 which
was increased by 13.65 in year 2019 which shows higher value of the company. As per
the Sainsburry, it shows 22 in year 2018 which was doubled by 46 in 2019. This shows
Sainsburry has better performance than Tesco as it shows higher value of the company's
shares (Röth, Spieth and Lange, 2019).
Recommendations:
From the above report it shows firms should manage there current assets for paying short
term liabilities and managing its day to day activities.
For managing its gross profits firm should give discounts, offers to customers so that it
can manage its sales.
For the improvement in net profit ratio companies should decrease their indirect
expenses, use its resources efficiently which decreases its expenses which leads to firms
higher profitability (Ryzhakov, 2019).
Inventory turnover ratio shows firms not managing its resources properly, it has to
manage its resources effectively and efficiently for higher sales.
⊘ This is a preview!⊘
Do you want full access?
Subscribe today to unlock all pages.
Trusted by 1+ million students worldwide
1 out of 16
Related Documents


Your All-in-One AI-Powered Toolkit for Academic Success.
+13062052269
info@desklib.com
Available 24*7 on WhatsApp / Email
![[object Object]](/_next/static/media/star-bottom.7253800d.svg)
Unlock your academic potential
Copyright © 2020–2026 A2Z Services. All Rights Reserved. Developed and managed by ZUCOL.