Finance Presentation: COVID-19 Impact on Australian Stocks

Verified

Added on  2022/09/13

|12
|525
|17
Presentation
AI Summary
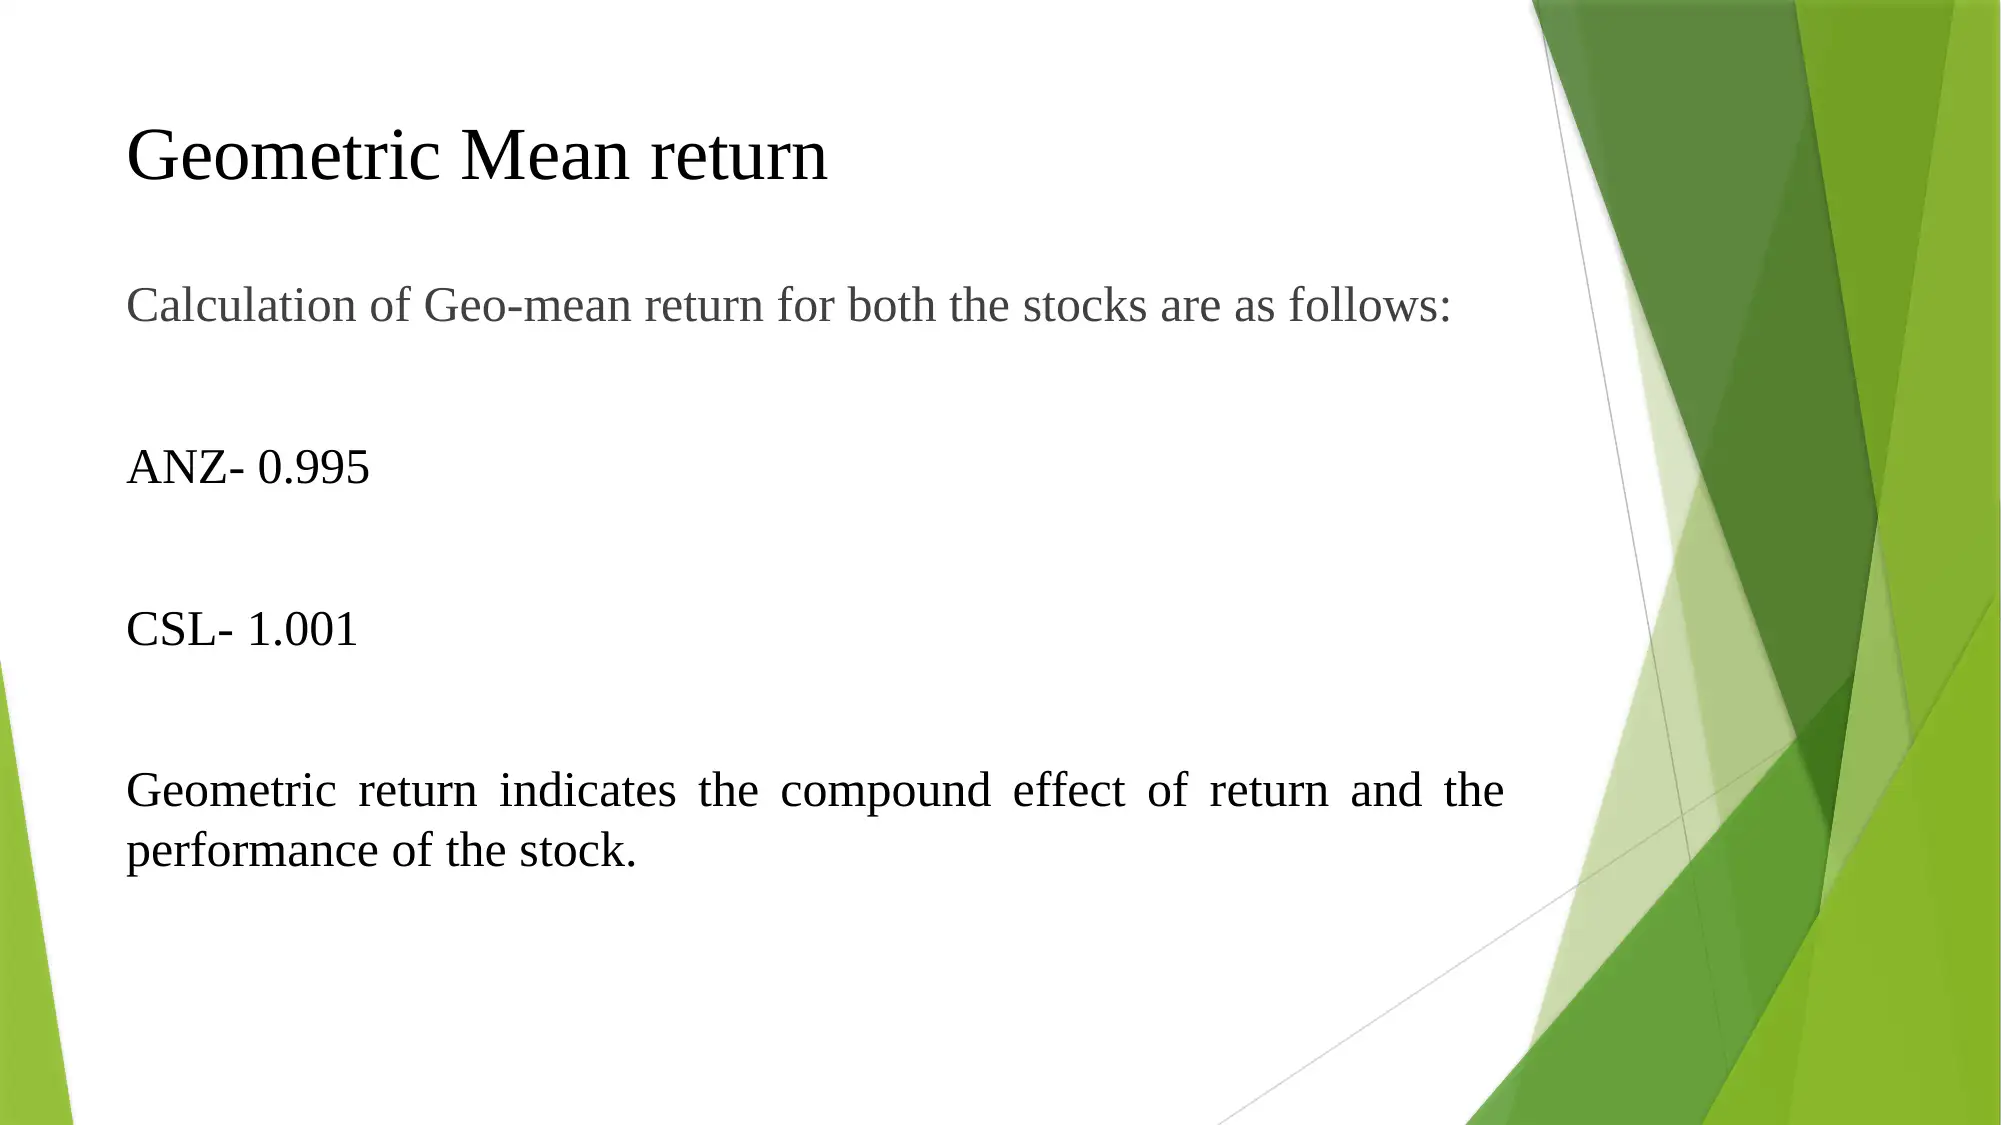
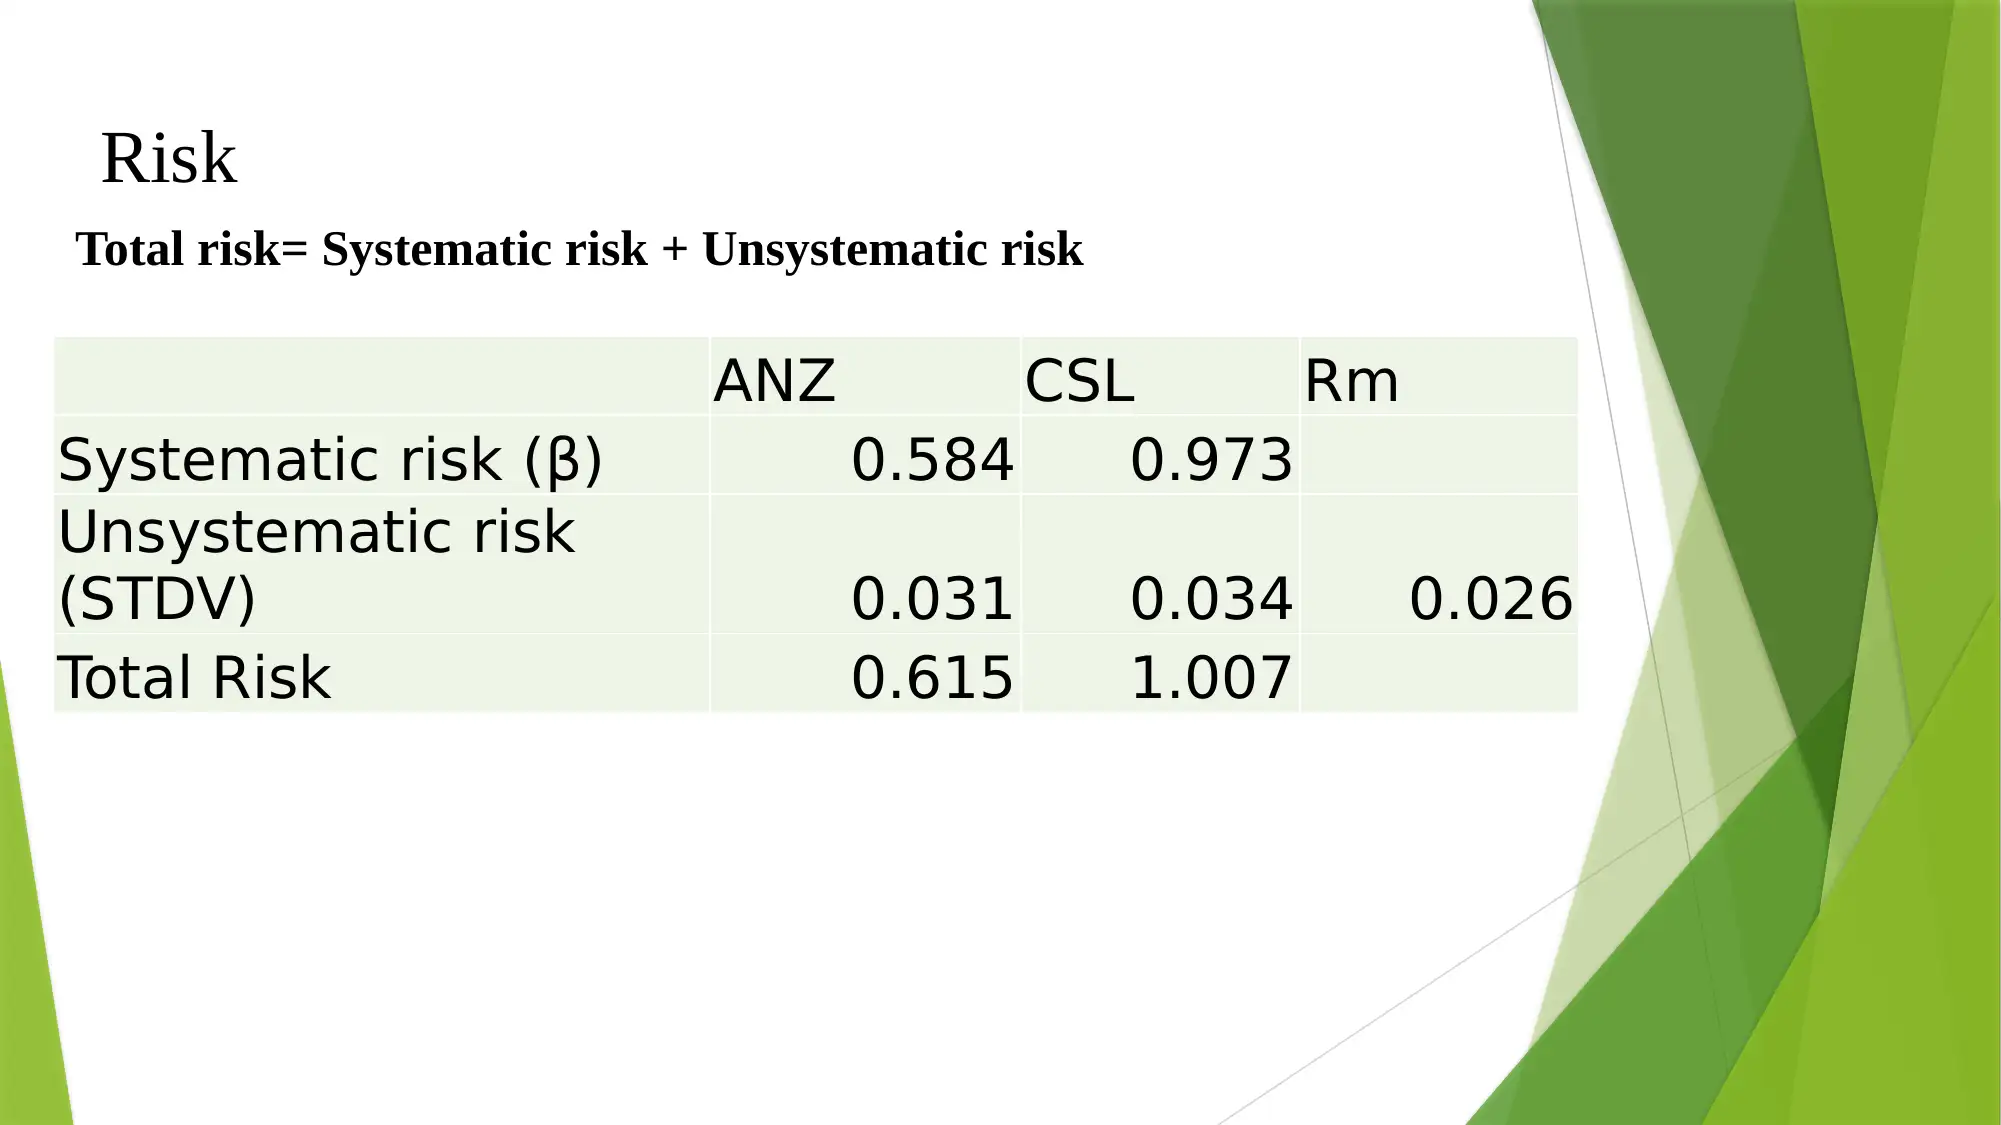
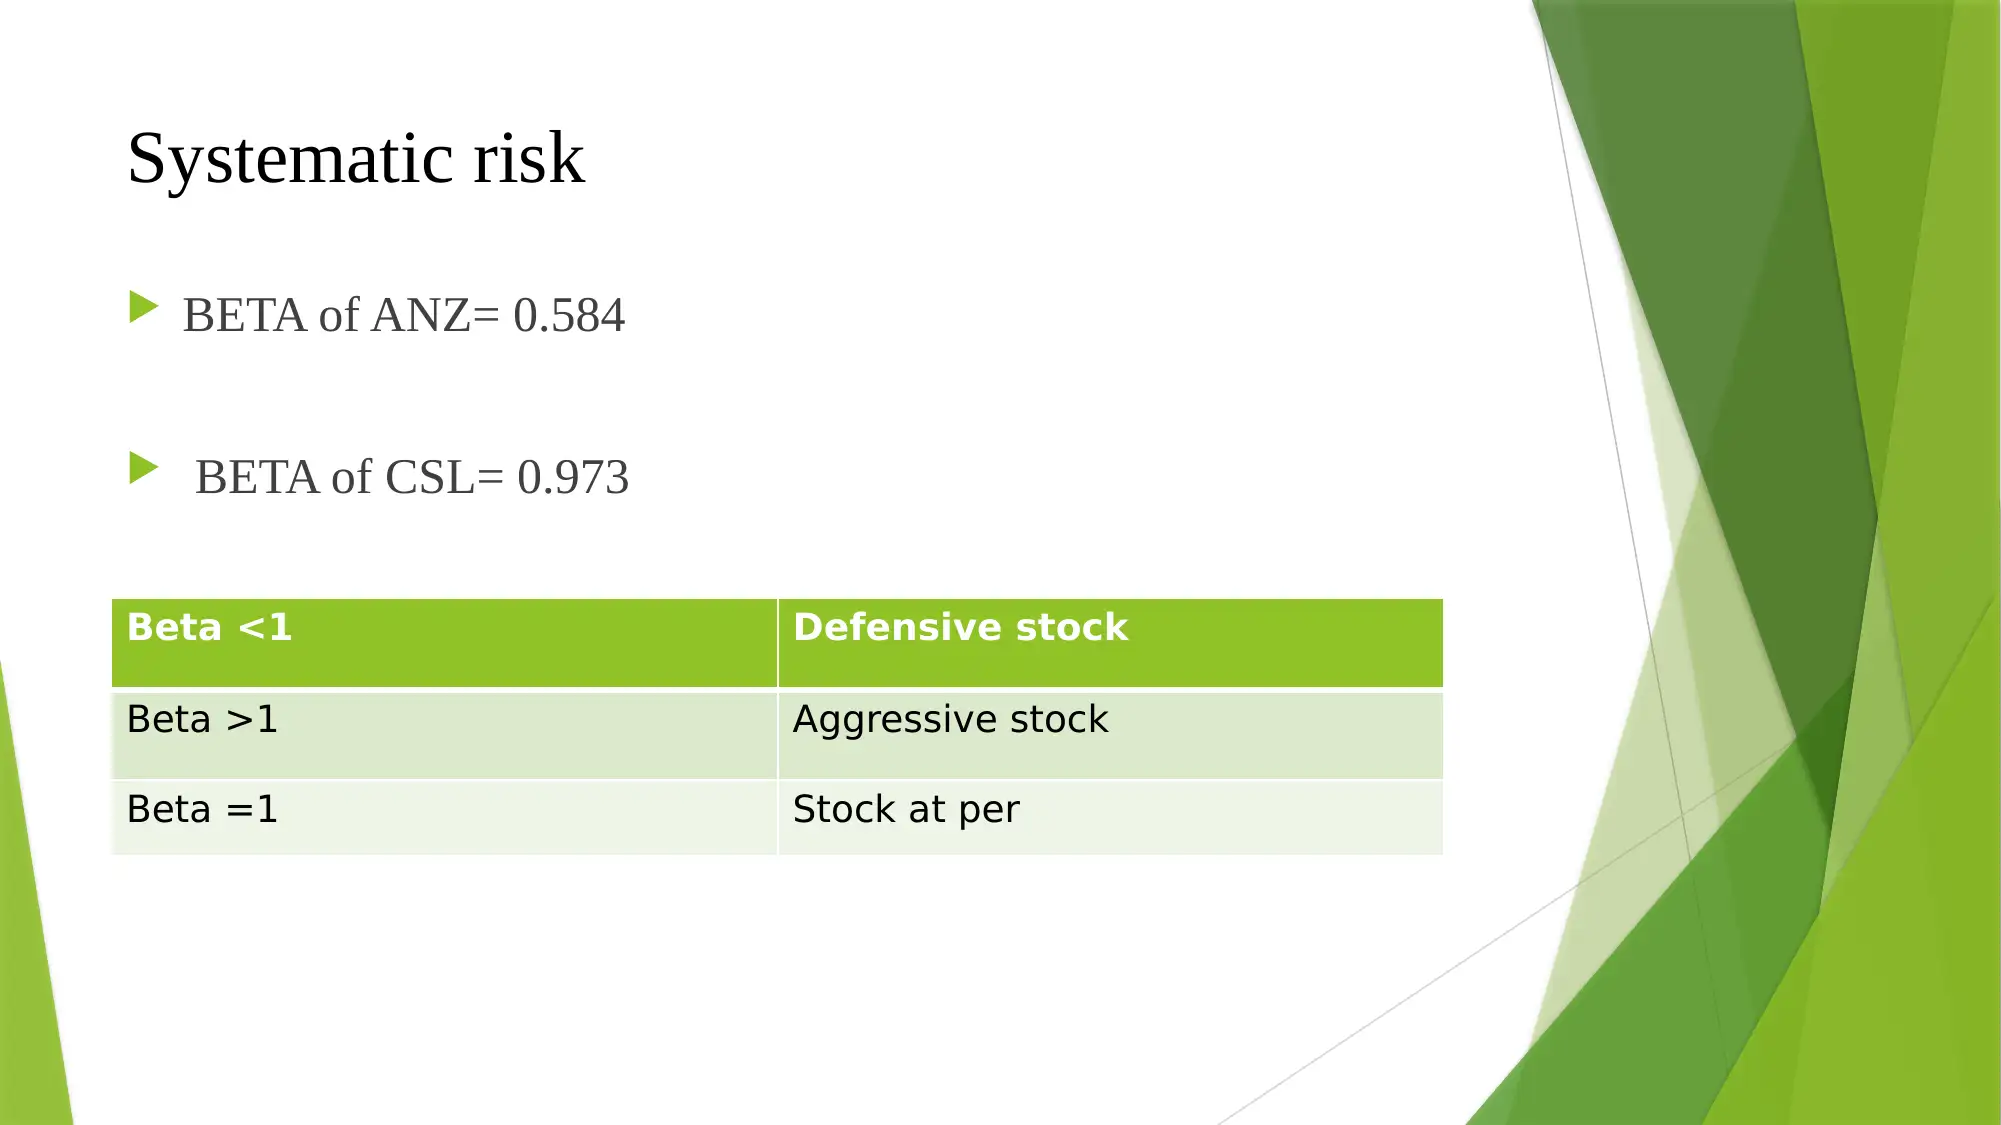
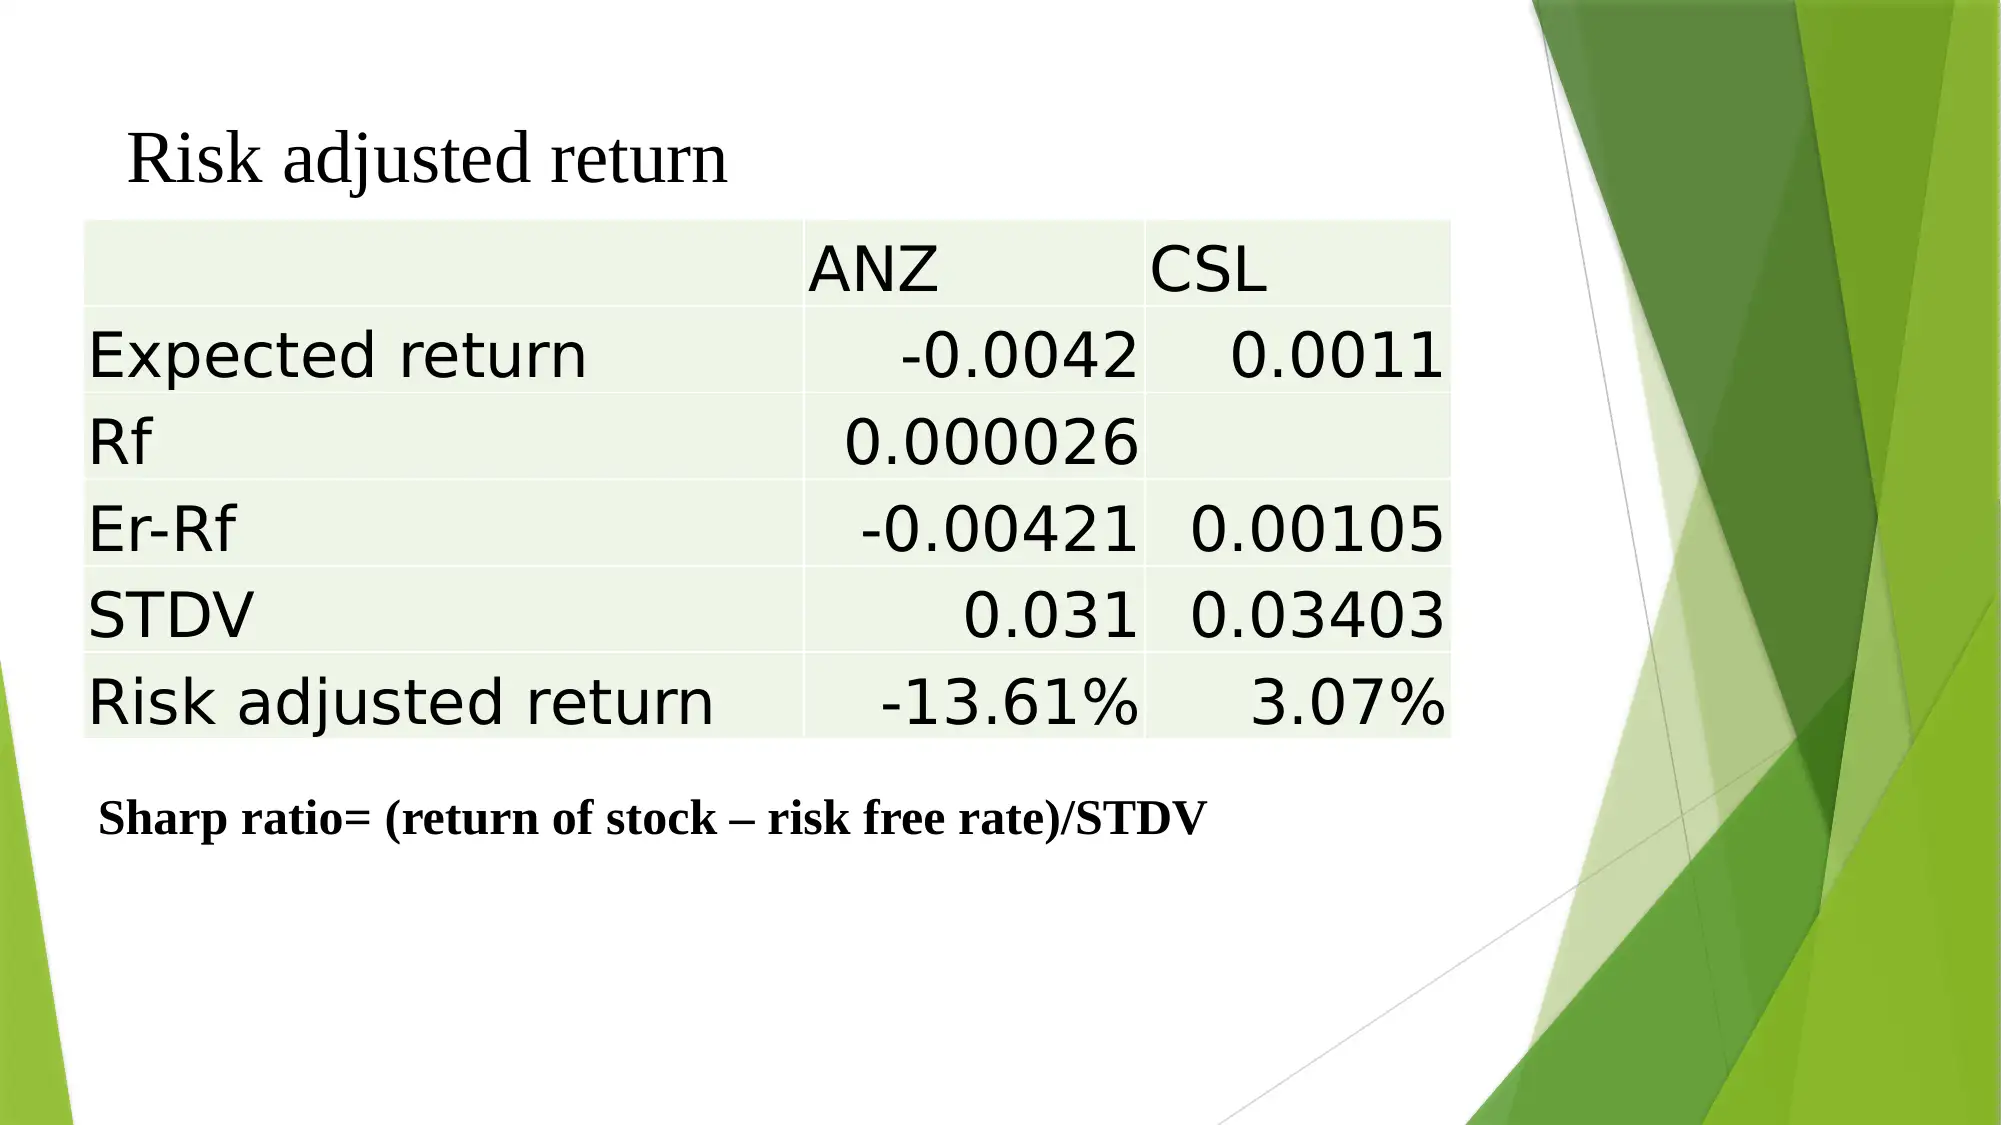
This presentation analyzes the financial impact of the COVID-19 pandemic on the Australian stock market, focusing on two specific stocks: Australia and New Zealand Banking Group (ANZ) and CSL Limited. The analysis includes an introduction to the pandemic's global economic effects, particularly the contraction of the global economy, and an overview of the selected stocks' performance. The presentation uses data collected from Yahoo Finance from November 2019 to March 2020 to calculate geometric mean returns, assess risk using Beta values and Sharpe ratios, and evaluate qualitative factors like PE ratios and EPS. It highlights the impact of the pandemic on stock prices, including market volatility and rating downgrades. The findings suggest that while all stocks experienced a downturn, CSL showed positive growth potential, making it a favorable long-term investment option. The presentation concludes with recommendations and a bibliography of referenced sources.
Document Page
MANAGING FINANCE
Name of the student
Name of the University
Author’s Note
tabler-icon-diamond-filled.svg

Secure Best Marks with AI Grader

Need help grading? Try our AI Grader for instant feedback on your assignments.
Document Page
Introduction
WHO, World Health Organization 1st declared COVID 19 is a
pandemic all over the world.
Global Economy could shrink by approximately 1% in 2020 due to
COVID-19 Pandemic Which is opposite reflection of 2.5% growth.
An unpredictable reaction in financial market due to COVID 19
Document Page
Selected Stock
Australia and New Zealand Banking group Limited
Price= 15.52
Market cap= 46.91B
CSL Limited
Price= 324.15
Market cap= 147.122B
Document Page
Data Analysis
Data collected from Yahoo finance
Taking period- 30-Nov-2019 to 31-Mar-2020
tabler-icon-diamond-filled.svg

Secure Best Marks with AI Grader

Need help grading? Try our AI Grader for instant feedback on your assignments.
Document Page
Geometric Mean return
Calculation of Geo-mean return for both the stocks are as follows:
ANZ- 0.995
CSL- 1.001
Geometric return indicates the compound effect of return and the
performance of the stock.
Document Page
Risk
Total risk= Systematic risk + Unsystematic risk
ANZ CSL Rm
Systematic risk (β) 0.584 0.973
Unsystematic risk
(STDV) 0.031 0.034 0.026
Total Risk 0.615 1.007
Document Page
Systematic risk
ΒETA of ANZ= 0.584
ΒETA of CSL= 0.973
Beta <1 Defensive stock
Beta >1 Aggressive stock
Beta =1 Stock at per
tabler-icon-diamond-filled.svg

Paraphrase This Document

Need a fresh take? Get an instant paraphrase of this document with our AI Paraphraser
Document Page
Risk adjusted return
Sharp ratio= (return of stock – risk free rate)/STDV
ANZ CSL
Expected return -0.0042 0.0011
Rf 0.000026
Er-Rf -0.00421 0.00105
STDV 0.031 0.03403
Risk adjusted return -13.61% 3.07%
Document Page
Recommendation
Qualitative factor
ANZ
PE ratio= 8.19
EPS= 2.02
CSL
PE ratio= 73.80
EPS= 4.42
Document Page
Impact of the stock
All the stock price has shown 5% down, ANZ is optimistic in a long term view with the
effective policy and swift action, this would be three, four and five months impact.
CSL noted that current situation presents a number of challenges to its plasma collection
operations, therefore the company anticipated modest delays across the capital projects.
Many of the investors has faced loss during this time. But CSL shown the positive growth,
where an investor can expect to go for long.
Due to the spread of Corona Virus, rating agency FITCH has downgraded the ratings of
Australian bank to A+ from AA- the bank stock came under the significant pressure
because of this outbreak.
Due to this COVID 19, millions of workers has faced loosing of their jobs, the world is
starting at a recession, economic output in June 2020. There has been seen much more
volatility in the market.
tabler-icon-diamond-filled.svg

Secure Best Marks with AI Grader

Need help grading? Try our AI Grader for instant feedback on your assignments.
Document Page
Bibliography
Fernandes, N., (2020). Economic effects of coronavirus outbreak (COVID-19) on the
world economy. Available at SSRN 3557504.
Massart, E.M., Hendrickx, J.M. and Absil, P.A., (2015). Approximate matrix geometric
means based on the inductive mean.
Waemustafa, W. and Sukri, S., (2016). Systematic and unsystematic risk determinants of
liquidity risk between Islamic and conventional banks. International Journal of
Economics and Financial Issues, 6(4), pp.1321-1327.
Livingston, M., & Zhou, L. (2016). Information opacity and Fitch bond ratings. Journal
of Financial Research, 39(4), 329-357.
Lorig, M., & Sircar, R. (2016). Portfolio optimization under local-stochastic volatility:
Coefficient taylor series approximations and implied sharpe ratio. SIAM Journal on
Financial Mathematics, 7(1), 418-447.
Document Page
Thank You…..
chevron_up_icon
1 out of 12
circle_padding
hide_on_mobile
zoom_out_icon
[object Object]