Finance Exam Solution - Investment Decisions and Cost Analysis

Verified

Added on  2023/01/07

|7
|1001
|76
Homework Assignment
AI Summary
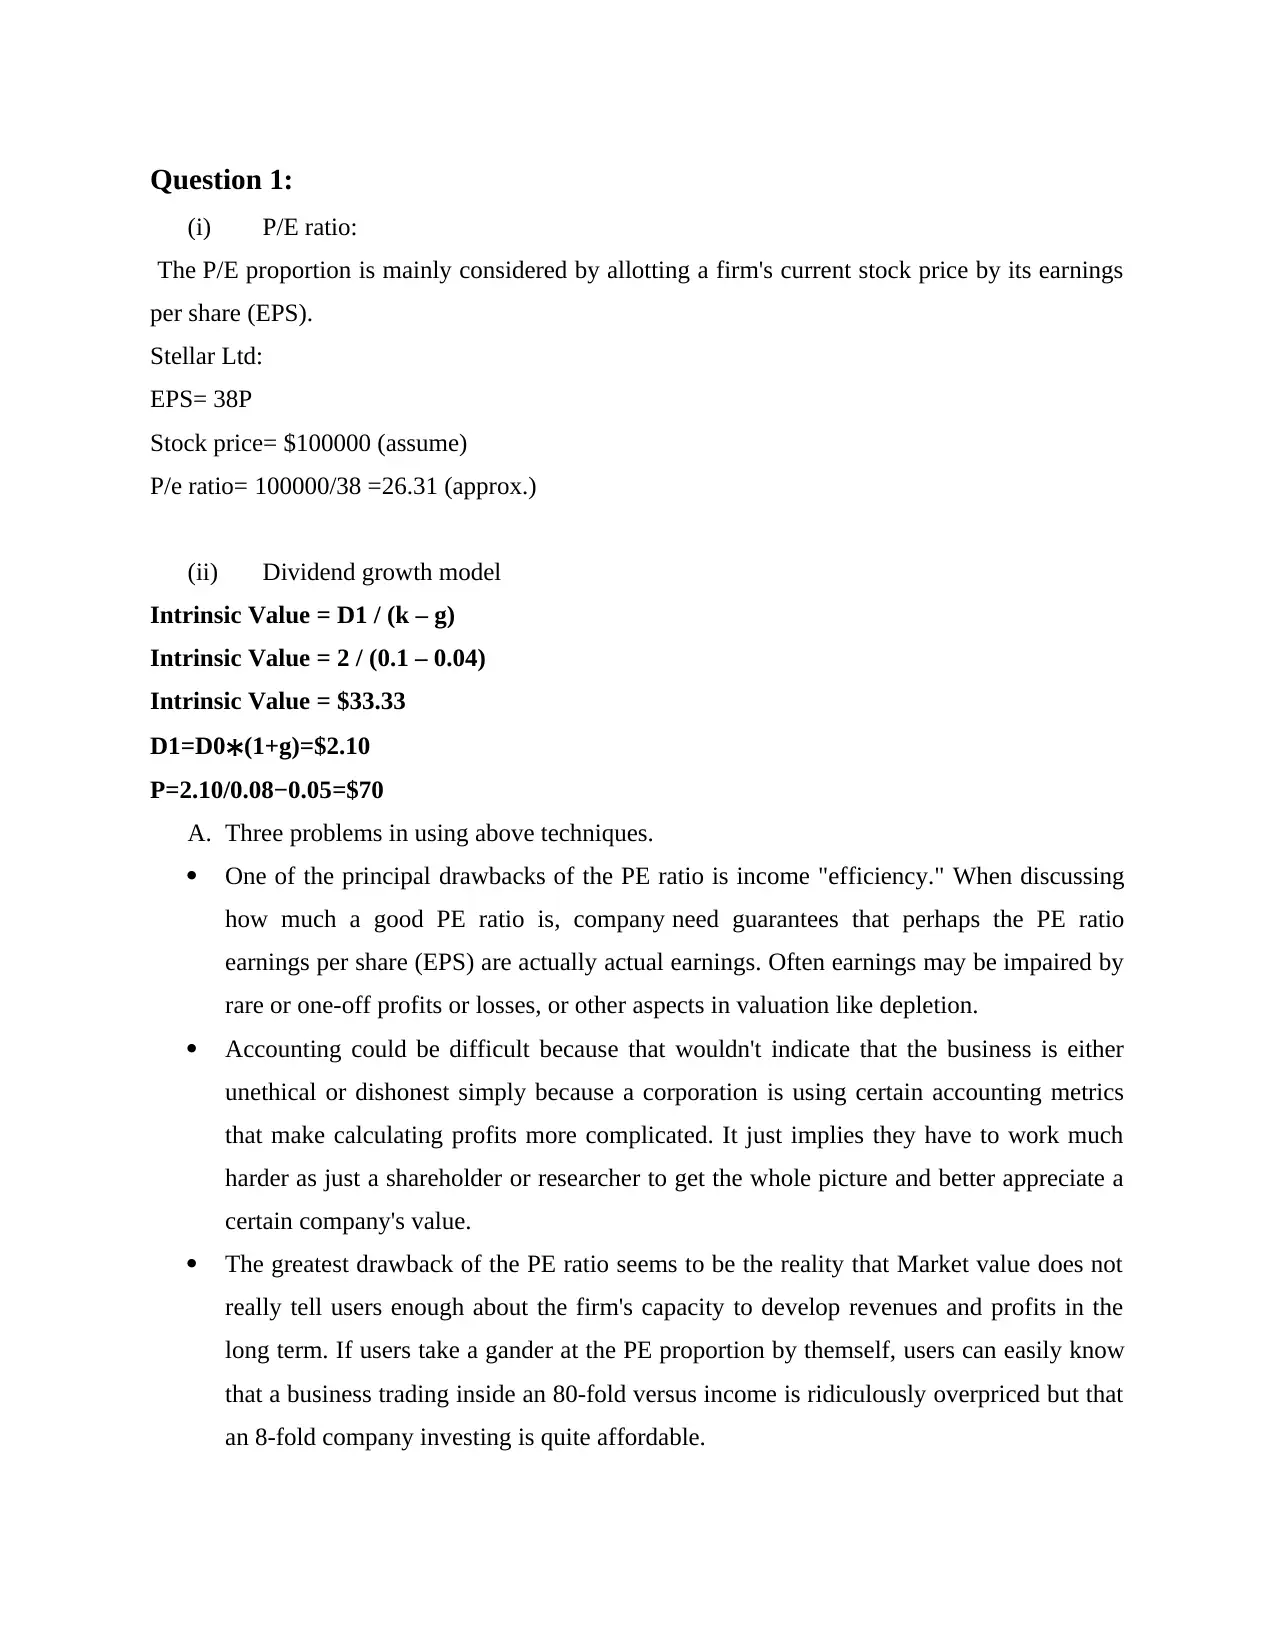
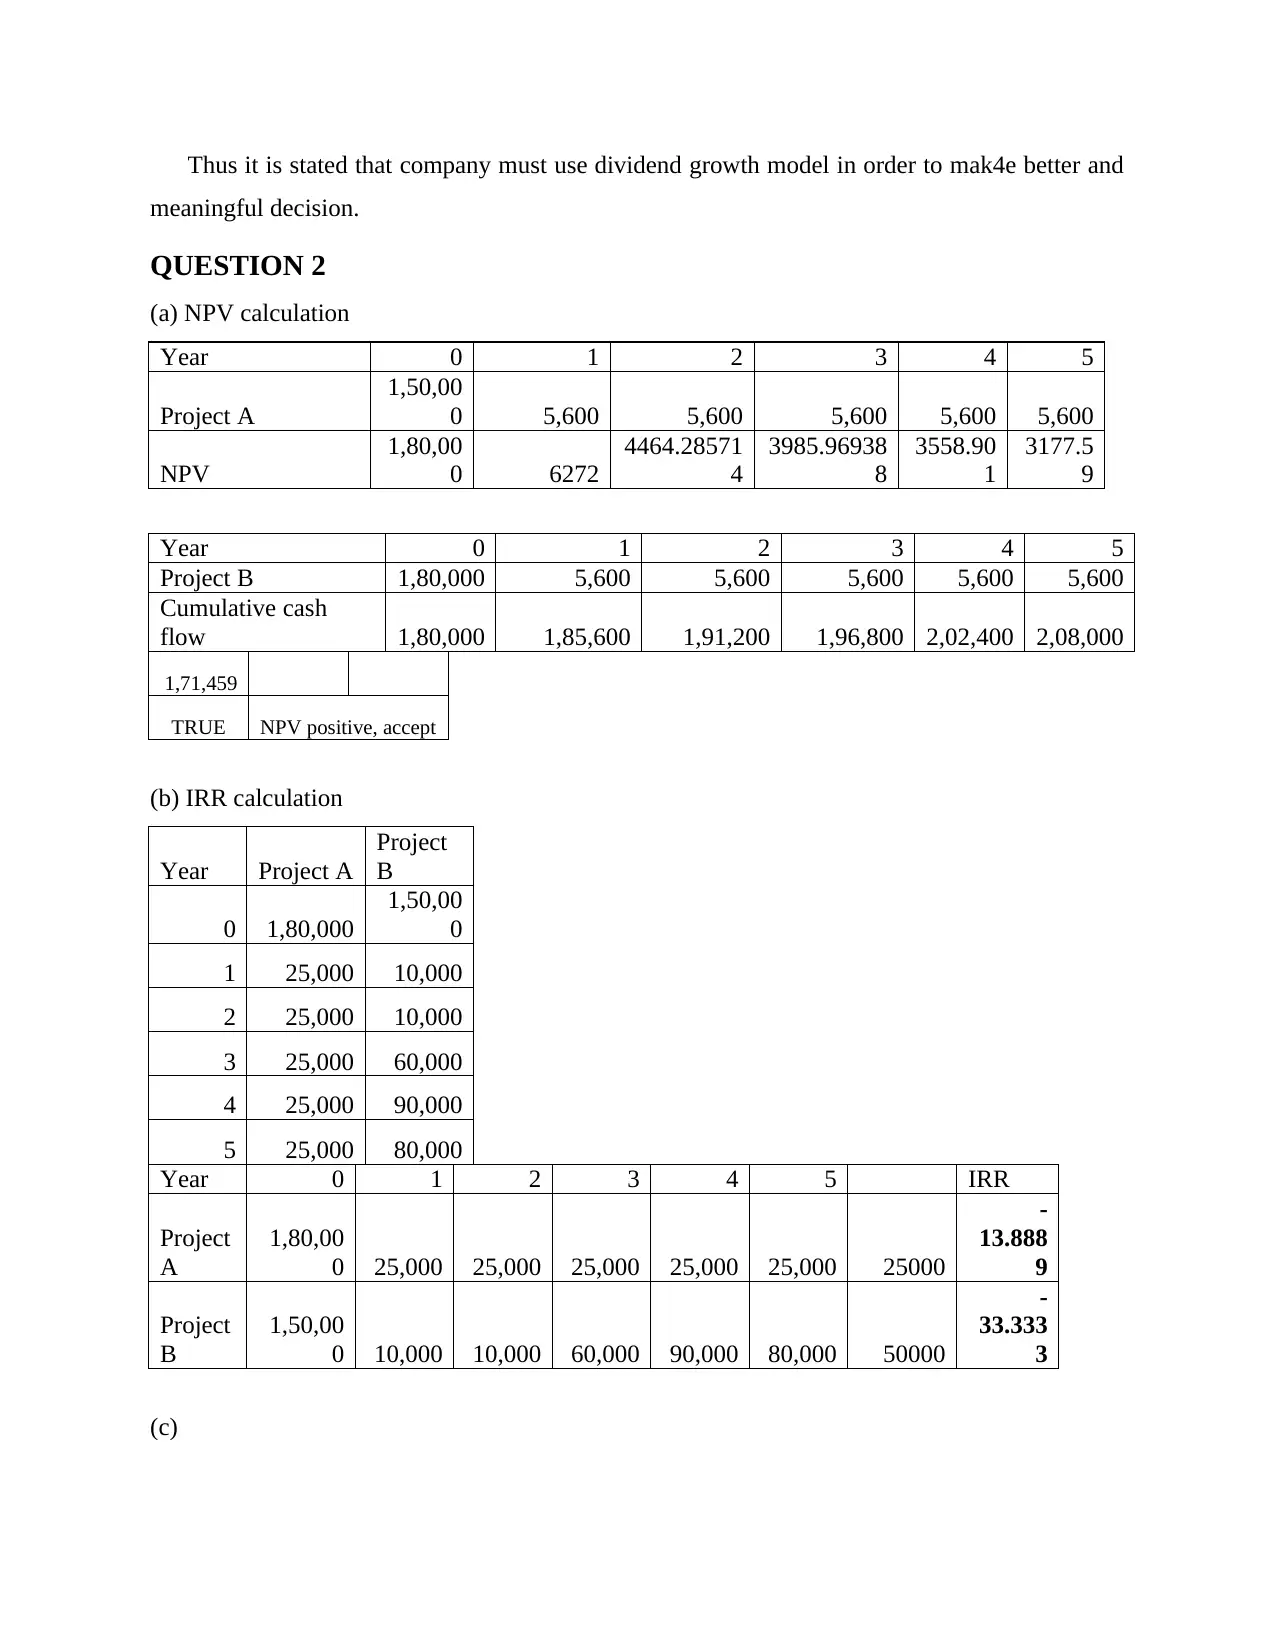
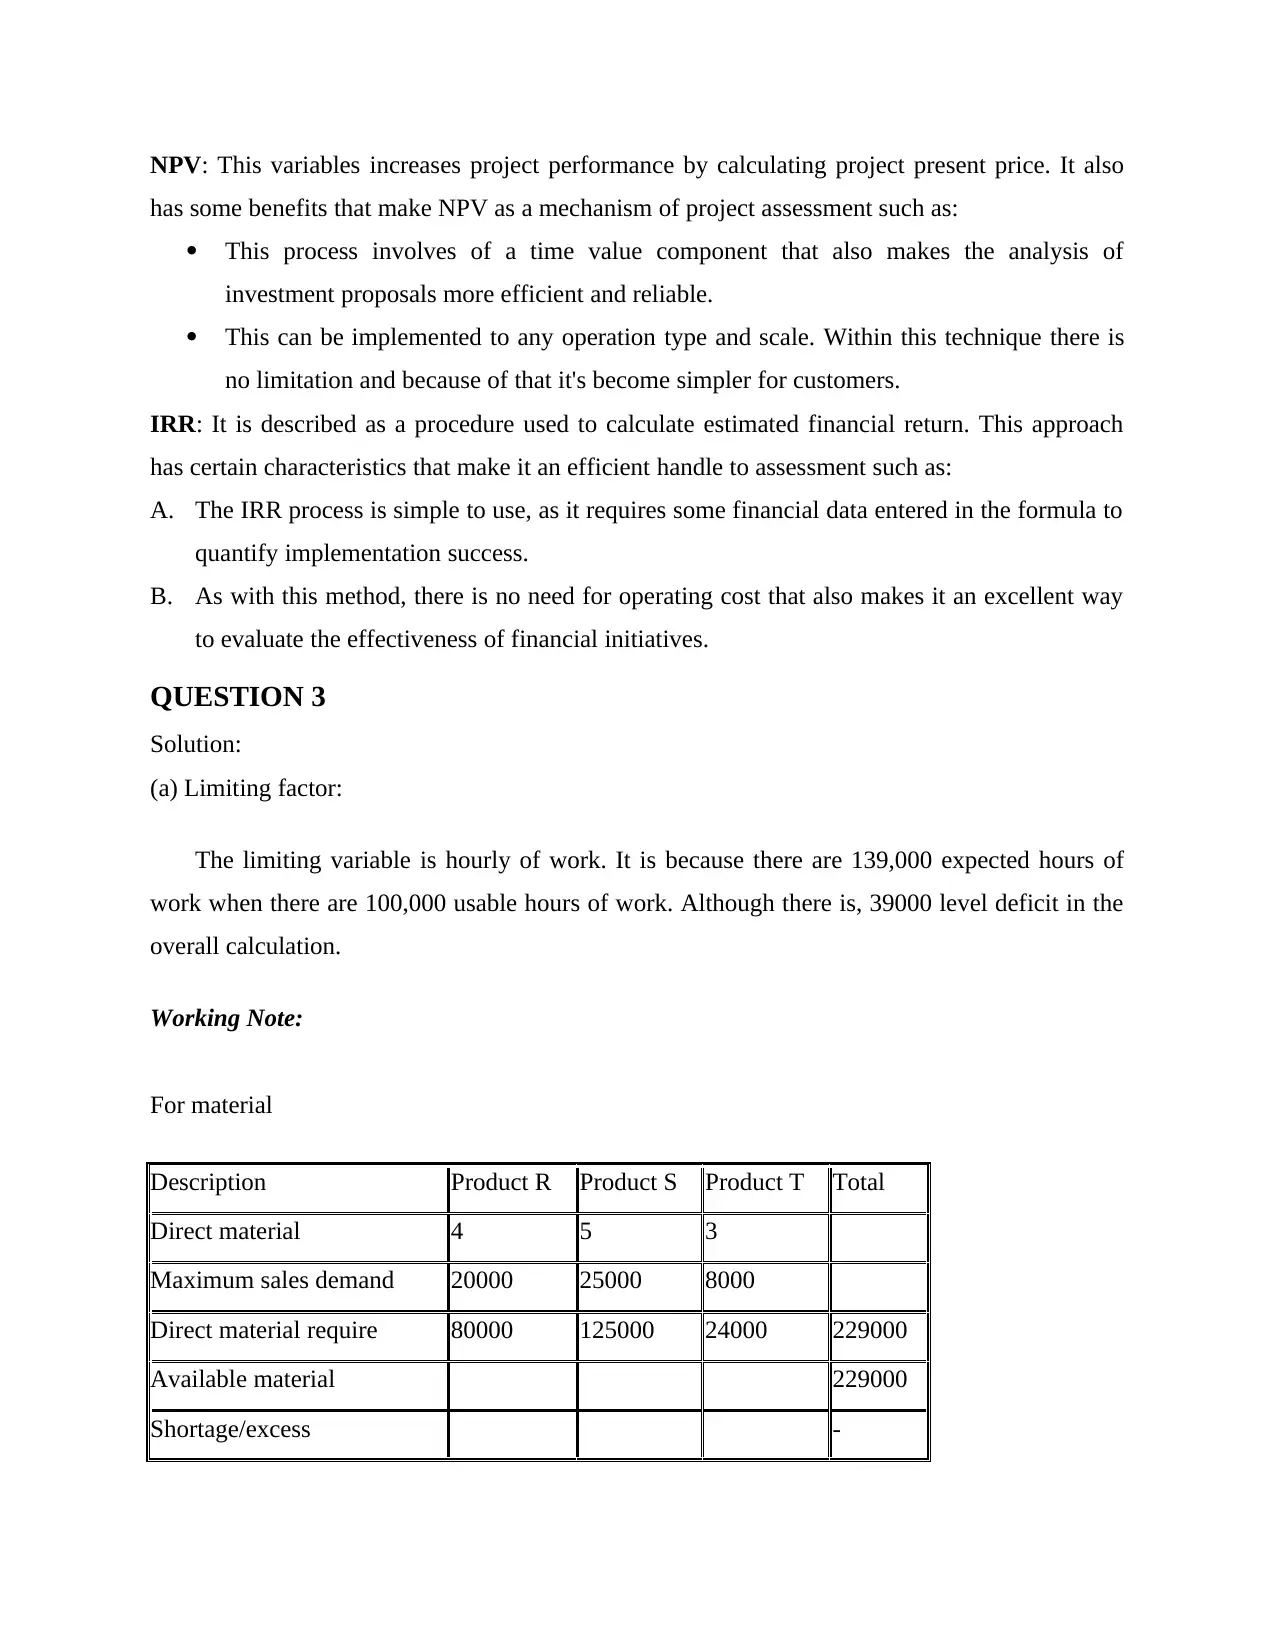
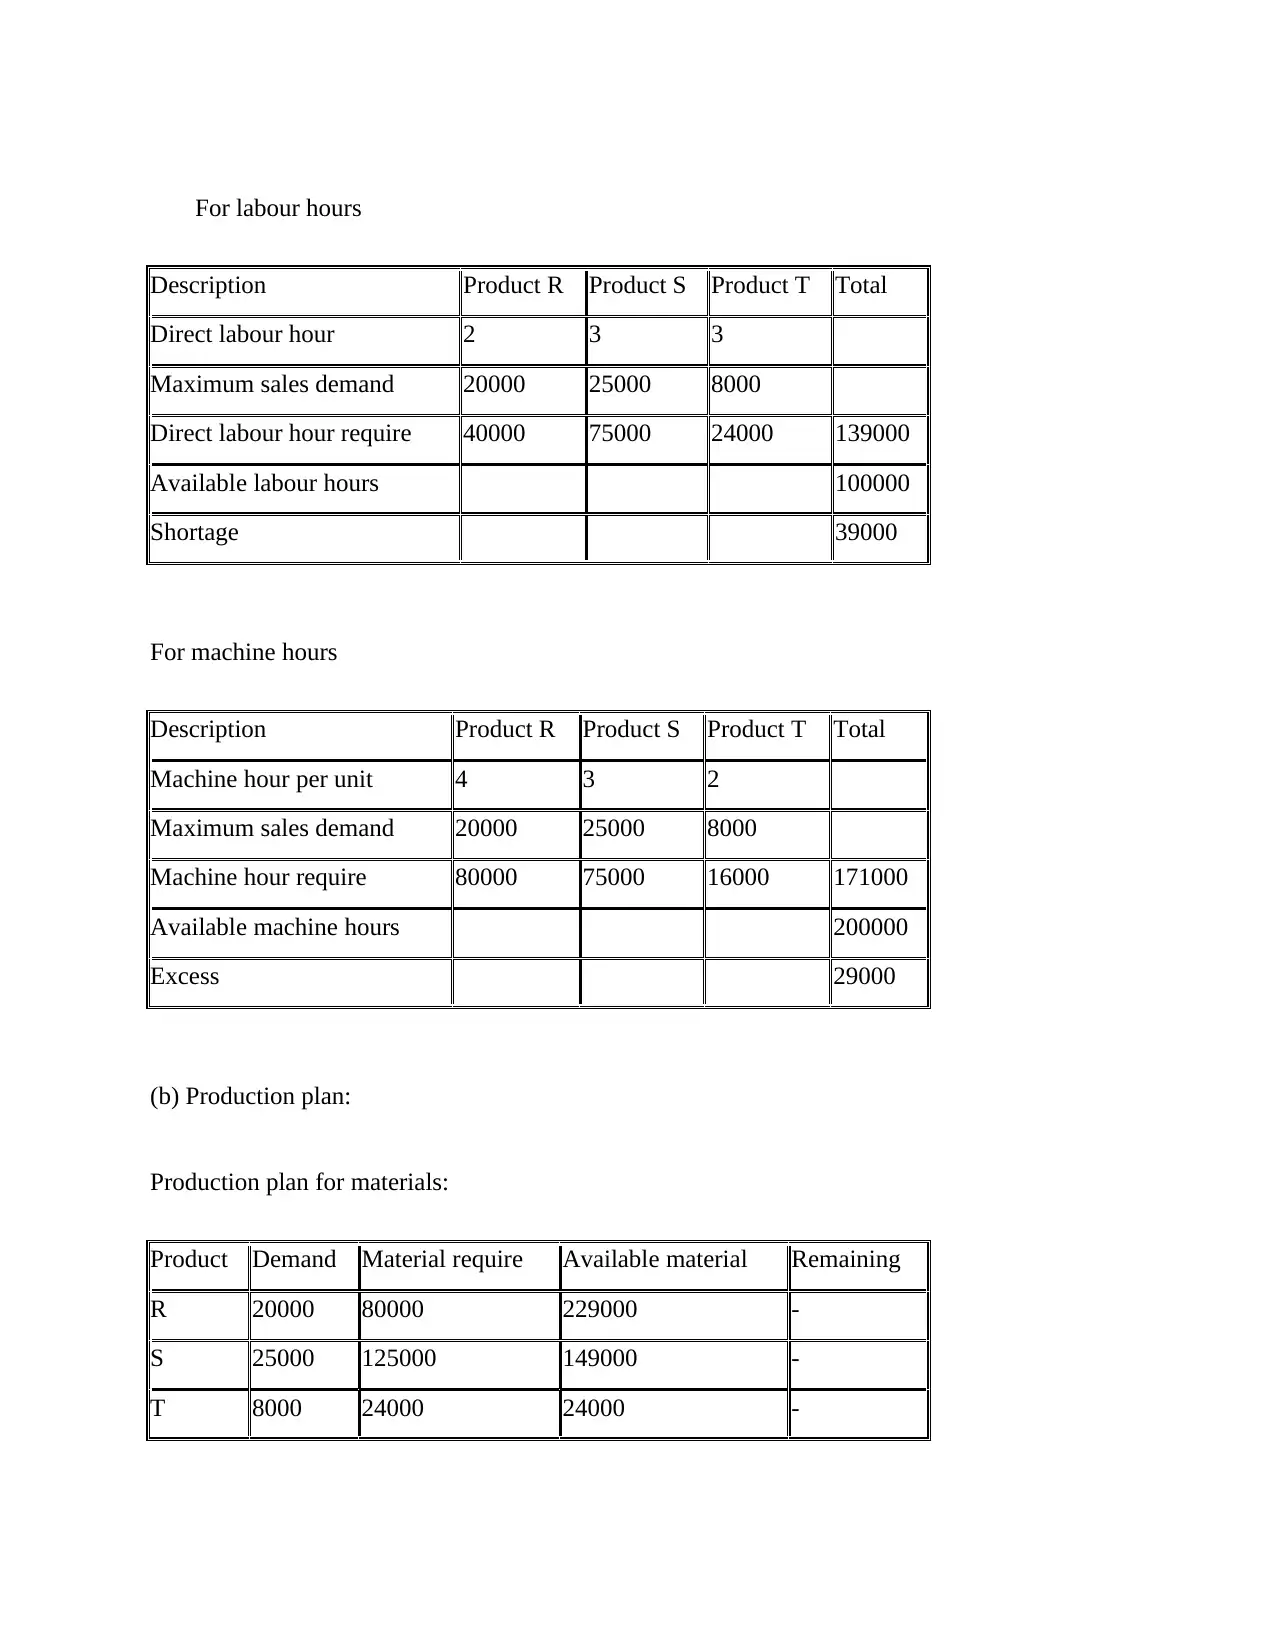
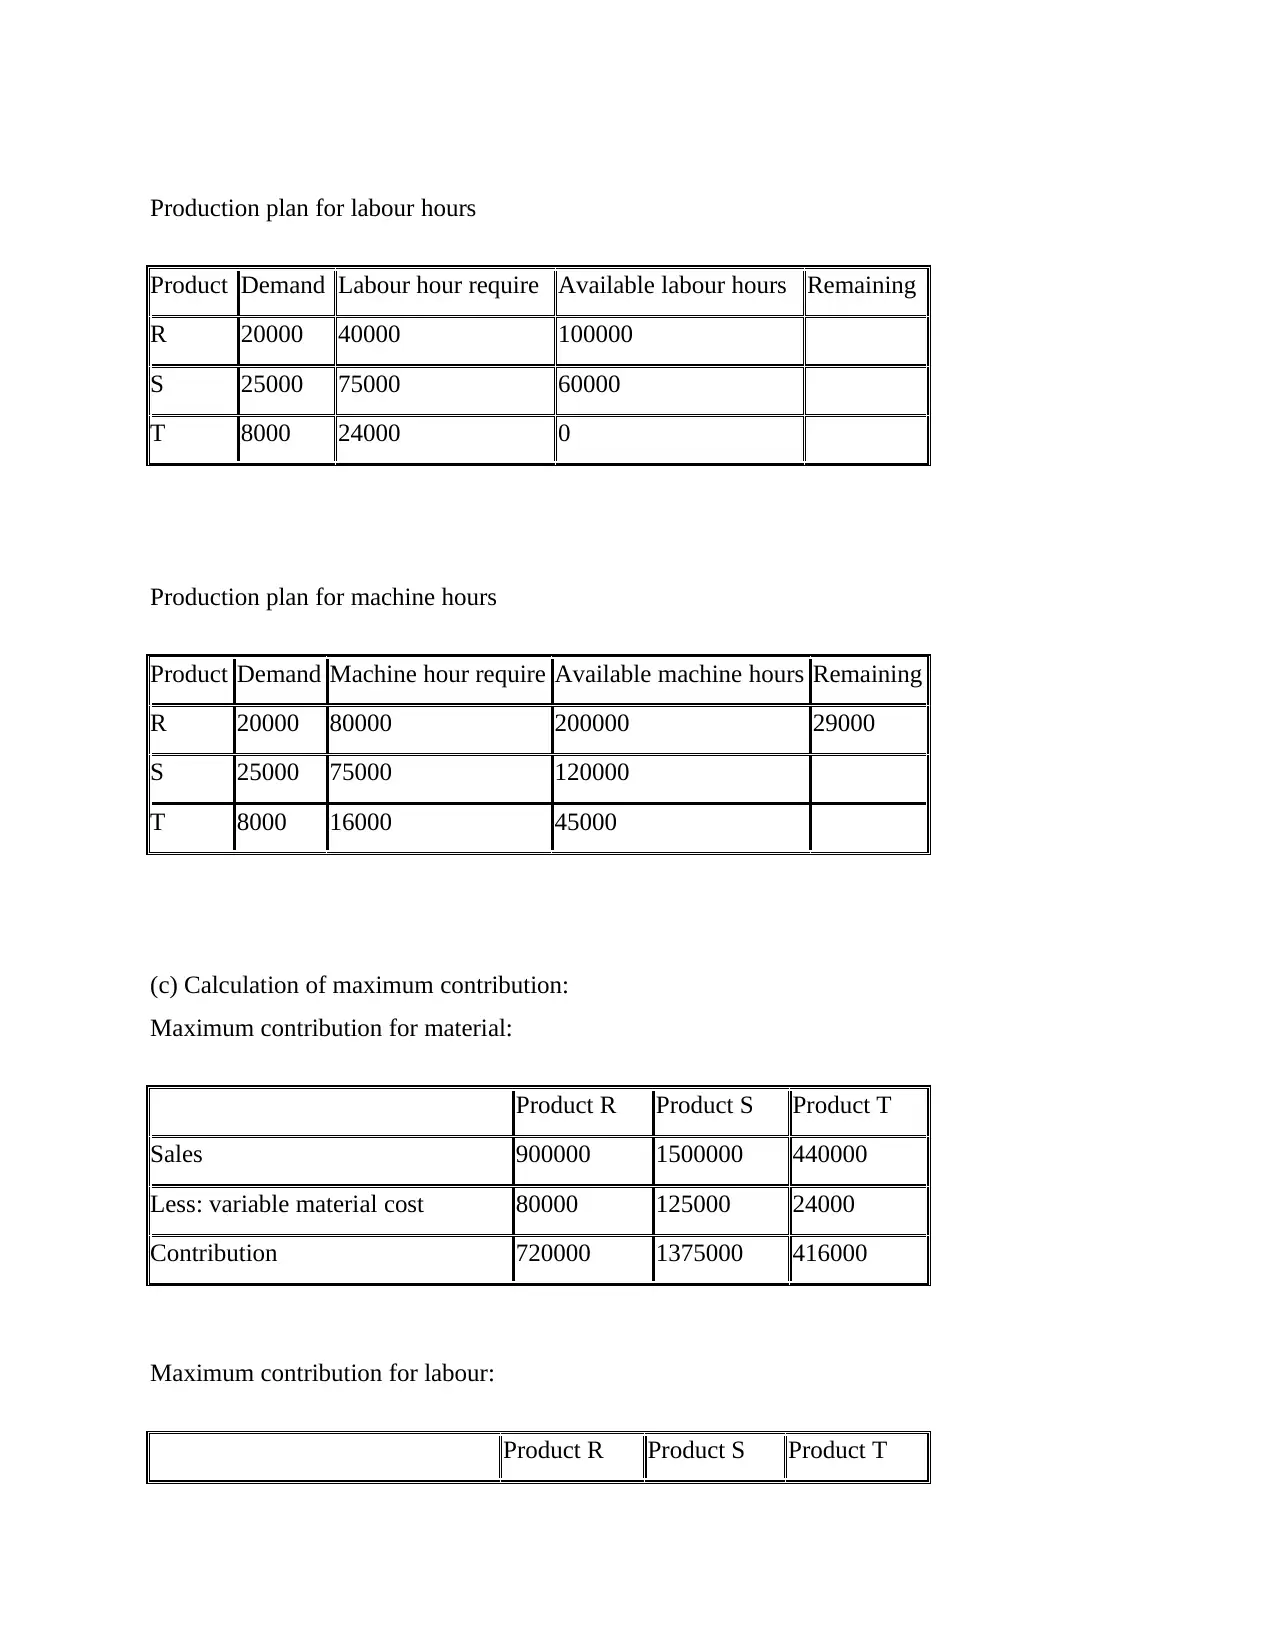
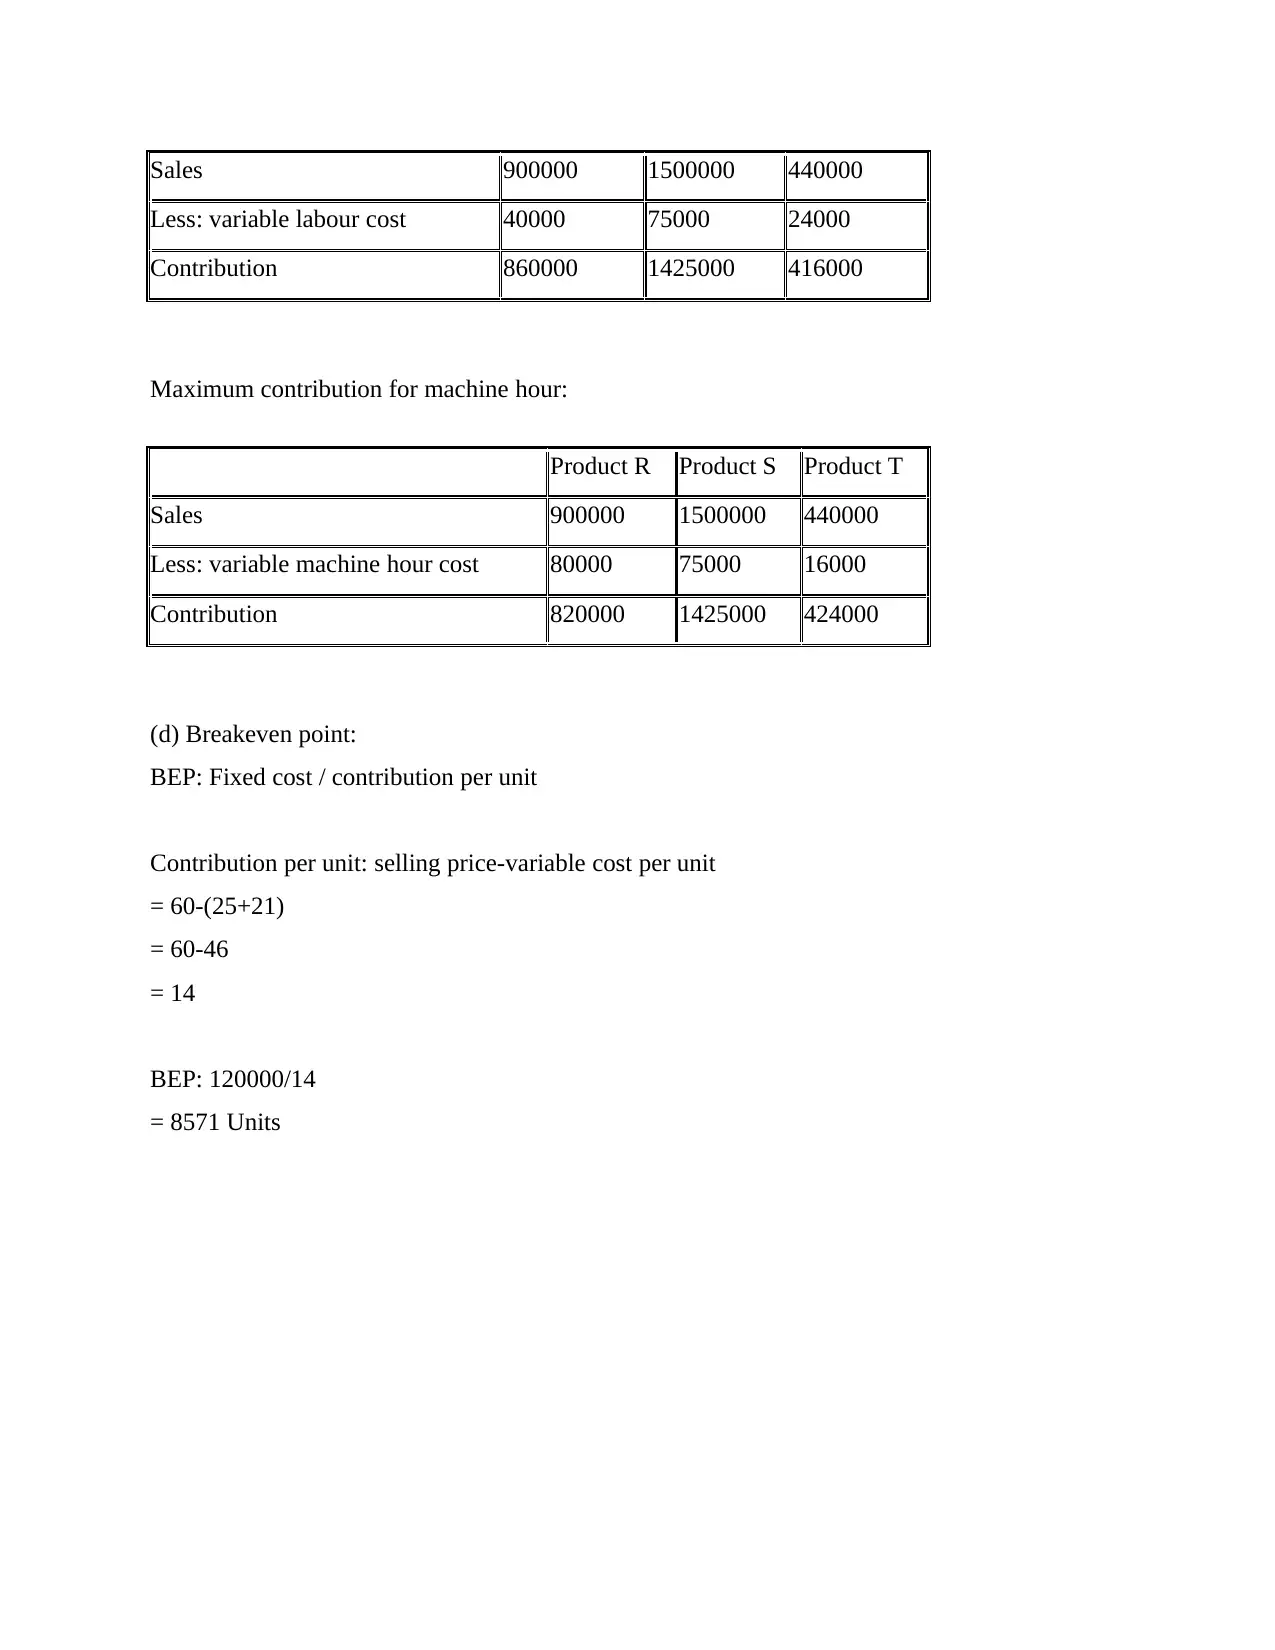
This document provides a detailed solution to a finance exam, addressing key concepts in investment analysis and production planning. The solution begins with calculations for the P/E ratio and intrinsic value using the dividend growth model, followed by a discussion of their limitations. The second part of the solution involves calculating the Net Present Value (NPV) and Internal Rate of Return (IRR) for two projects, along with an explanation of their benefits. The third section focuses on production planning, identifying the limiting factor, creating production plans for materials, labor, and machine hours, calculating maximum contribution, and determining the breakeven point. The solution includes working notes and comprehensive calculations to support the answers.
tabler-icon-diamond-filled.svg

Contribute Materials

Your contribution can guide someone’s learning journey. Share your documents today.
Document Page
Finance (online exam)
tabler-icon-diamond-filled.svg

Secure Best Marks with AI Grader

Need help grading? Try our AI Grader for instant feedback on your assignments.
Document Page
Question 1:
(i) P/E ratio:
The P/E proportion is mainly considered by allotting a firm's current stock price by its earnings
per share (EPS).
Stellar Ltd:
EPS= 38P
Stock price= $100000 (assume)
P/e ratio= 100000/38 =26.31 (approx.)
(ii) Dividend growth model
Intrinsic Value = D1 / (k – g)
Intrinsic Value = 2 / (0.1 – 0.04)
Intrinsic Value = $33.33
D1=D0∗(1+g)=$2.10
P=2.10/0.08−0.05=$70
A. Three problems in using above techniques.
ï‚· One of the principal drawbacks of the PE ratio is income "efficiency." When discussing
how much a good PE ratio is, company need guarantees that perhaps the PE ratio
earnings per share (EPS) are actually actual earnings. Often earnings may be impaired by
rare or one-off profits or losses, or other aspects in valuation like depletion.
ï‚· Accounting could be difficult because that wouldn't indicate that the business is either
unethical or dishonest simply because a corporation is using certain accounting metrics
that make calculating profits more complicated. It just implies they have to work much
harder as just a shareholder or researcher to get the whole picture and better appreciate a
certain company's value.
ï‚· The greatest drawback of the PE ratio seems to be the reality that Market value does not
really tell users enough about the firm's capacity to develop revenues and profits in the
long term. If users take a gander at the PE proportion by themself, users can easily know
that a business trading inside an 80-fold versus income is ridiculously overpriced but that
an 8-fold company investing is quite affordable.
Document Page
Thus it is stated that company must use dividend growth model in order to mak4e better and
meaningful decision.
QUESTION 2
(a) NPV calculation
Year 0 1 2 3 4 5
Project A
1,50,00
0 5,600 5,600 5,600 5,600 5,600
NPV
1,80,00
0 6272
4464.28571
4
3985.96938
8
3558.90
1
3177.5
9
Year 0 1 2 3 4 5
Project B 1,80,000 5,600 5,600 5,600 5,600 5,600
Cumulative cash
flow 1,80,000 1,85,600 1,91,200 1,96,800 2,02,400 2,08,000
1,71,459
TRUE NPV positive, accept
(b) IRR calculation
Year Project A
Project
B
0 1,80,000
1,50,00
0
1 25,000 10,000
2 25,000 10,000
3 25,000 60,000
4 25,000 90,000
5 25,000 80,000
Year 0 1 2 3 4 5 IRR
Project
A
1,80,00
0 25,000 25,000 25,000 25,000 25,000 25000
-
13.888
9
Project
B
1,50,00
0 10,000 10,000 60,000 90,000 80,000 50000
-
33.333
3
(c)
Document Page
NPV: This variables increases project performance by calculating project present price. It also
has some benefits that make NPV as a mechanism of project assessment such as:
ï‚· This process involves of a time value component that also makes the analysis of
investment proposals more efficient and reliable.
ï‚· This can be implemented to any operation type and scale. Within this technique there is
no limitation and because of that it's become simpler for customers.
IRR: It is described as a procedure used to calculate estimated financial return. This approach
has certain characteristics that make it an efficient handle to assessment such as:
A. The IRR process is simple to use, as it requires some financial data entered in the formula to
quantify implementation success.
B. As with this method, there is no need for operating cost that also makes it an excellent way
to evaluate the effectiveness of financial initiatives.
QUESTION 3
Solution:
(a) Limiting factor:
The limiting variable is hourly of work. It is because there are 139,000 expected hours of
work when there are 100,000 usable hours of work. Although there is, 39000 level deficit in the
overall calculation.
Working Note:
For material
Description Product R Product S Product T Total
Direct material 4 5 3
Maximum sales demand 20000 25000 8000
Direct material require 80000 125000 24000 229000
Available material 229000
Shortage/excess -
tabler-icon-diamond-filled.svg

Secure Best Marks with AI Grader

Need help grading? Try our AI Grader for instant feedback on your assignments.
Document Page
For labour hours
Description Product R Product S Product T Total
Direct labour hour 2 3 3
Maximum sales demand 20000 25000 8000
Direct labour hour require 40000 75000 24000 139000
Available labour hours 100000
Shortage 39000
For machine hours
Description Product R Product S Product T Total
Machine hour per unit 4 3 2
Maximum sales demand 20000 25000 8000
Machine hour require 80000 75000 16000 171000
Available machine hours 200000
Excess 29000
(b) Production plan:
Production plan for materials:
Product Demand Material require Available material Remaining
R 20000 80000 229000 -
S 25000 125000 149000 -
T 8000 24000 24000 -
Document Page
Production plan for labour hours
Product Demand Labour hour require Available labour hours Remaining
R 20000 40000 100000
S 25000 75000 60000
T 8000 24000 0
Production plan for machine hours
Product Demand Machine hour require Available machine hours Remaining
R 20000 80000 200000 29000
S 25000 75000 120000
T 8000 16000 45000
(c) Calculation of maximum contribution:
Maximum contribution for material:
Product R Product S Product T
Sales 900000 1500000 440000
Less: variable material cost 80000 125000 24000
Contribution 720000 1375000 416000
Maximum contribution for labour:
Product R Product S Product T
Document Page
Sales 900000 1500000 440000
Less: variable labour cost 40000 75000 24000
Contribution 860000 1425000 416000
Maximum contribution for machine hour:
Product R Product S Product T
Sales 900000 1500000 440000
Less: variable machine hour cost 80000 75000 16000
Contribution 820000 1425000 424000
(d) Breakeven point:
BEP: Fixed cost / contribution per unit
Contribution per unit: selling price-variable cost per unit
= 60-(25+21)
= 60-46
= 14
BEP: 120000/14
= 8571 Units
chevron_up_icon
1 out of 7
circle_padding
hide_on_mobile
zoom_out_icon
logo.png

Your All-in-One AI-Powered Toolkit for Academic Success.

Available 24*7 on WhatsApp / Email

[object Object]