University Finance Report: Project Investment and Analysis

Verified

Added on  2020/03/16

|15
|2602
|33
Report
AI Summary
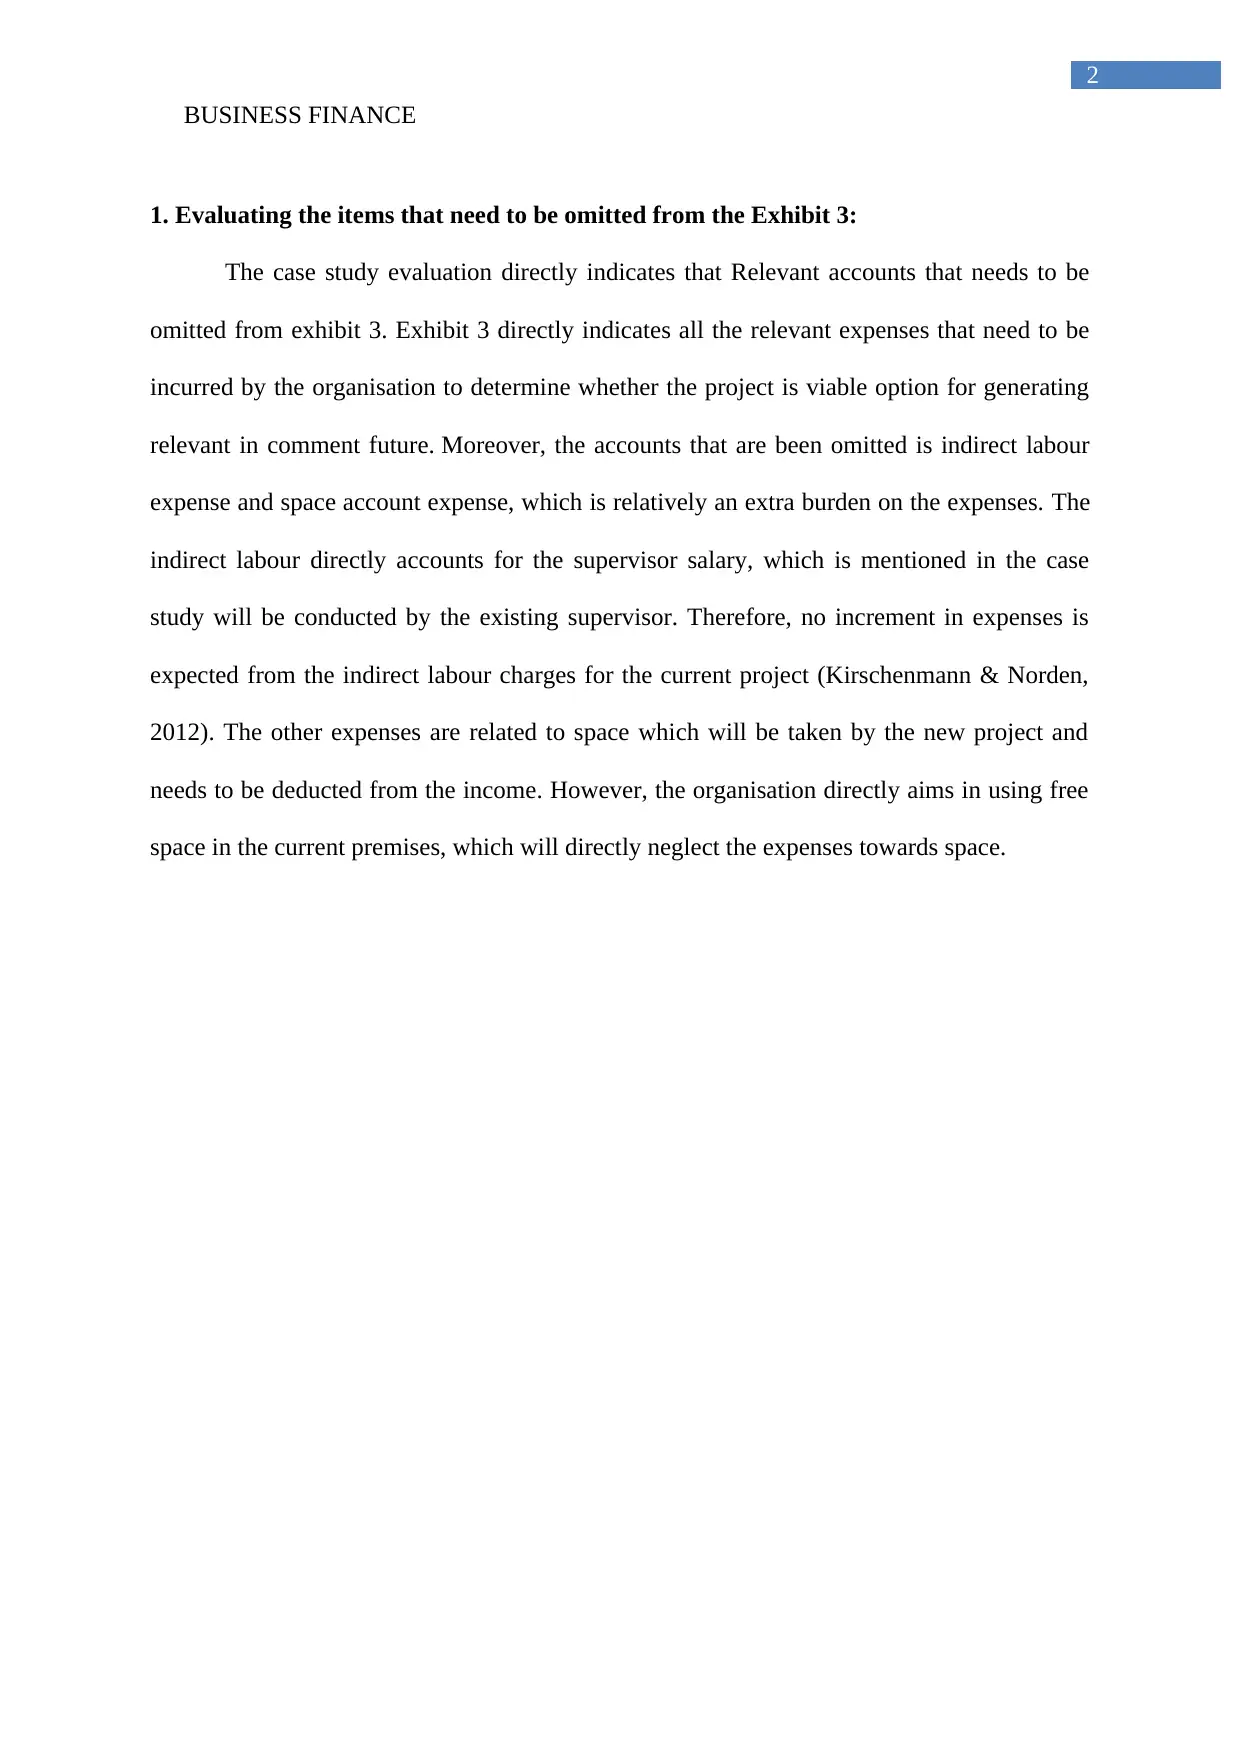
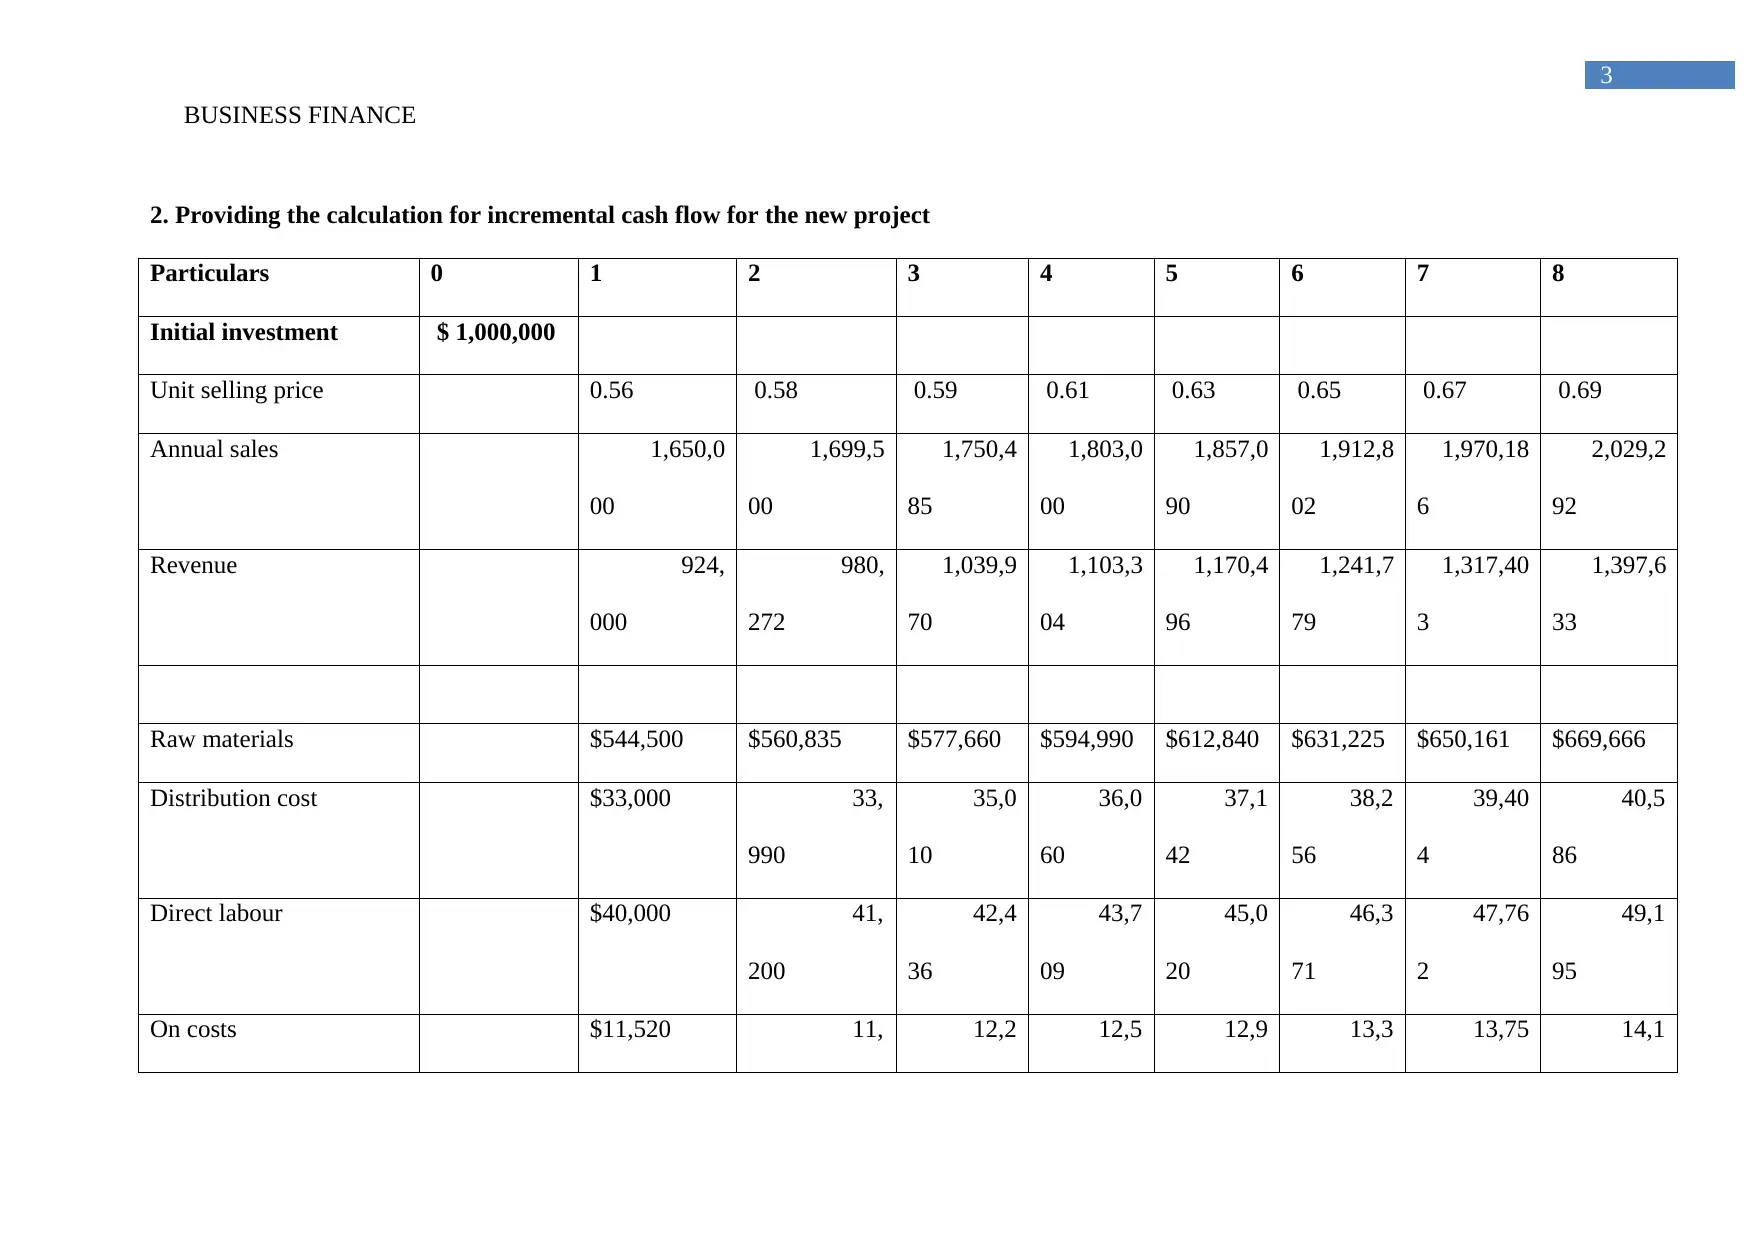
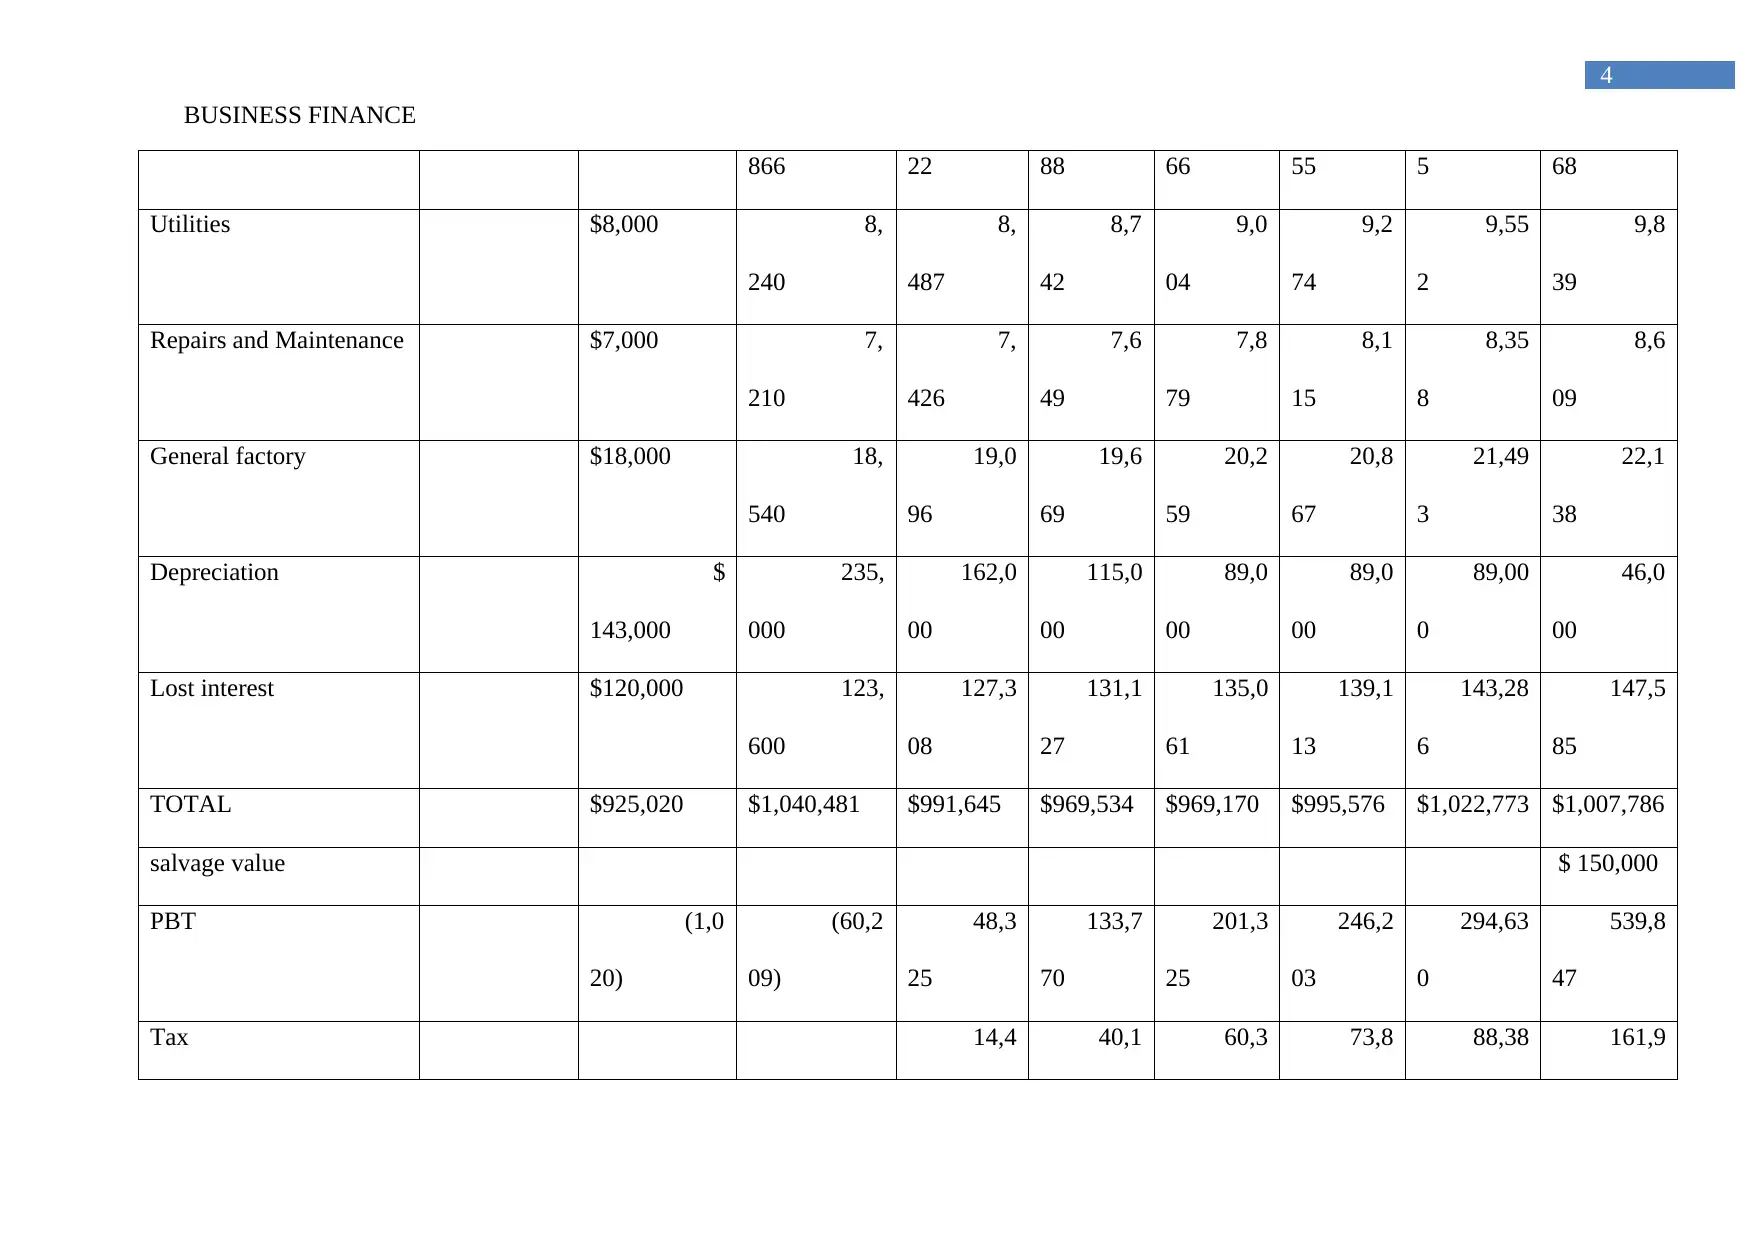
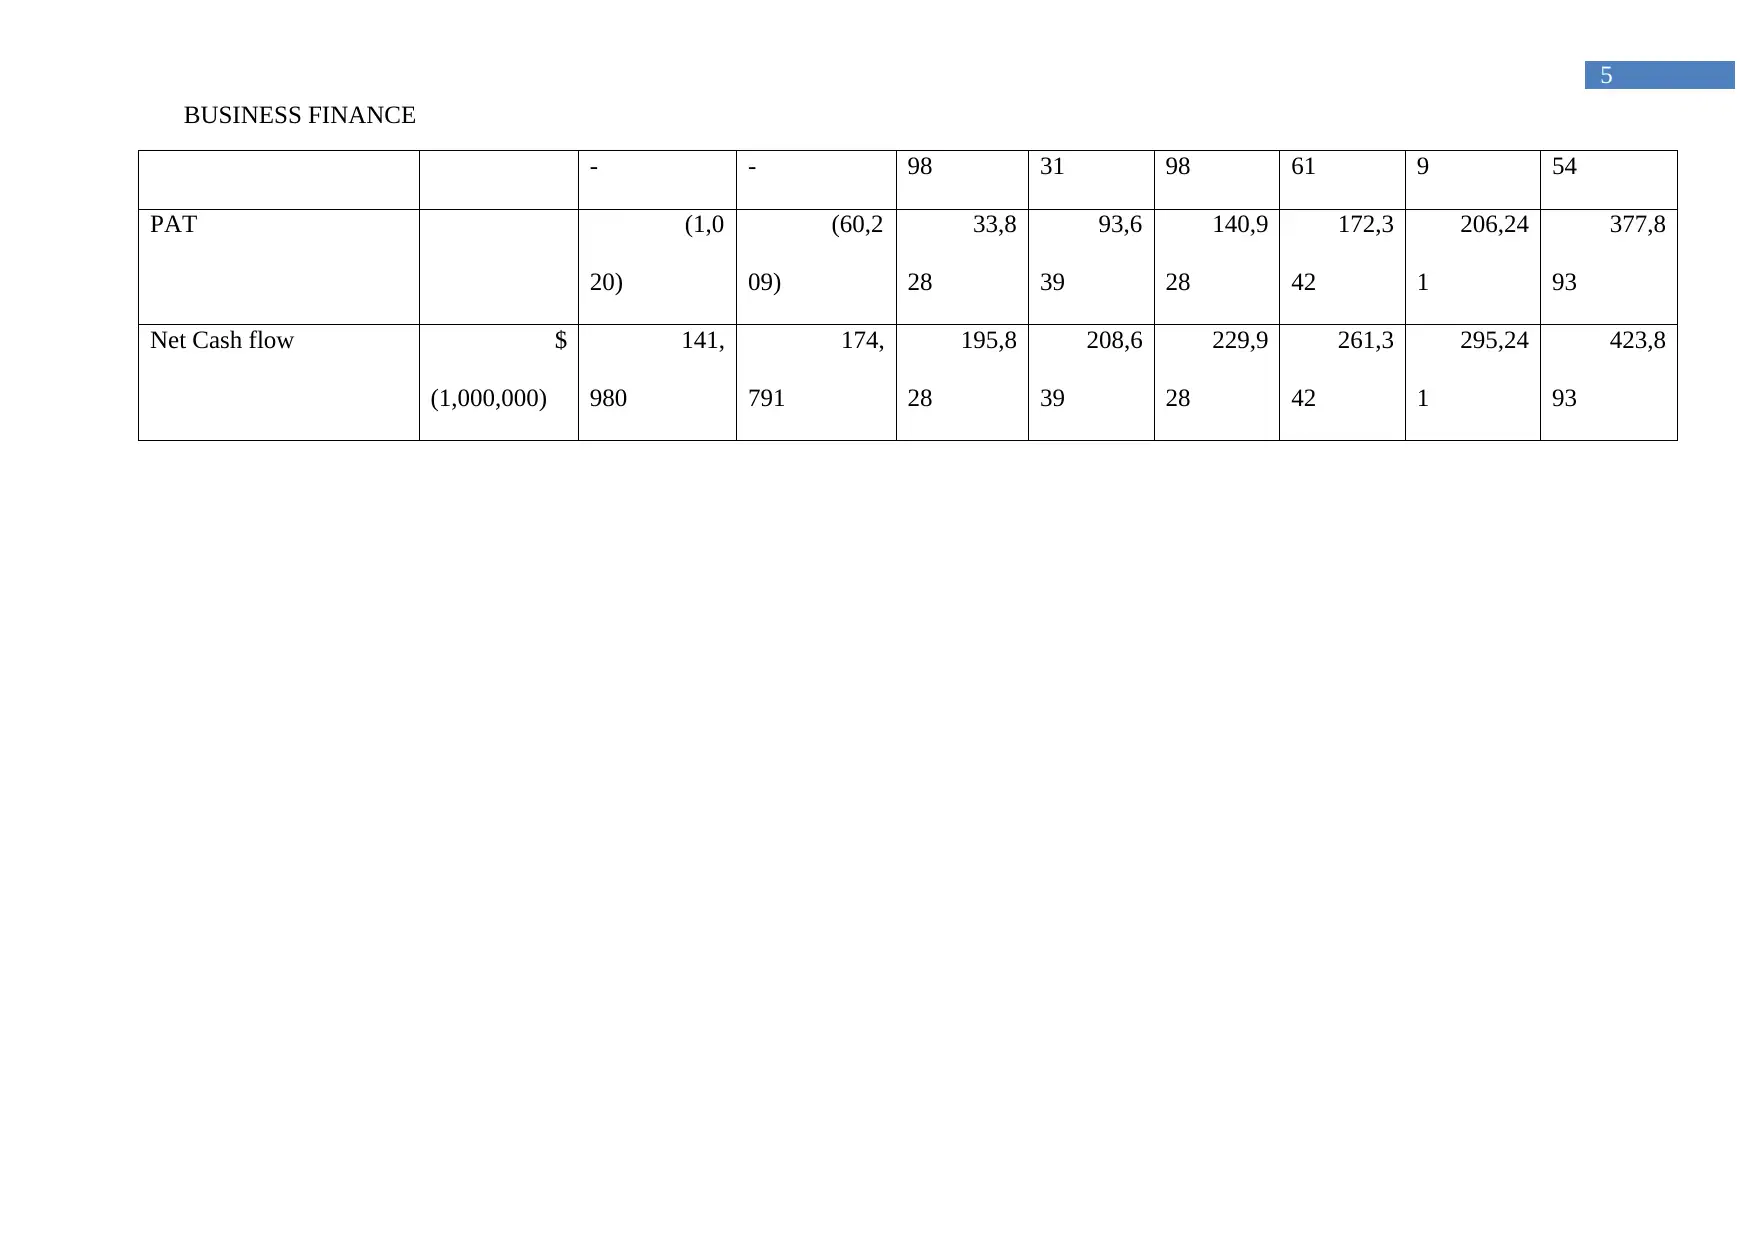
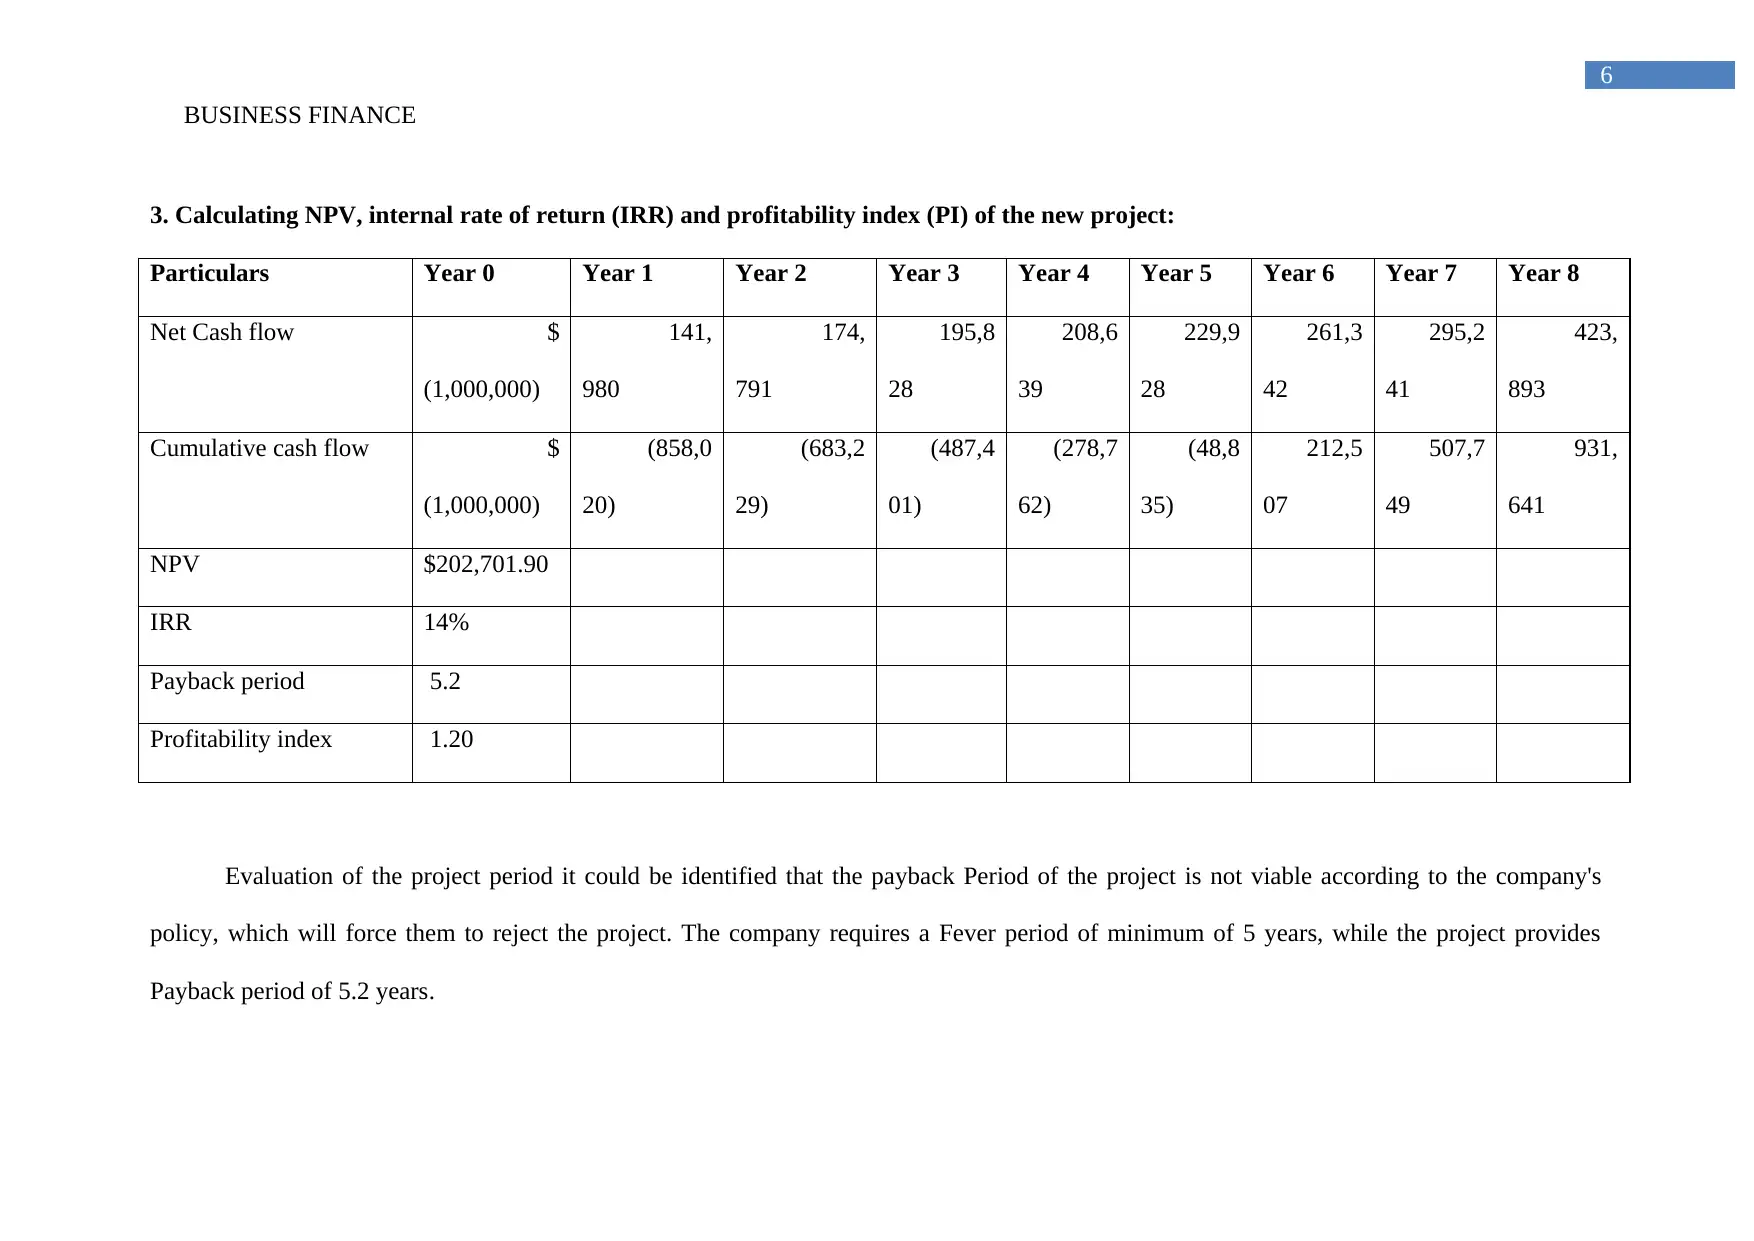
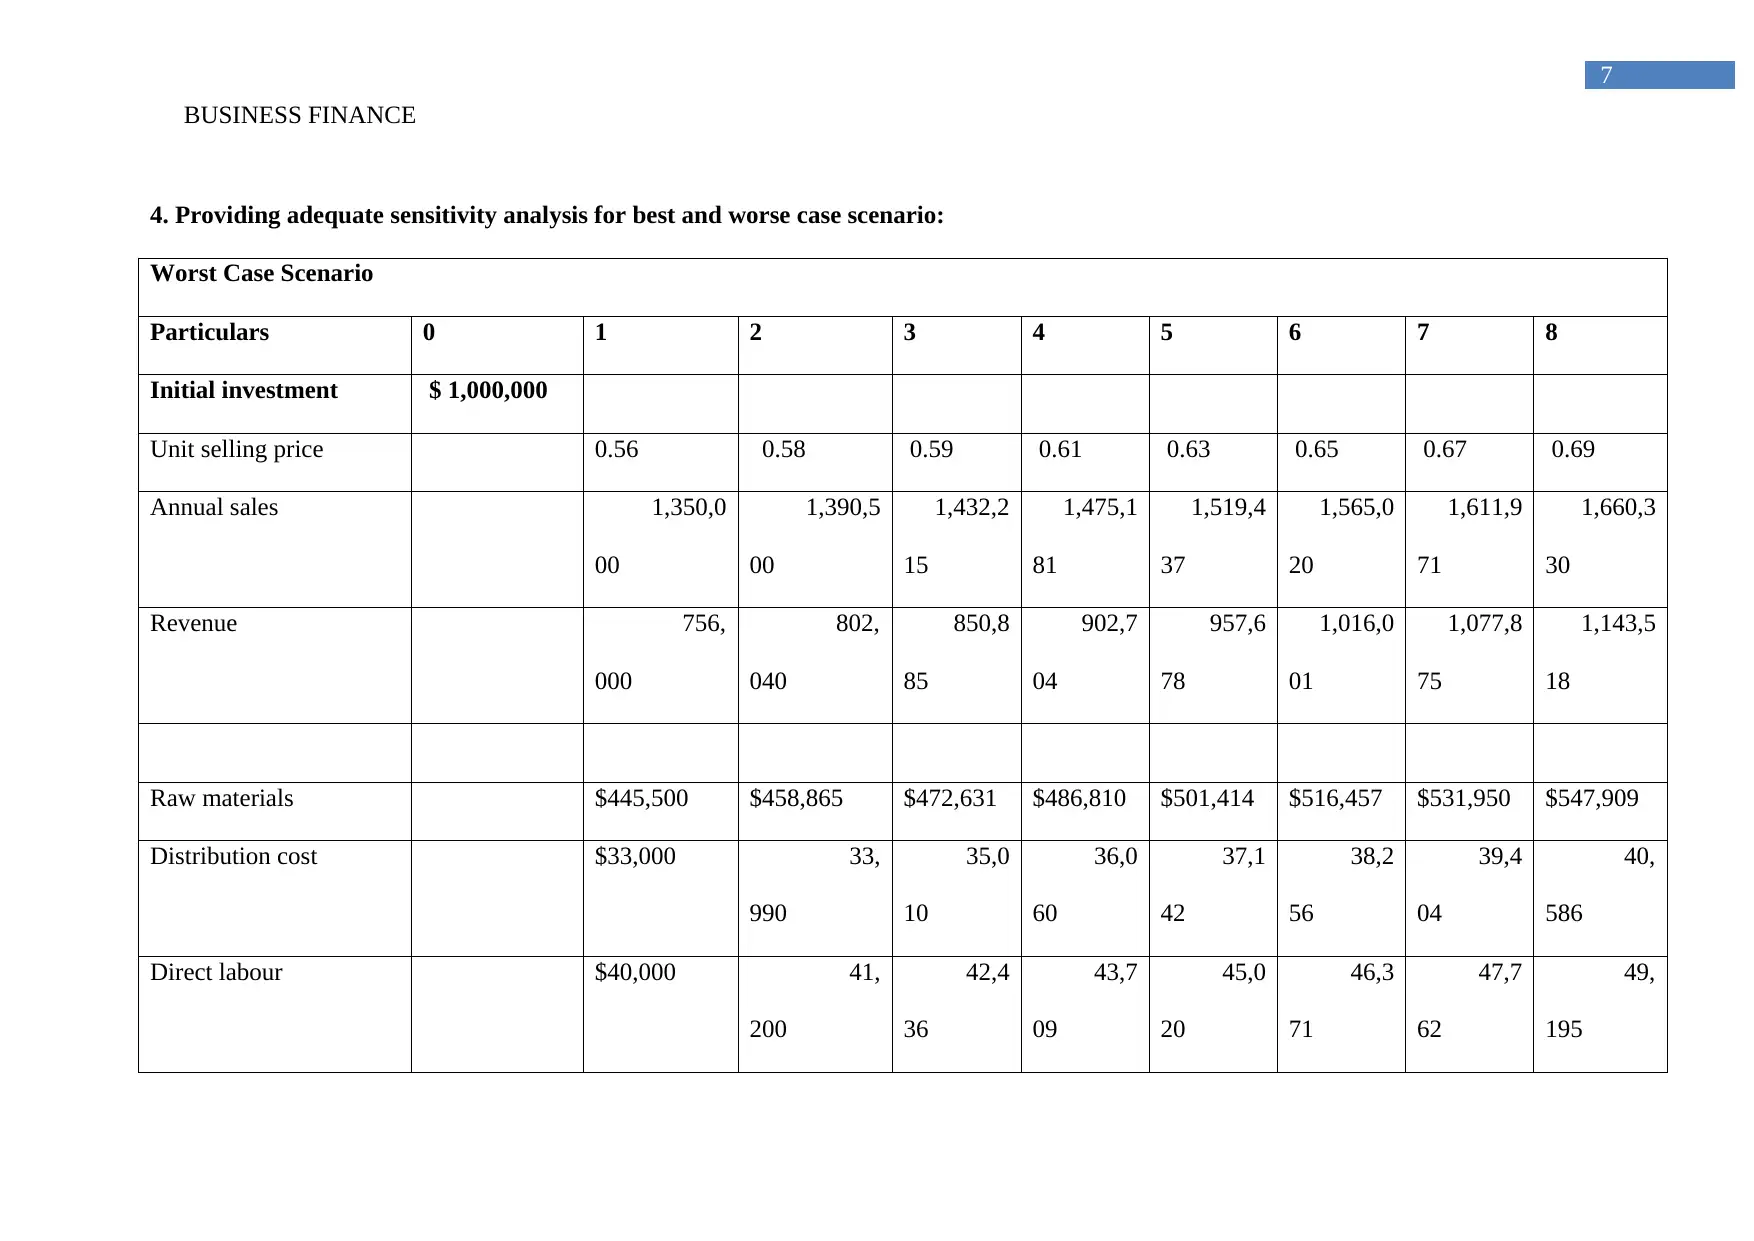
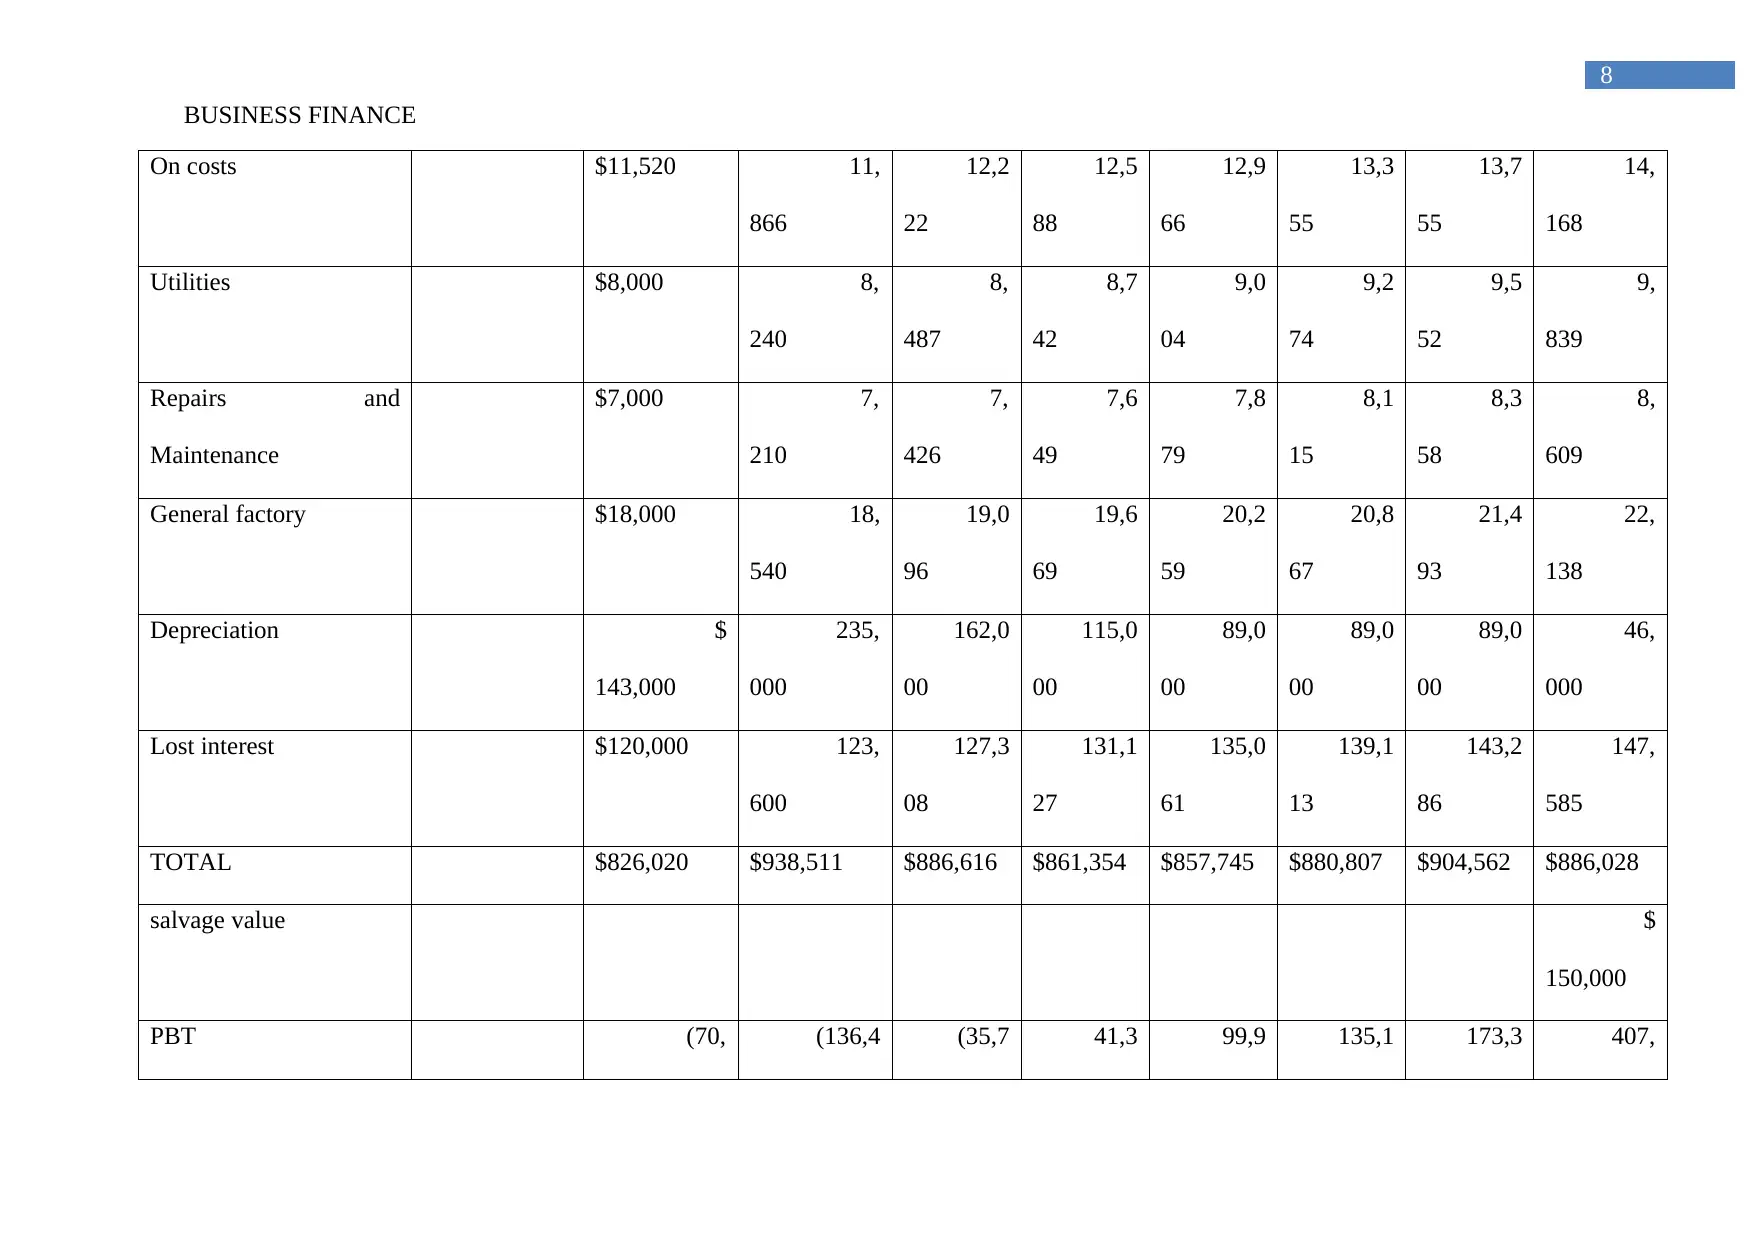
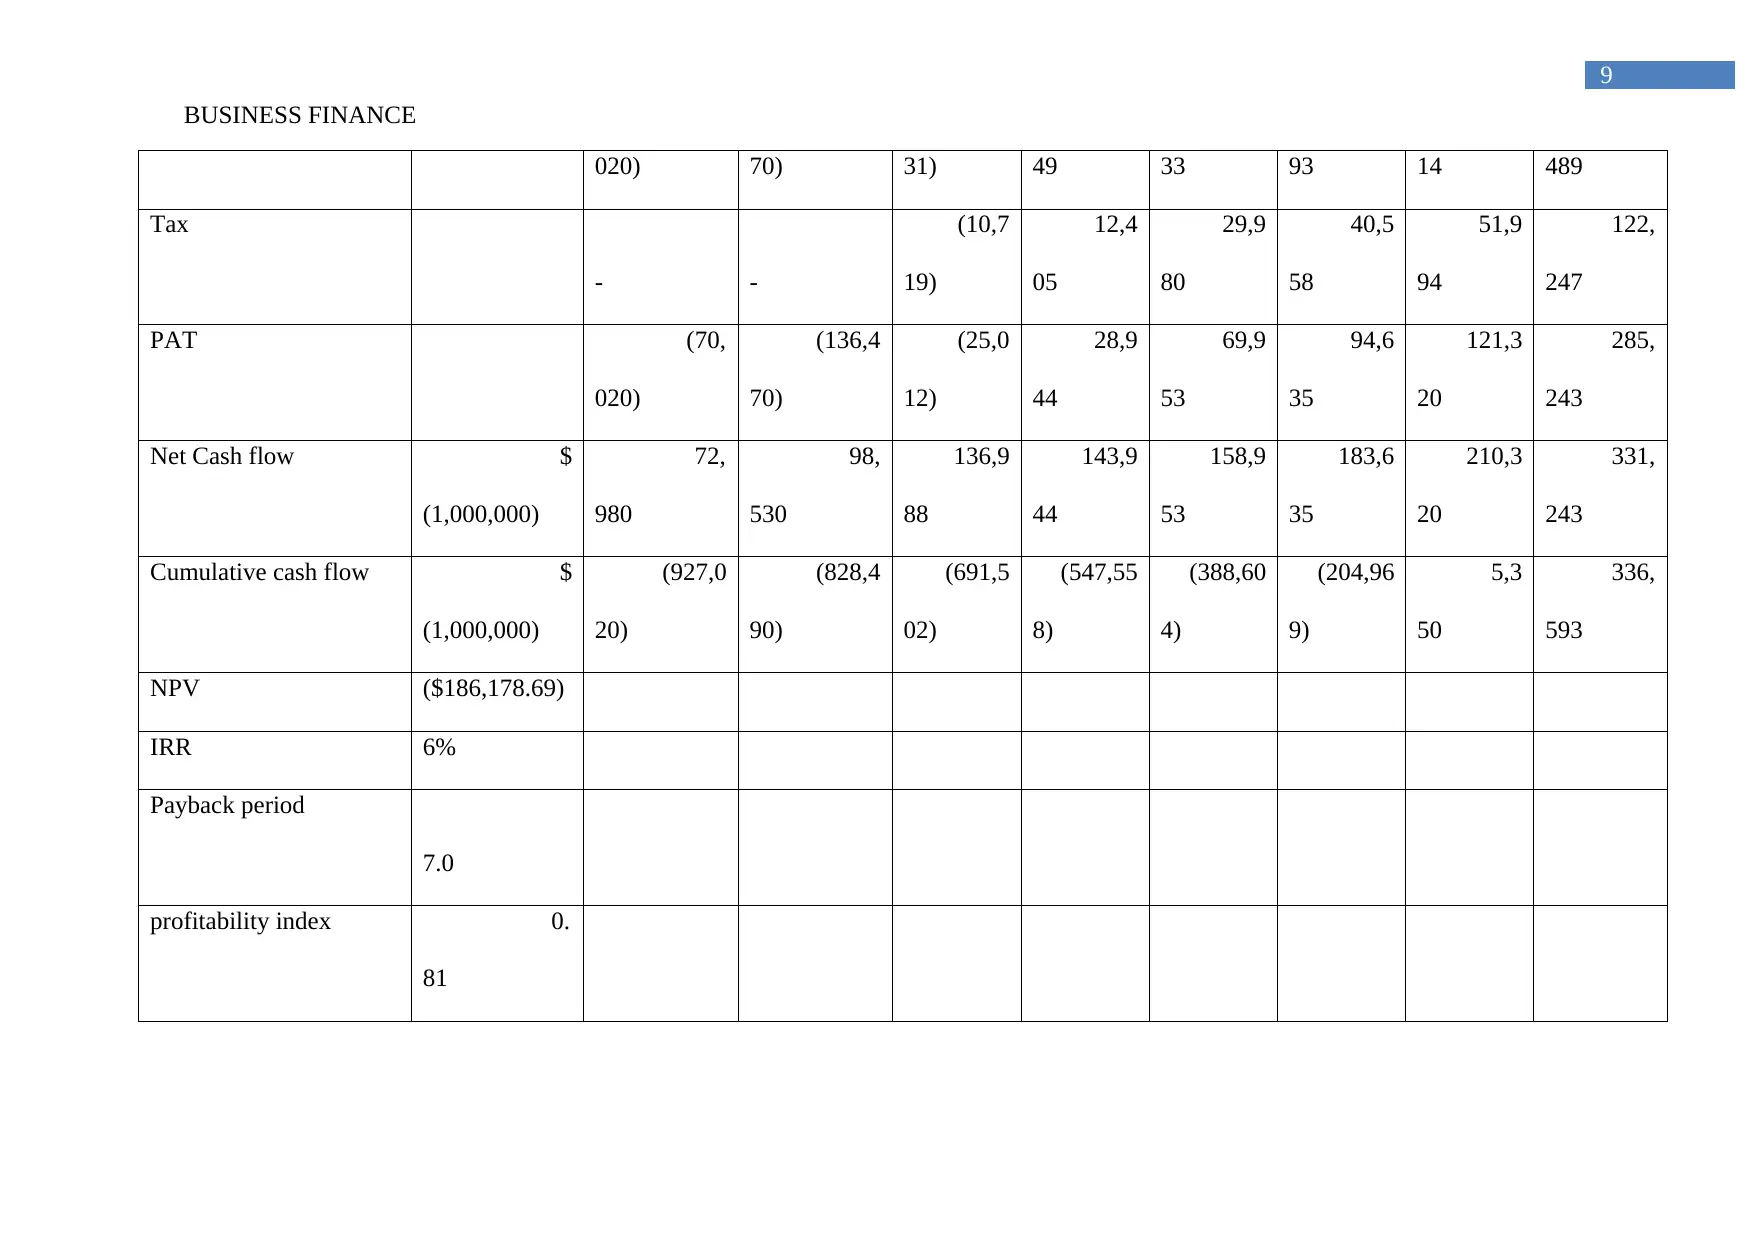
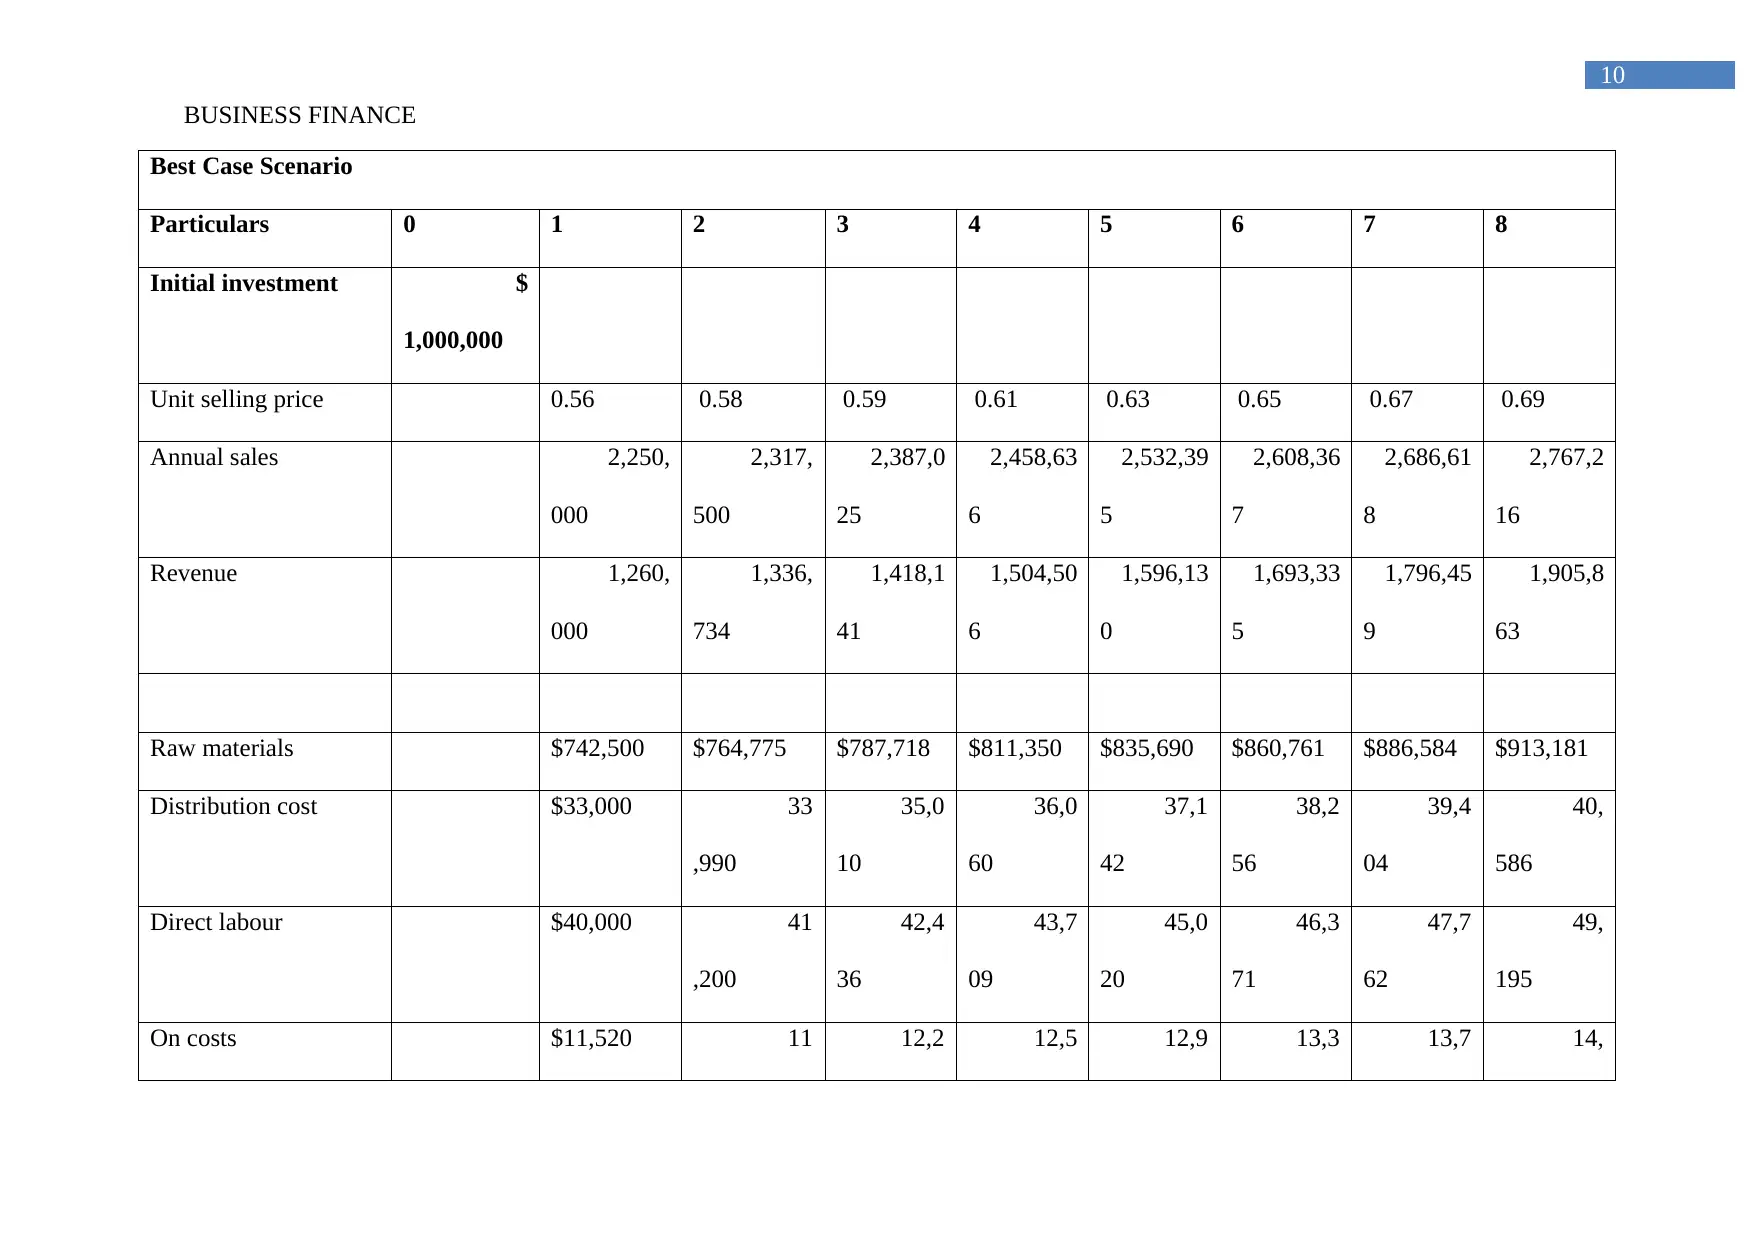
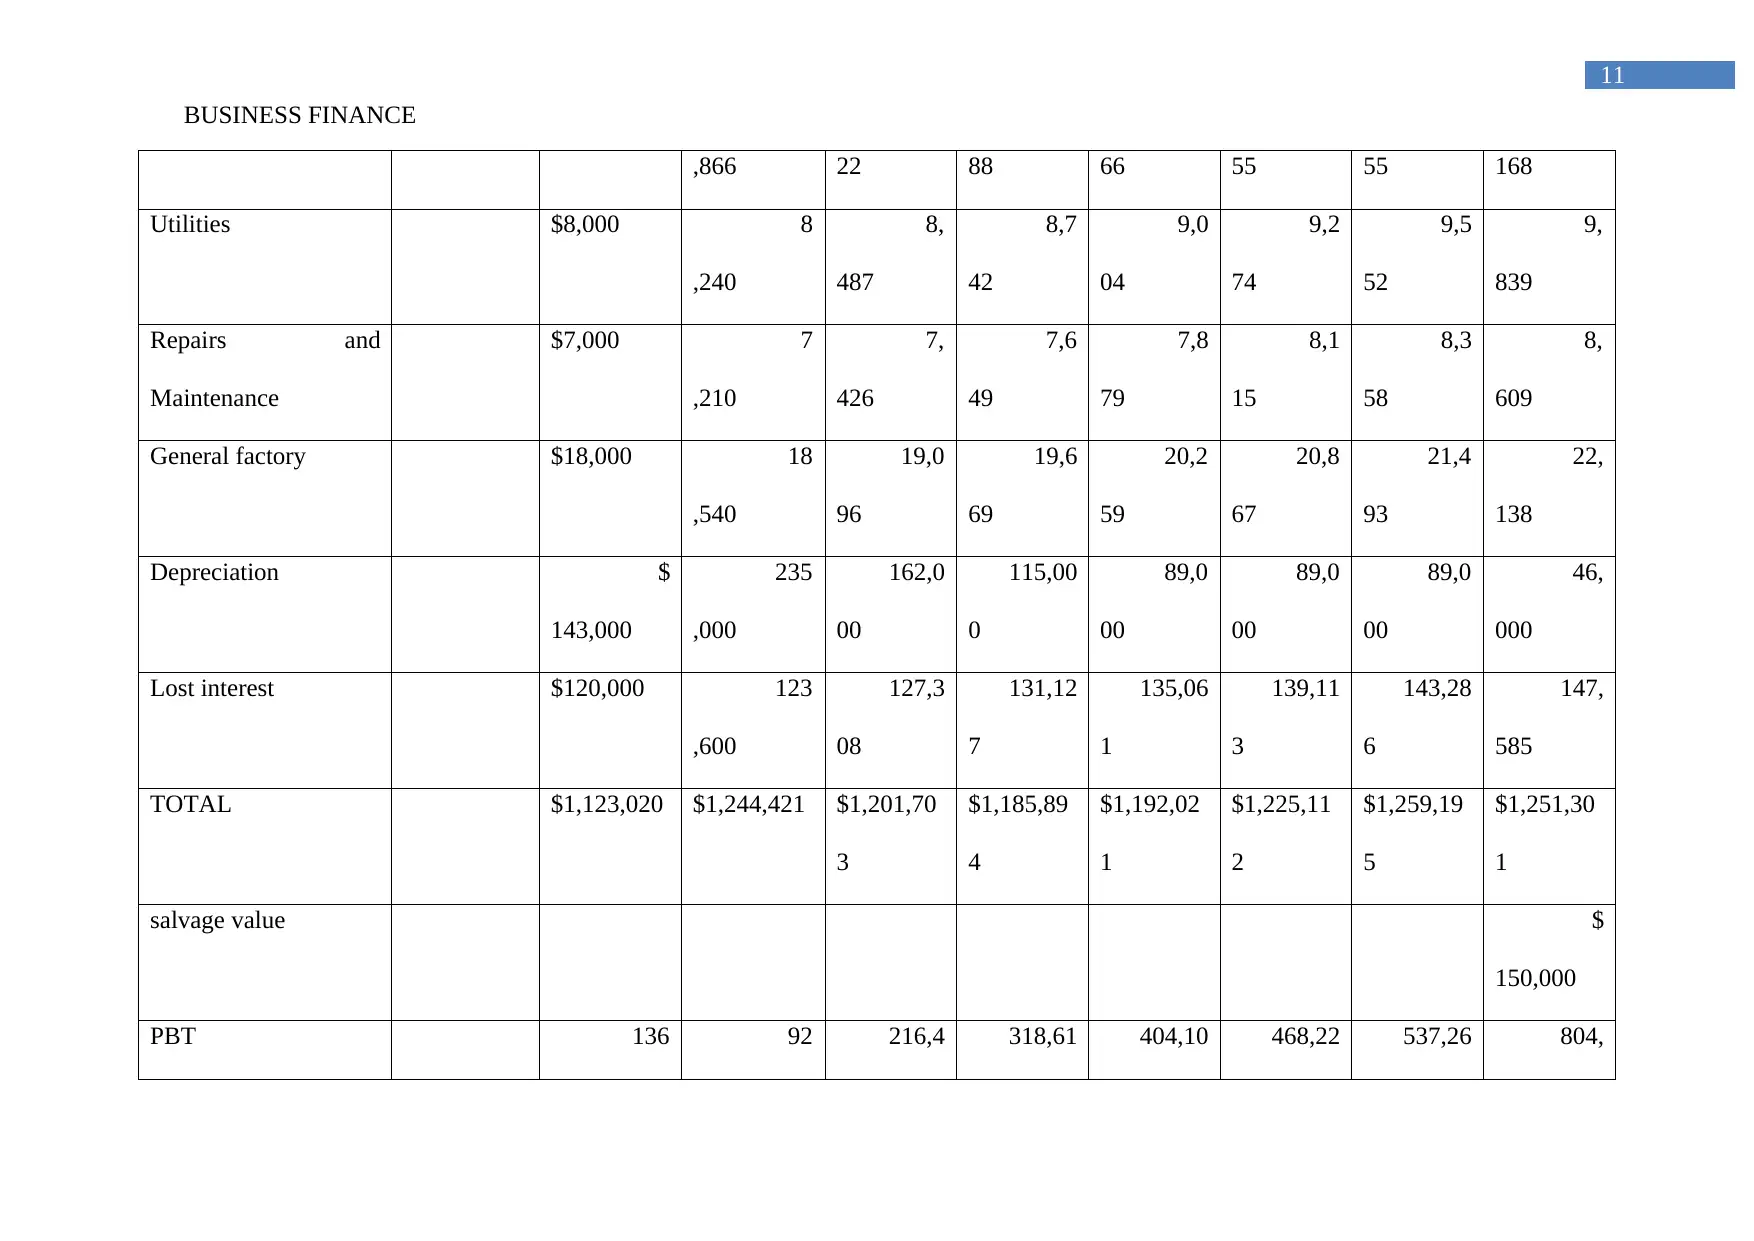
This report presents a comprehensive financial analysis of a new business project, evaluating its viability and potential returns. The analysis begins by identifying and omitting irrelevant expenses from an exhibit, followed by the calculation of incremental cash flows over an eight-year period. Key financial metrics such as Net Present Value (NPV), Internal Rate of Return (IRR), and Profitability Index (PI) are computed to assess the project's profitability. A sensitivity analysis is conducted to evaluate the project's performance under best-case and worst-case scenarios, alongside the derivation of expected sales, standard deviation, and coefficient of variance. The report also explores the impact of sales changes on project worthiness and discusses the rationale for using a high discount rate. Finally, it provides recommendations for the project, suggesting strategies to improve investment returns, and concludes that, despite potential risks, the project is viable and can generate positive returns, especially with increased sales as predicted by the sales team.
Document Page
Running head: BUSINESS FINANCE
Business Finance
Name of the Student:
Name of the University:
Authors Note:
tabler-icon-diamond-filled.svg

Paraphrase This Document

Need a fresh take? Get an instant paraphrase of this document with our AI Paraphraser
Document Page
1
BUSINESS FINANCE
Table of Contents
1. Evaluating the items that need to be omitted from the Exhibit 3:..........................................2
2. Providing the calculation for incremental cash flow for the new project..............................3
3. Calculating NPV, internal rate of return (IRR) and profitability index (PI) of the new
project:........................................................................................................................................6
4. Providing adequate sensitivity analysis for best and worse case scenario:............................7
5. Providing data related to worst, most-likely and best-cases of sales quantity for deriving
expected sales, standard deviation and coefficient variance:...................................................13
6. Mentioning the change in sales for making the project worthwhile:...................................13
7. Stating the use of high discount rate for the project with an inflation rate of only 3%:......13
8. Depicting recommendation for the project, which could be used by the company to
improve its return from investment:.........................................................................................14
Reference and Bibliography:....................................................................................................16
Document Page
2
BUSINESS FINANCE
1. Evaluating the items that need to be omitted from the Exhibit 3:
The case study evaluation directly indicates that Relevant accounts that needs to be
omitted from exhibit 3. Exhibit 3 directly indicates all the relevant expenses that need to be
incurred by the organisation to determine whether the project is viable option for generating
relevant in comment future. Moreover, the accounts that are been omitted is indirect labour
expense and space account expense, which is relatively an extra burden on the expenses. The
indirect labour directly accounts for the supervisor salary, which is mentioned in the case
study will be conducted by the existing supervisor. Therefore, no increment in expenses is
expected from the indirect labour charges for the current project (Kirschenmann & Norden,
2012). The other expenses are related to space which will be taken by the new project and
needs to be deducted from the income. However, the organisation directly aims in using free
space in the current premises, which will directly neglect the expenses towards space.
Document Page
3
BUSINESS FINANCE
2. Providing the calculation for incremental cash flow for the new project
Particulars 0 1 2 3 4 5 6 7 8
Initial investment $ 1,000,000
Unit selling price 0.56 0.58 0.59 0.61 0.63 0.65 0.67 0.69
Annual sales 1,650,0
00
1,699,5
00
1,750,4
85
1,803,0
00
1,857,0
90
1,912,8
02
1,970,18
6
2,029,2
92
Revenue 924,
000
980,
272
1,039,9
70
1,103,3
04
1,170,4
96
1,241,7
79
1,317,40
3
1,397,6
33
Raw materials $544,500 $560,835 $577,660 $594,990 $612,840 $631,225 $650,161 $669,666
Distribution cost $33,000 33,
990
35,0
10
36,0
60
37,1
42
38,2
56
39,40
4
40,5
86
Direct labour $40,000 41,
200
42,4
36
43,7
09
45,0
20
46,3
71
47,76
2
49,1
95
On costs $11,520 11, 12,2 12,5 12,9 13,3 13,75 14,1
tabler-icon-diamond-filled.svg

Paraphrase This Document

Need a fresh take? Get an instant paraphrase of this document with our AI Paraphraser
Document Page
4
BUSINESS FINANCE
866 22 88 66 55 5 68
Utilities $8,000 8,
240
8,
487
8,7
42
9,0
04
9,2
74
9,55
2
9,8
39
Repairs and Maintenance $7,000 7,
210
7,
426
7,6
49
7,8
79
8,1
15
8,35
8
8,6
09
General factory $18,000 18,
540
19,0
96
19,6
69
20,2
59
20,8
67
21,49
3
22,1
38
Depreciation $
143,000
235,
000
162,0
00
115,0
00
89,0
00
89,0
00
89,00
0
46,0
00
Lost interest $120,000 123,
600
127,3
08
131,1
27
135,0
61
139,1
13
143,28
6
147,5
85
TOTAL $925,020 $1,040,481 $991,645 $969,534 $969,170 $995,576 $1,022,773 $1,007,786
salvage value $ 150,000
PBT (1,0
20)
(60,2
09)
48,3
25
133,7
70
201,3
25
246,2
03
294,63
0
539,8
47
Tax 14,4 40,1 60,3 73,8 88,38 161,9
Document Page
5
BUSINESS FINANCE
- - 98 31 98 61 9 54
PAT (1,0
20)
(60,2
09)
33,8
28
93,6
39
140,9
28
172,3
42
206,24
1
377,8
93
Net Cash flow $
(1,000,000)
141,
980
174,
791
195,8
28
208,6
39
229,9
28
261,3
42
295,24
1
423,8
93
Document Page
6
BUSINESS FINANCE
3. Calculating NPV, internal rate of return (IRR) and profitability index (PI) of the new project:
Particulars Year 0 Year 1 Year 2 Year 3 Year 4 Year 5 Year 6 Year 7 Year 8
Net Cash flow $
(1,000,000)
141,
980
174,
791
195,8
28
208,6
39
229,9
28
261,3
42
295,2
41
423,
893
Cumulative cash flow $
(1,000,000)
(858,0
20)
(683,2
29)
(487,4
01)
(278,7
62)
(48,8
35)
212,5
07
507,7
49
931,
641
NPV $202,701.90
IRR 14%
Payback period 5.2
Profitability index 1.20
Evaluation of the project period it could be identified that the payback Period of the project is not viable according to the company's
policy, which will force them to reject the project. The company requires a Fever period of minimum of 5 years, while the project provides
Payback period of 5.2 years.
tabler-icon-diamond-filled.svg

Paraphrase This Document

Need a fresh take? Get an instant paraphrase of this document with our AI Paraphraser
Document Page
7
BUSINESS FINANCE
4. Providing adequate sensitivity analysis for best and worse case scenario:
Worst Case Scenario
Particulars 0 1 2 3 4 5 6 7 8
Initial investment $ 1,000,000
Unit selling price 0.56 0.58 0.59 0.61 0.63 0.65 0.67 0.69
Annual sales 1,350,0
00
1,390,5
00
1,432,2
15
1,475,1
81
1,519,4
37
1,565,0
20
1,611,9
71
1,660,3
30
Revenue 756,
000
802,
040
850,8
85
902,7
04
957,6
78
1,016,0
01
1,077,8
75
1,143,5
18
Raw materials $445,500 $458,865 $472,631 $486,810 $501,414 $516,457 $531,950 $547,909
Distribution cost $33,000 33,
990
35,0
10
36,0
60
37,1
42
38,2
56
39,4
04
40,
586
Direct labour $40,000 41,
200
42,4
36
43,7
09
45,0
20
46,3
71
47,7
62
49,
195
Document Page
8
BUSINESS FINANCE
On costs $11,520 11,
866
12,2
22
12,5
88
12,9
66
13,3
55
13,7
55
14,
168
Utilities $8,000 8,
240
8,
487
8,7
42
9,0
04
9,2
74
9,5
52
9,
839
Repairs and
Maintenance
$7,000 7,
210
7,
426
7,6
49
7,8
79
8,1
15
8,3
58
8,
609
General factory $18,000 18,
540
19,0
96
19,6
69
20,2
59
20,8
67
21,4
93
22,
138
Depreciation $
143,000
235,
000
162,0
00
115,0
00
89,0
00
89,0
00
89,0
00
46,
000
Lost interest $120,000 123,
600
127,3
08
131,1
27
135,0
61
139,1
13
143,2
86
147,
585
TOTAL $826,020 $938,511 $886,616 $861,354 $857,745 $880,807 $904,562 $886,028
salvage value $
150,000
PBT (70, (136,4 (35,7 41,3 99,9 135,1 173,3 407,
Document Page
9
BUSINESS FINANCE
020) 70) 31) 49 33 93 14 489
Tax
- -
(10,7
19)
12,4
05
29,9
80
40,5
58
51,9
94
122,
247
PAT (70,
020)
(136,4
70)
(25,0
12)
28,9
44
69,9
53
94,6
35
121,3
20
285,
243
Net Cash flow $
(1,000,000)
72,
980
98,
530
136,9
88
143,9
44
158,9
53
183,6
35
210,3
20
331,
243
Cumulative cash flow $
(1,000,000)
(927,0
20)
(828,4
90)
(691,5
02)
(547,55
8)
(388,60
4)
(204,96
9)
5,3
50
336,
593
NPV ($186,178.69)
IRR 6%
Payback period
7.0
profitability index 0.
81
tabler-icon-diamond-filled.svg

Paraphrase This Document

Need a fresh take? Get an instant paraphrase of this document with our AI Paraphraser
Document Page
10
BUSINESS FINANCE
Best Case Scenario
Particulars 0 1 2 3 4 5 6 7 8
Initial investment $
1,000,000
Unit selling price 0.56 0.58 0.59 0.61 0.63 0.65 0.67 0.69
Annual sales 2,250,
000
2,317,
500
2,387,0
25
2,458,63
6
2,532,39
5
2,608,36
7
2,686,61
8
2,767,2
16
Revenue 1,260,
000
1,336,
734
1,418,1
41
1,504,50
6
1,596,13
0
1,693,33
5
1,796,45
9
1,905,8
63
Raw materials $742,500 $764,775 $787,718 $811,350 $835,690 $860,761 $886,584 $913,181
Distribution cost $33,000 33
,990
35,0
10
36,0
60
37,1
42
38,2
56
39,4
04
40,
586
Direct labour $40,000 41
,200
42,4
36
43,7
09
45,0
20
46,3
71
47,7
62
49,
195
On costs $11,520 11 12,2 12,5 12,9 13,3 13,7 14,
Document Page
11
BUSINESS FINANCE
,866 22 88 66 55 55 168
Utilities $8,000 8
,240
8,
487
8,7
42
9,0
04
9,2
74
9,5
52
9,
839
Repairs and
Maintenance
$7,000 7
,210
7,
426
7,6
49
7,8
79
8,1
15
8,3
58
8,
609
General factory $18,000 18
,540
19,0
96
19,6
69
20,2
59
20,8
67
21,4
93
22,
138
Depreciation $
143,000
235
,000
162,0
00
115,00
0
89,0
00
89,0
00
89,0
00
46,
000
Lost interest $120,000 123
,600
127,3
08
131,12
7
135,06
1
139,11
3
143,28
6
147,
585
TOTAL $1,123,020 $1,244,421 $1,201,70
3
$1,185,89
4
$1,192,02
1
$1,225,11
2
$1,259,19
5
$1,251,30
1
salvage value $
150,000
PBT 136 92 216,4 318,61 404,10 468,22 537,26 804,
chevron_up_icon
1 out of 15
circle_padding
hide_on_mobile
zoom_out_icon
[object Object]