MOS 3310B Finance Project Report: Costco Wholesale Corporation
VerifiedAdded on 2023/06/14
|20
|4057
|196
Report
AI Summary
This report provides a comprehensive financial analysis of Costco Wholesale Corporation, utilizing data from their 2017 annual report. It begins with an analysis of cash flows, examining operating, investing, and financing activities across 2015-2017, noting a decline in overall cash position due to investing and financing activities. The report then conducts a ratio analysis, evaluating liquidity, asset management, debt utilization, and profitability positions, suggesting areas for improvement in short-term debt payment capacity and inventory turnover. Finally, the report includes a sales forecast and calculates additional funds needed (AFN) for a projected sales increase, determining that $1230.77 million would need to be raised through external sources. The analysis concludes that Costco's financial position is generally strong, making it a potentially good investment opportunity.
Running Head: Finance
1
Project Report: Finance
1
Project Report: Finance
Paraphrase This Document
Need a fresh take? Get an instant paraphrase of this document with our AI Paraphraser
Finance
2
Contents
Introduction.......................................................................................................................3
Analysis of cash flow........................................................................................................3
Ratio analysis....................................................................................................................5
Financial forecasting.........................................................................................................6
Conclusion......................................................................................................................10
References.......................................................................................................................11
Appendix.........................................................................................................................12
Finance
3
Introduction:
The report briefs about the financial position and the prediction about the financial
position of Costco Wholesale Corporation. Financial analysis and prediction about financial
position of an organization is crucial methods which makes it easier for the management of
the company to identify the current performance of the company as well as the future changes
in the company. In the report, cash flow of the company has been analyzed firstly to identify
the performance of the company. Further, the ratio analysis study has been done to evaluate
the different levels of the company and lastly, financial forecasting has been done on the
future performance and the position of Costco Wholesale Corporation.
Analysis of cash flow:
Cash flow analysis is an examination which is done on the cash outflows and cash
inflows of a company in a particular period. The cash flow analysis starts with the initial cash
balance and generates the ending cash flow of the company. The evaluation on the statement
of cash flows of Costco Wholesale Corporation has been done.
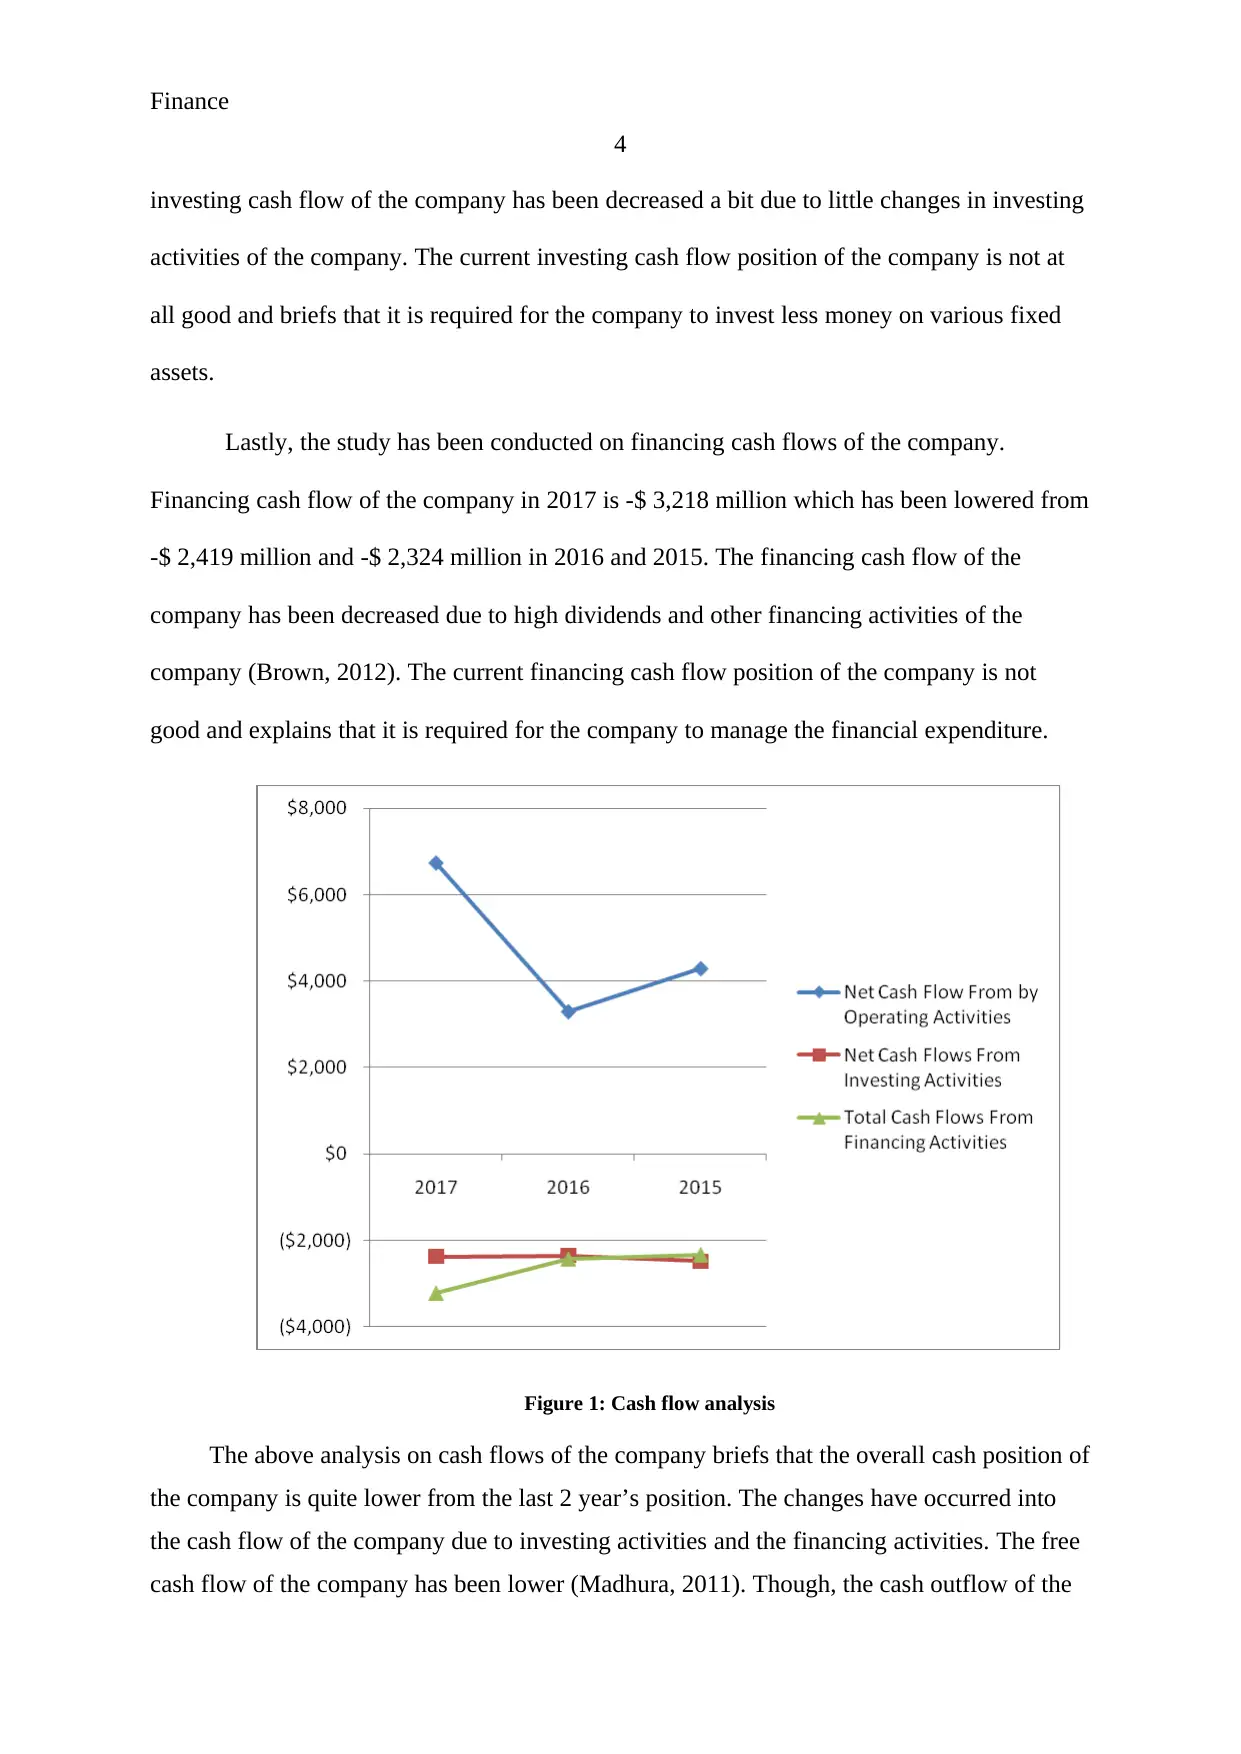
The cash flow statement of the company expresses that the operating cash flow of the
company in 2017 is $ 6,726 million which has been enhanced from $ 3,292 million and $
4,285 million in 2016 and 2015. The operating cash flow of the company has been enhanced
due to changes in operating assets and liabilities (Home, 2018). The current operating cash
flow position of the company is quite better and briefs about the better cash position of the
company.
In addition, investing cash flows of Costco Wholesale Corporation has been done.
The investing cash flow of the company in 2017 is $ -2300 million which has been enhanced
from -$ 2,649 million and -$ 2,480 million in 2016 and 2015 (Annual Report, 2017). The
3
Introduction:
The report briefs about the financial position and the prediction about the financial
position of Costco Wholesale Corporation. Financial analysis and prediction about financial
position of an organization is crucial methods which makes it easier for the management of
the company to identify the current performance of the company as well as the future changes
in the company. In the report, cash flow of the company has been analyzed firstly to identify
the performance of the company. Further, the ratio analysis study has been done to evaluate
the different levels of the company and lastly, financial forecasting has been done on the
future performance and the position of Costco Wholesale Corporation.
Analysis of cash flow:
Cash flow analysis is an examination which is done on the cash outflows and cash
inflows of a company in a particular period. The cash flow analysis starts with the initial cash
balance and generates the ending cash flow of the company. The evaluation on the statement
of cash flows of Costco Wholesale Corporation has been done.
The cash flow statement of the company expresses that the operating cash flow of the
company in 2017 is $ 6,726 million which has been enhanced from $ 3,292 million and $
4,285 million in 2016 and 2015. The operating cash flow of the company has been enhanced
due to changes in operating assets and liabilities (Home, 2018). The current operating cash
flow position of the company is quite better and briefs about the better cash position of the
company.
In addition, investing cash flows of Costco Wholesale Corporation has been done.
The investing cash flow of the company in 2017 is $ -2300 million which has been enhanced
from -$ 2,649 million and -$ 2,480 million in 2016 and 2015 (Annual Report, 2017). The
⊘ This is a preview!⊘
Do you want full access?
Subscribe today to unlock all pages.
Trusted by 1+ million students worldwide
Finance
4
investing cash flow of the company has been decreased a bit due to little changes in investing
activities of the company. The current investing cash flow position of the company is not at
all good and briefs that it is required for the company to invest less money on various fixed
assets.
Lastly, the study has been conducted on financing cash flows of the company.
Financing cash flow of the company in 2017 is -$ 3,218 million which has been lowered from
-$ 2,419 million and -$ 2,324 million in 2016 and 2015. The financing cash flow of the
company has been decreased due to high dividends and other financing activities of the
company (Brown, 2012). The current financing cash flow position of the company is not
good and explains that it is required for the company to manage the financial expenditure.
Figure 1: Cash flow analysis
The above analysis on cash flows of the company briefs that the overall cash position of
the company is quite lower from the last 2 year’s position. The changes have occurred into
the cash flow of the company due to investing activities and the financing activities. The free
cash flow of the company has been lower (Madhura, 2011). Though, the cash outflow of the
Paraphrase This Document
Need a fresh take? Get an instant paraphrase of this document with our AI Paraphraser
Finance
5
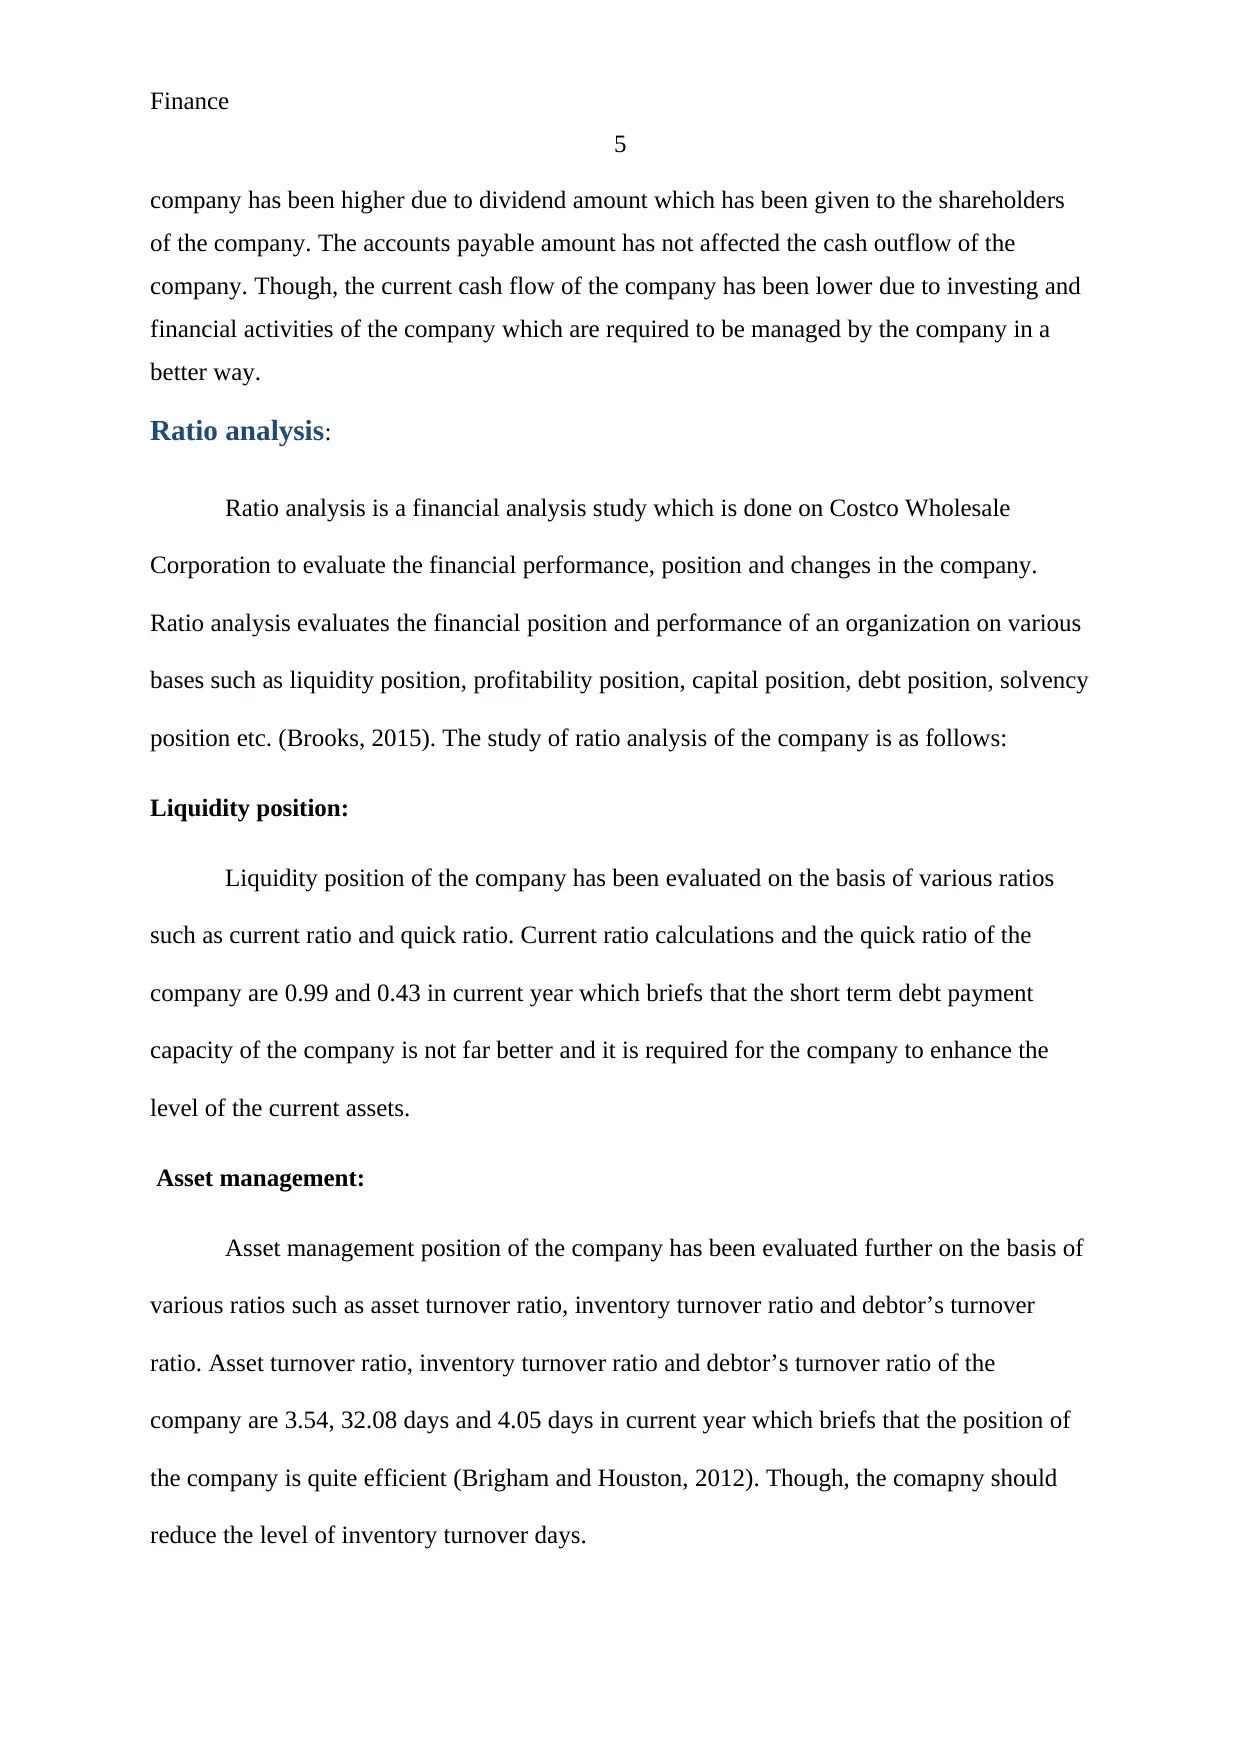
company has been higher due to dividend amount which has been given to the shareholders
of the company. The accounts payable amount has not affected the cash outflow of the
company. Though, the current cash flow of the company has been lower due to investing and
financial activities of the company which are required to be managed by the company in a
better way.
Ratio analysis:
Ratio analysis is a financial analysis study which is done on Costco Wholesale
Corporation to evaluate the financial performance, position and changes in the company.
Ratio analysis evaluates the financial position and performance of an organization on various
bases such as liquidity position, profitability position, capital position, debt position, solvency
position etc. (Brooks, 2015). The study of ratio analysis of the company is as follows:
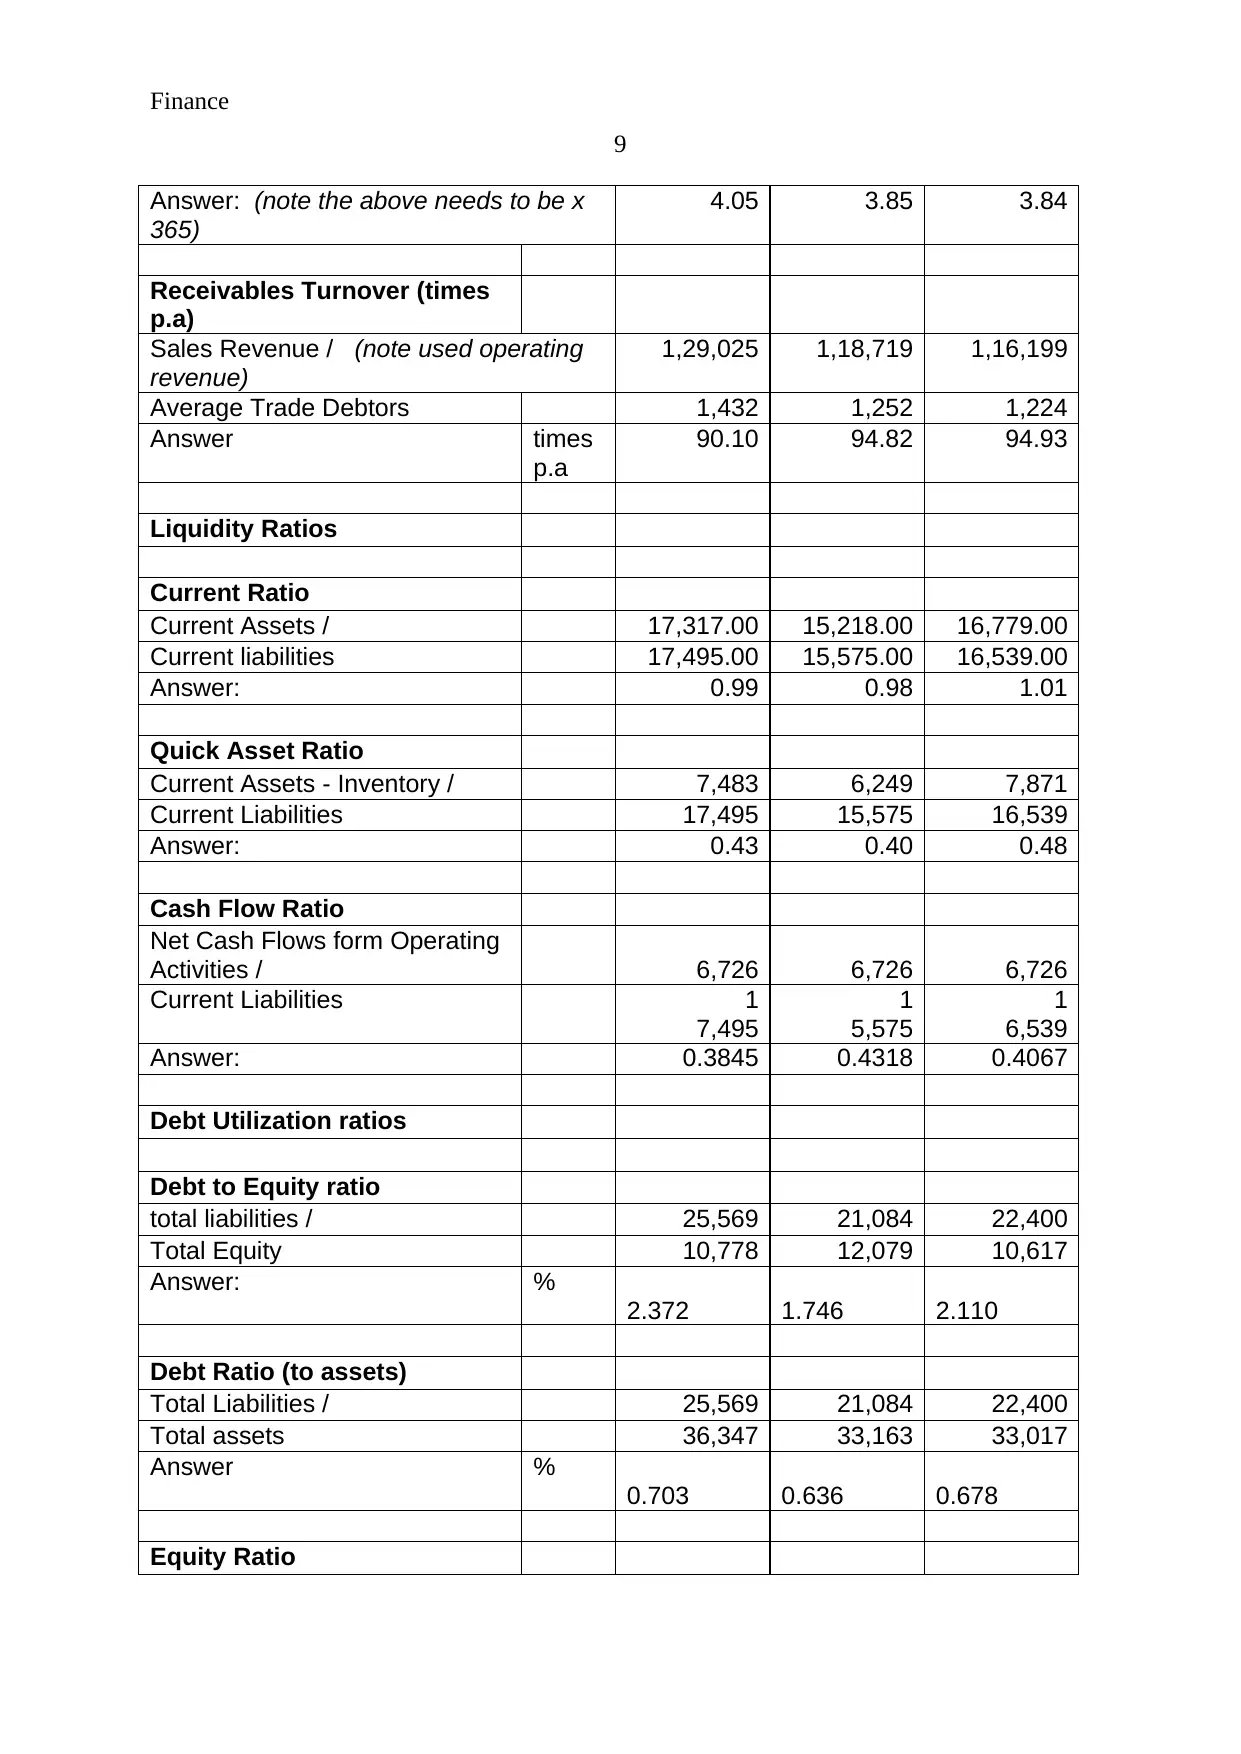
Liquidity position:
Liquidity position of the company has been evaluated on the basis of various ratios
such as current ratio and quick ratio. Current ratio calculations and the quick ratio of the
company are 0.99 and 0.43 in current year which briefs that the short term debt payment
capacity of the company is not far better and it is required for the company to enhance the
level of the current assets.
Asset management:
Asset management position of the company has been evaluated further on the basis of
various ratios such as asset turnover ratio, inventory turnover ratio and debtor’s turnover
ratio. Asset turnover ratio, inventory turnover ratio and debtor’s turnover ratio of the
company are 3.54, 32.08 days and 4.05 days in current year which briefs that the position of
the company is quite efficient (Brigham and Houston, 2012). Though, the comapny should
reduce the level of inventory turnover days.
5
company has been higher due to dividend amount which has been given to the shareholders
of the company. The accounts payable amount has not affected the cash outflow of the
company. Though, the current cash flow of the company has been lower due to investing and
financial activities of the company which are required to be managed by the company in a
better way.
Ratio analysis:
Ratio analysis is a financial analysis study which is done on Costco Wholesale
Corporation to evaluate the financial performance, position and changes in the company.
Ratio analysis evaluates the financial position and performance of an organization on various
bases such as liquidity position, profitability position, capital position, debt position, solvency
position etc. (Brooks, 2015). The study of ratio analysis of the company is as follows:
Liquidity position:
Liquidity position of the company has been evaluated on the basis of various ratios
such as current ratio and quick ratio. Current ratio calculations and the quick ratio of the
company are 0.99 and 0.43 in current year which briefs that the short term debt payment
capacity of the company is not far better and it is required for the company to enhance the
level of the current assets.
Asset management:
Asset management position of the company has been evaluated further on the basis of
various ratios such as asset turnover ratio, inventory turnover ratio and debtor’s turnover
ratio. Asset turnover ratio, inventory turnover ratio and debtor’s turnover ratio of the
company are 3.54, 32.08 days and 4.05 days in current year which briefs that the position of
the company is quite efficient (Brigham and Houston, 2012). Though, the comapny should
reduce the level of inventory turnover days.
Finance
6
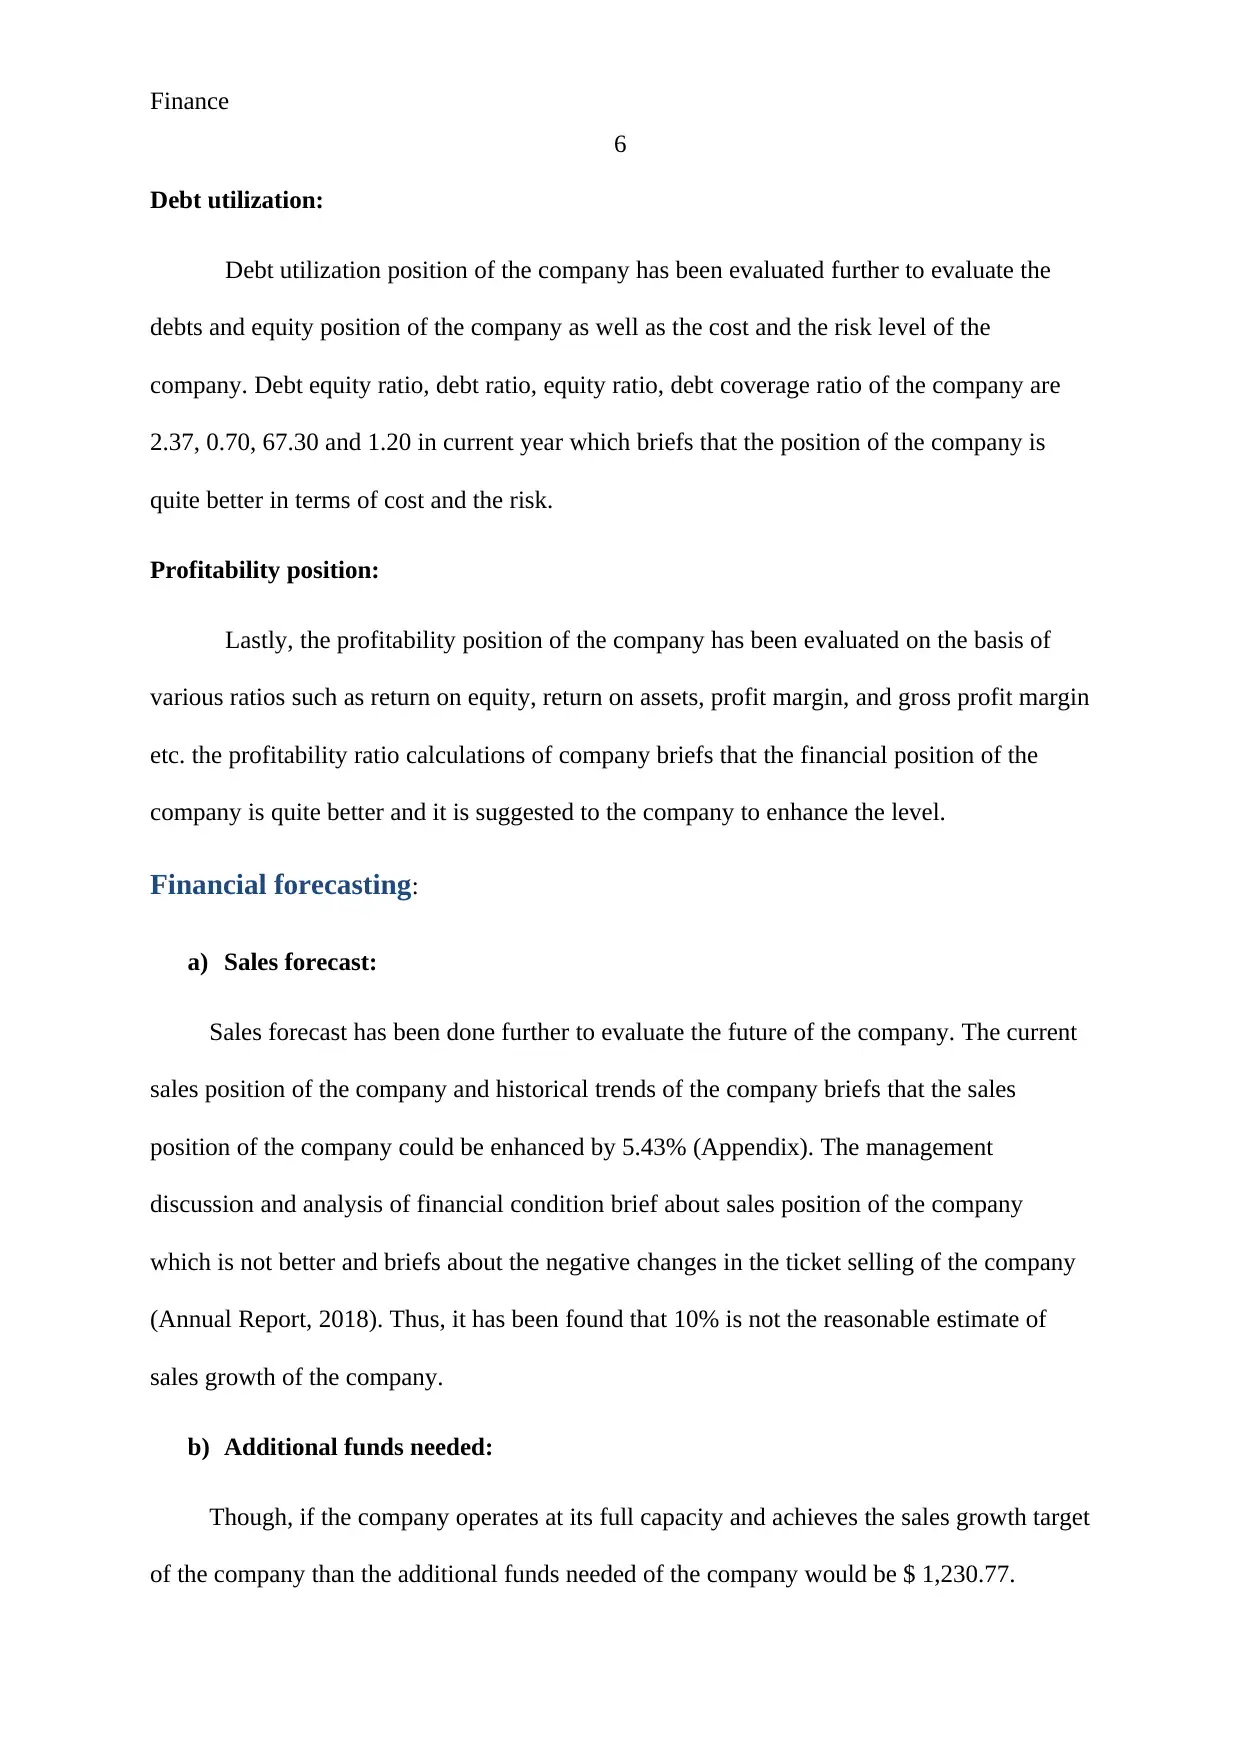
Debt utilization:
Debt utilization position of the company has been evaluated further to evaluate the
debts and equity position of the company as well as the cost and the risk level of the
company. Debt equity ratio, debt ratio, equity ratio, debt coverage ratio of the company are
2.37, 0.70, 67.30 and 1.20 in current year which briefs that the position of the company is
quite better in terms of cost and the risk.
Profitability position:
Lastly, the profitability position of the company has been evaluated on the basis of
various ratios such as return on equity, return on assets, profit margin, and gross profit margin
etc. the profitability ratio calculations of company briefs that the financial position of the
company is quite better and it is suggested to the company to enhance the level.
Financial forecasting:
a) Sales forecast:
Sales forecast has been done further to evaluate the future of the company. The current
sales position of the company and historical trends of the company briefs that the sales
position of the company could be enhanced by 5.43% (Appendix). The management
discussion and analysis of financial condition brief about sales position of the company
which is not better and briefs about the negative changes in the ticket selling of the company
(Annual Report, 2018). Thus, it has been found that 10% is not the reasonable estimate of
sales growth of the company.
b) Additional funds needed:
Though, if the company operates at its full capacity and achieves the sales growth target
of the company than the additional funds needed of the company would be $ 1,230.77.
6
Debt utilization:
Debt utilization position of the company has been evaluated further to evaluate the
debts and equity position of the company as well as the cost and the risk level of the
company. Debt equity ratio, debt ratio, equity ratio, debt coverage ratio of the company are
2.37, 0.70, 67.30 and 1.20 in current year which briefs that the position of the company is
quite better in terms of cost and the risk.
Profitability position:
Lastly, the profitability position of the company has been evaluated on the basis of
various ratios such as return on equity, return on assets, profit margin, and gross profit margin
etc. the profitability ratio calculations of company briefs that the financial position of the
company is quite better and it is suggested to the company to enhance the level.
Financial forecasting:
a) Sales forecast:
Sales forecast has been done further to evaluate the future of the company. The current
sales position of the company and historical trends of the company briefs that the sales
position of the company could be enhanced by 5.43% (Appendix). The management
discussion and analysis of financial condition brief about sales position of the company
which is not better and briefs about the negative changes in the ticket selling of the company
(Annual Report, 2018). Thus, it has been found that 10% is not the reasonable estimate of
sales growth of the company.
b) Additional funds needed:
Though, if the company operates at its full capacity and achieves the sales growth target
of the company than the additional funds needed of the company would be $ 1,230.77.
⊘ This is a preview!⊘
Do you want full access?
Subscribe today to unlock all pages.
Trusted by 1+ million students worldwide
Finance
7
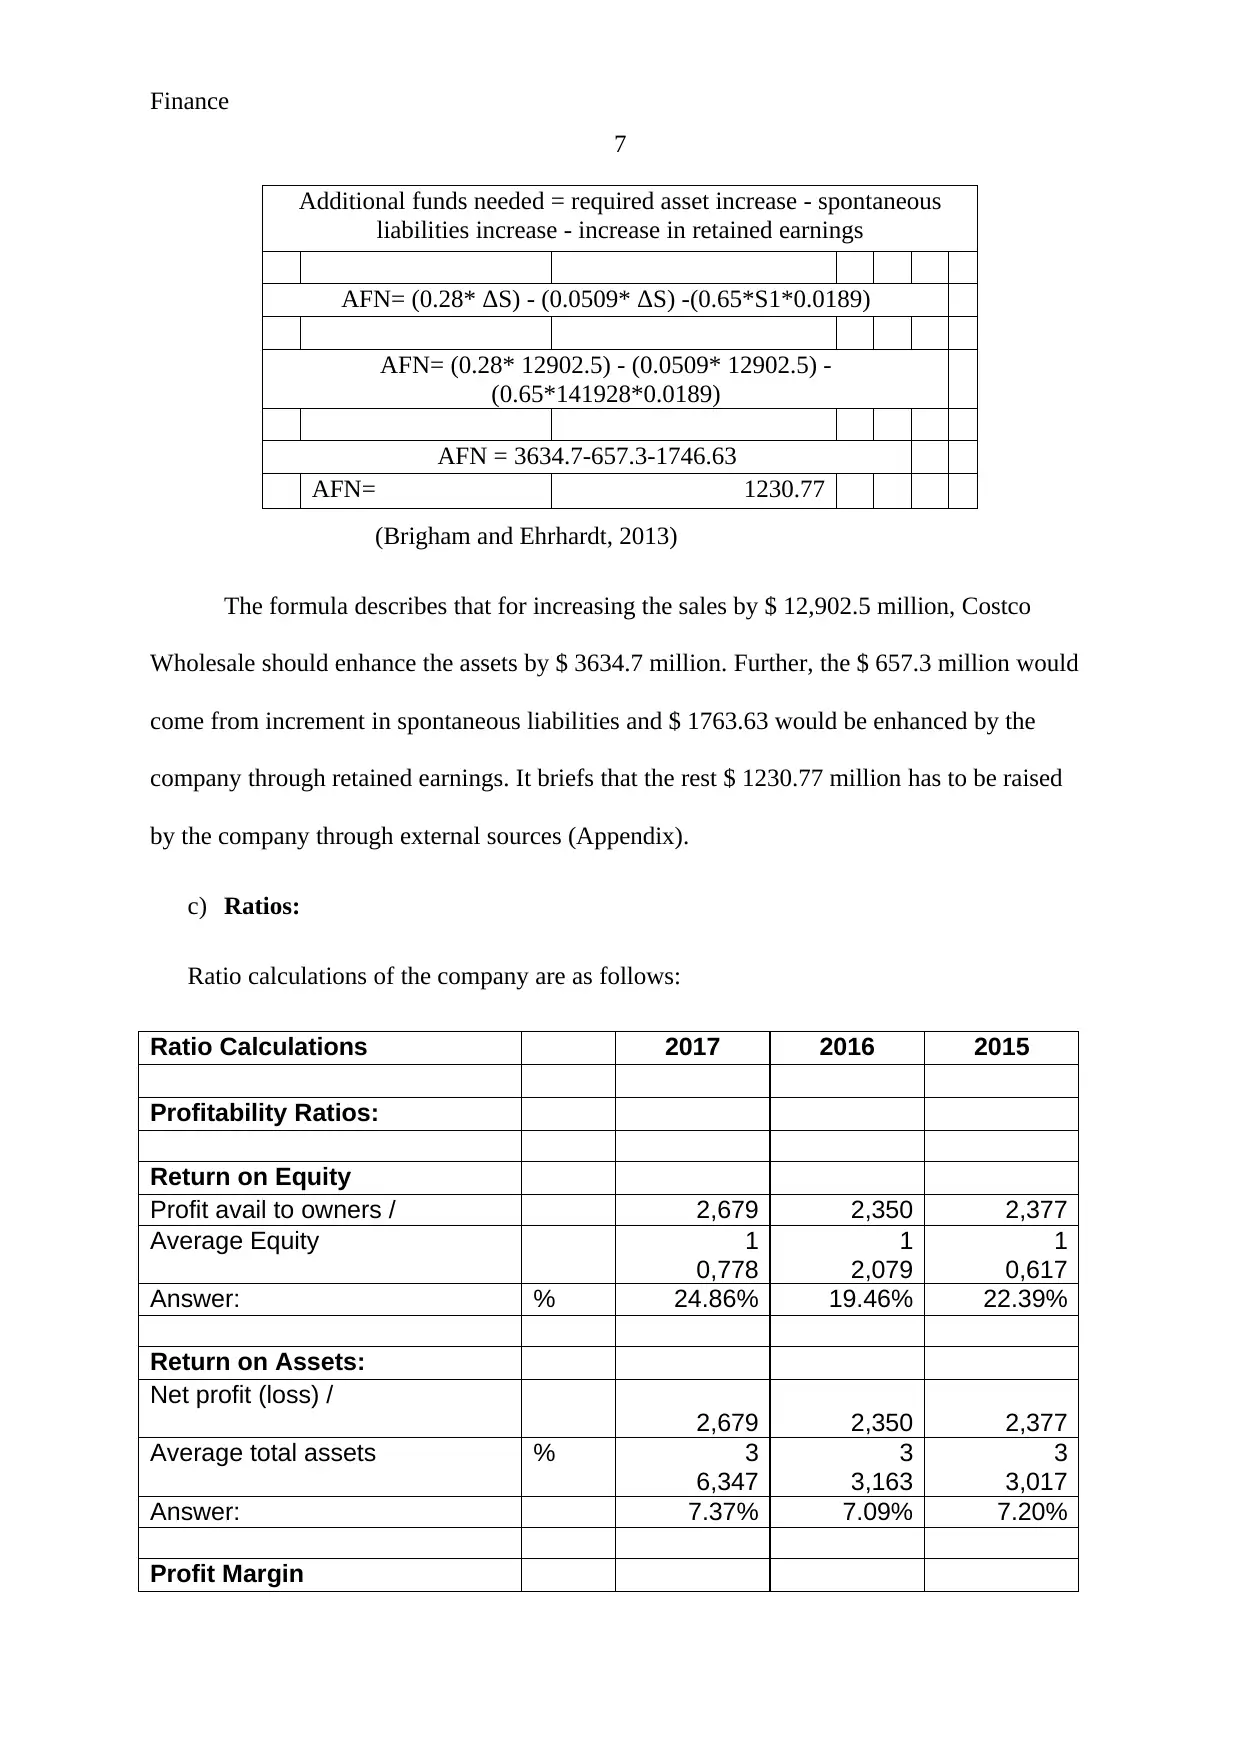
Additional funds needed = required asset increase - spontaneous
liabilities increase - increase in retained earnings
AFN= (0.28* ΔS) - (0.0509* ΔS) -(0.65*S1*0.0189)
AFN= (0.28* 12902.5) - (0.0509* 12902.5) -
(0.65*141928*0.0189)
AFN = 3634.7-657.3-1746.63
AFN= 1230.77
(Brigham and Ehrhardt, 2013)
The formula describes that for increasing the sales by $ 12,902.5 million, Costco
Wholesale should enhance the assets by $ 3634.7 million. Further, the $ 657.3 million would
come from increment in spontaneous liabilities and $ 1763.63 would be enhanced by the
company through retained earnings. It briefs that the rest $ 1230.77 million has to be raised
by the company through external sources (Appendix).
c) Ratios:
Ratio calculations of the company are as follows:
Ratio Calculations 2017 2016 2015
Profitability Ratios:
Return on Equity
Profit avail to owners / 2,679 2,350 2,377
Average Equity 1
0,778
1
2,079
1
0,617
Answer: % 24.86% 19.46% 22.39%
Return on Assets:
Net profit (loss) /
2,679 2,350 2,377
Average total assets % 3
6,347
3
3,163
3
3,017
Answer: 7.37% 7.09% 7.20%
Profit Margin
7
Additional funds needed = required asset increase - spontaneous
liabilities increase - increase in retained earnings
AFN= (0.28* ΔS) - (0.0509* ΔS) -(0.65*S1*0.0189)
AFN= (0.28* 12902.5) - (0.0509* 12902.5) -
(0.65*141928*0.0189)
AFN = 3634.7-657.3-1746.63
AFN= 1230.77
(Brigham and Ehrhardt, 2013)
The formula describes that for increasing the sales by $ 12,902.5 million, Costco
Wholesale should enhance the assets by $ 3634.7 million. Further, the $ 657.3 million would
come from increment in spontaneous liabilities and $ 1763.63 would be enhanced by the
company through retained earnings. It briefs that the rest $ 1230.77 million has to be raised
by the company through external sources (Appendix).
c) Ratios:
Ratio calculations of the company are as follows:
Ratio Calculations 2017 2016 2015
Profitability Ratios:
Return on Equity
Profit avail to owners / 2,679 2,350 2,377
Average Equity 1
0,778
1
2,079
1
0,617
Answer: % 24.86% 19.46% 22.39%
Return on Assets:
Net profit (loss) /
2,679 2,350 2,377
Average total assets % 3
6,347
3
3,163
3
3,017
Answer: 7.37% 7.09% 7.20%
Profit Margin
Paraphrase This Document
Need a fresh take? Get an instant paraphrase of this document with our AI Paraphraser
Finance
8
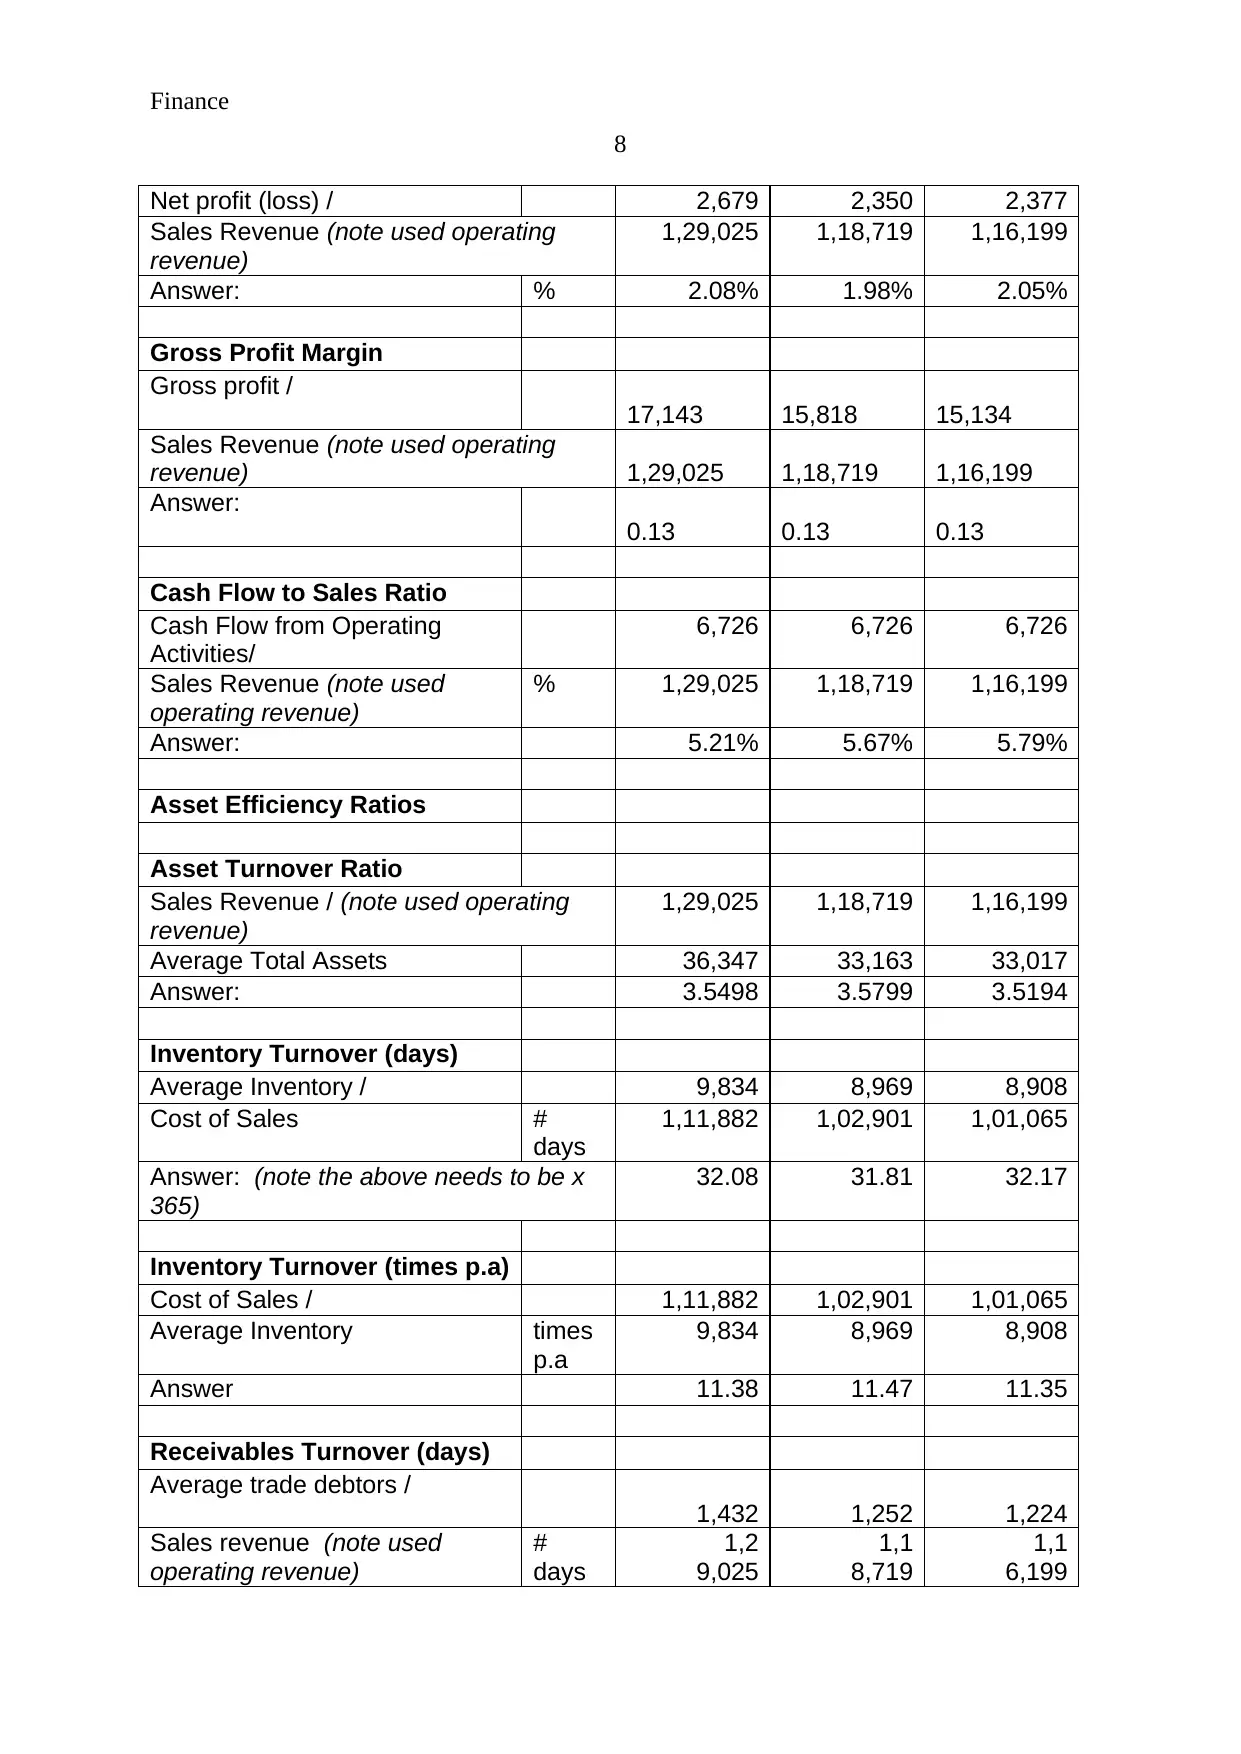
Net profit (loss) / 2,679 2,350 2,377
Sales Revenue (note used operating
revenue)
1,29,025 1,18,719 1,16,199
Answer: % 2.08% 1.98% 2.05%
Gross Profit Margin
Gross profit /
17,143 15,818 15,134
Sales Revenue (note used operating
revenue) 1,29,025 1,18,719 1,16,199
Answer:
0.13 0.13 0.13
Cash Flow to Sales Ratio
Cash Flow from Operating
Activities/
6,726 6,726 6,726
Sales Revenue (note used
operating revenue)
% 1,29,025 1,18,719 1,16,199
Answer: 5.21% 5.67% 5.79%
Asset Efficiency Ratios
Asset Turnover Ratio
Sales Revenue / (note used operating
revenue)
1,29,025 1,18,719 1,16,199
Average Total Assets 36,347 33,163 33,017
Answer: 3.5498 3.5799 3.5194
Inventory Turnover (days)
Average Inventory / 9,834 8,969 8,908
Cost of Sales #
days
1,11,882 1,02,901 1,01,065
Answer: (note the above needs to be x
365)
32.08 31.81 32.17
Inventory Turnover (times p.a)
Cost of Sales / 1,11,882 1,02,901 1,01,065
Average Inventory times
p.a
9,834 8,969 8,908
Answer 11.38 11.47 11.35
Receivables Turnover (days)
Average trade debtors /
1,432 1,252 1,224
Sales revenue (note used
operating revenue)
#
days
1,2
9,025
1,1
8,719
1,1
6,199
8
Net profit (loss) / 2,679 2,350 2,377
Sales Revenue (note used operating
revenue)
1,29,025 1,18,719 1,16,199
Answer: % 2.08% 1.98% 2.05%
Gross Profit Margin
Gross profit /
17,143 15,818 15,134
Sales Revenue (note used operating
revenue) 1,29,025 1,18,719 1,16,199
Answer:
0.13 0.13 0.13
Cash Flow to Sales Ratio
Cash Flow from Operating
Activities/
6,726 6,726 6,726
Sales Revenue (note used
operating revenue)
% 1,29,025 1,18,719 1,16,199
Answer: 5.21% 5.67% 5.79%
Asset Efficiency Ratios
Asset Turnover Ratio
Sales Revenue / (note used operating
revenue)
1,29,025 1,18,719 1,16,199
Average Total Assets 36,347 33,163 33,017
Answer: 3.5498 3.5799 3.5194
Inventory Turnover (days)
Average Inventory / 9,834 8,969 8,908
Cost of Sales #
days
1,11,882 1,02,901 1,01,065
Answer: (note the above needs to be x
365)
32.08 31.81 32.17
Inventory Turnover (times p.a)
Cost of Sales / 1,11,882 1,02,901 1,01,065
Average Inventory times
p.a
9,834 8,969 8,908
Answer 11.38 11.47 11.35
Receivables Turnover (days)
Average trade debtors /
1,432 1,252 1,224
Sales revenue (note used
operating revenue)
#
days
1,2
9,025
1,1
8,719
1,1
6,199
Finance
9
Answer: (note the above needs to be x
365)
4.05 3.85 3.84
Receivables Turnover (times
p.a)
Sales Revenue / (note used operating
revenue)
1,29,025 1,18,719 1,16,199
Average Trade Debtors 1,432 1,252 1,224
Answer times
p.a
90.10 94.82 94.93
Liquidity Ratios
Current Ratio
Current Assets / 17,317.00 15,218.00 16,779.00
Current liabilities 17,495.00 15,575.00 16,539.00
Answer: 0.99 0.98 1.01
Quick Asset Ratio
Current Assets - Inventory / 7,483 6,249 7,871
Current Liabilities 17,495 15,575 16,539
Answer: 0.43 0.40 0.48
Cash Flow Ratio
Net Cash Flows form Operating
Activities / 6,726 6,726 6,726
Current Liabilities 1
7,495
1
5,575
1
6,539
Answer: 0.3845 0.4318 0.4067
Debt Utilization ratios
Debt to Equity ratio
total liabilities / 25,569 21,084 22,400
Total Equity 10,778 12,079 10,617
Answer: %
2.372 1.746 2.110
Debt Ratio (to assets)
Total Liabilities / 25,569 21,084 22,400
Total assets 36,347 33,163 33,017
Answer %
0.703 0.636 0.678
Equity Ratio
⊘ This is a preview!⊘
Do you want full access?
Subscribe today to unlock all pages.
Trusted by 1+ million students worldwide
Finance
10
Total Equity / 10,778 12,079 10,617
Total Assets 36,347 33,163 33,017
Answer: %
0.297 0.364 0.322
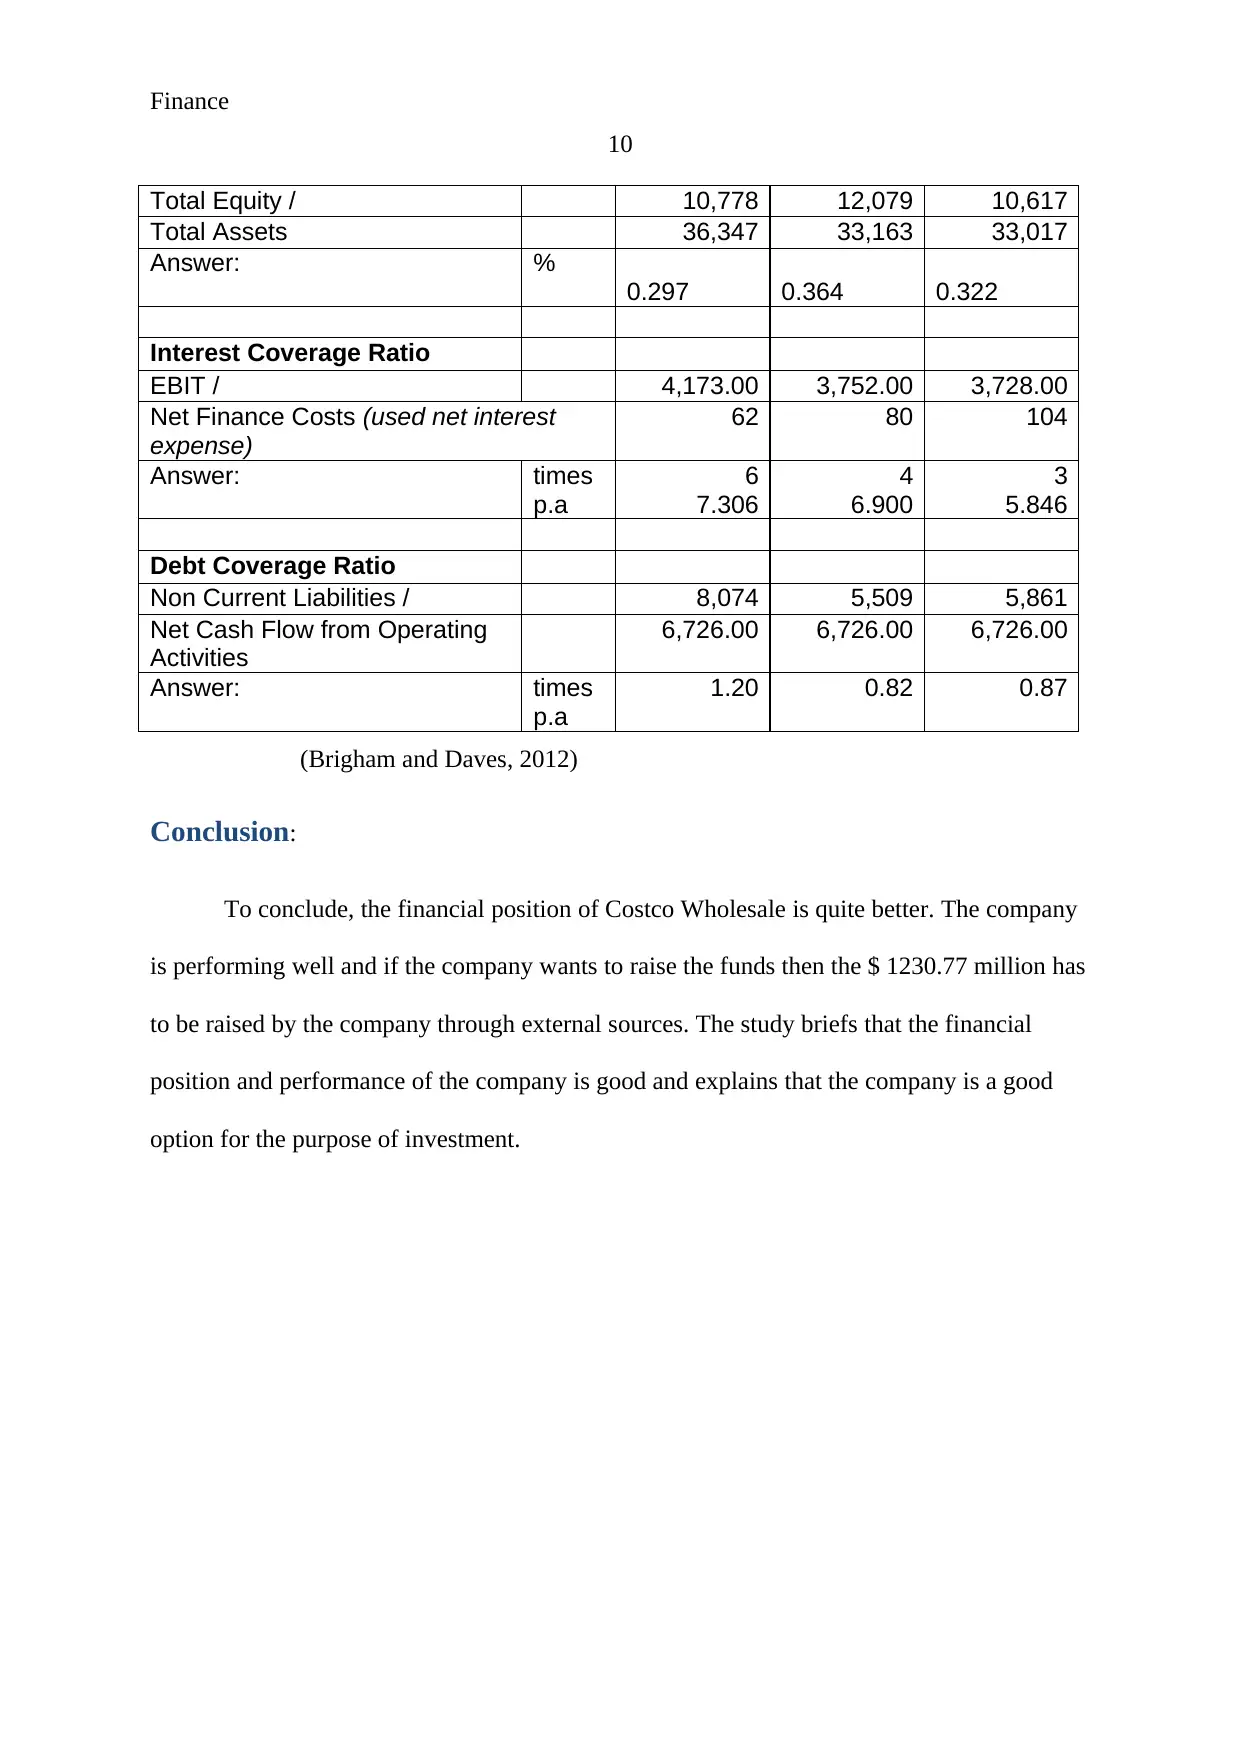
Interest Coverage Ratio
EBIT / 4,173.00 3,752.00 3,728.00
Net Finance Costs (used net interest
expense)
62 80 104
Answer: times
p.a
6
7.306
4
6.900
3
5.846
Debt Coverage Ratio
Non Current Liabilities / 8,074 5,509 5,861
Net Cash Flow from Operating
Activities
6,726.00 6,726.00 6,726.00
Answer: times
p.a
1.20 0.82 0.87
(Brigham and Daves, 2012)
Conclusion:
To conclude, the financial position of Costco Wholesale is quite better. The company
is performing well and if the company wants to raise the funds then the $ 1230.77 million has
to be raised by the company through external sources. The study briefs that the financial
position and performance of the company is good and explains that the company is a good
option for the purpose of investment.
10
Total Equity / 10,778 12,079 10,617
Total Assets 36,347 33,163 33,017
Answer: %
0.297 0.364 0.322
Interest Coverage Ratio
EBIT / 4,173.00 3,752.00 3,728.00
Net Finance Costs (used net interest
expense)
62 80 104
Answer: times
p.a
6
7.306
4
6.900
3
5.846
Debt Coverage Ratio
Non Current Liabilities / 8,074 5,509 5,861
Net Cash Flow from Operating
Activities
6,726.00 6,726.00 6,726.00
Answer: times
p.a
1.20 0.82 0.87
(Brigham and Daves, 2012)
Conclusion:
To conclude, the financial position of Costco Wholesale is quite better. The company
is performing well and if the company wants to raise the funds then the $ 1230.77 million has
to be raised by the company through external sources. The study briefs that the financial
position and performance of the company is good and explains that the company is a good
option for the purpose of investment.
Paraphrase This Document
Need a fresh take? Get an instant paraphrase of this document with our AI Paraphraser
Finance
11
References:
Annual Report. 2017. Costco Wholesale Corporation. [Online]. Available at:
http://phx.corporate-ir.net/phoenix.zhtml?c=83830&p=irol-sec [Accessed as on 10th April
2018].
Brigham, E. and Daves, P., 2012. Intermediate financial management. Nelson Education.
Brigham, E.F. and Ehrhardt, M.C., 2013. Financial management: Theory & practice.
Cengage Learning.
Brigham, E.F. and Houston, J.F., 2012. Fundamentals of financial management. Cengage
Learning.
Brooks, R., 2015. Financial management: core concepts. Pearson.
Brown, R., 2012. Analysis of investments & management of portfolios. Pearson Higher Ed.
Home. 2017. Costco Wholesale Corporation. [Online]. Available at: https://www.costco.com/
[Accessed as on 10th April 2018].
Madura, J., 2011. International financial management. Cengage Learning.
Finance
12
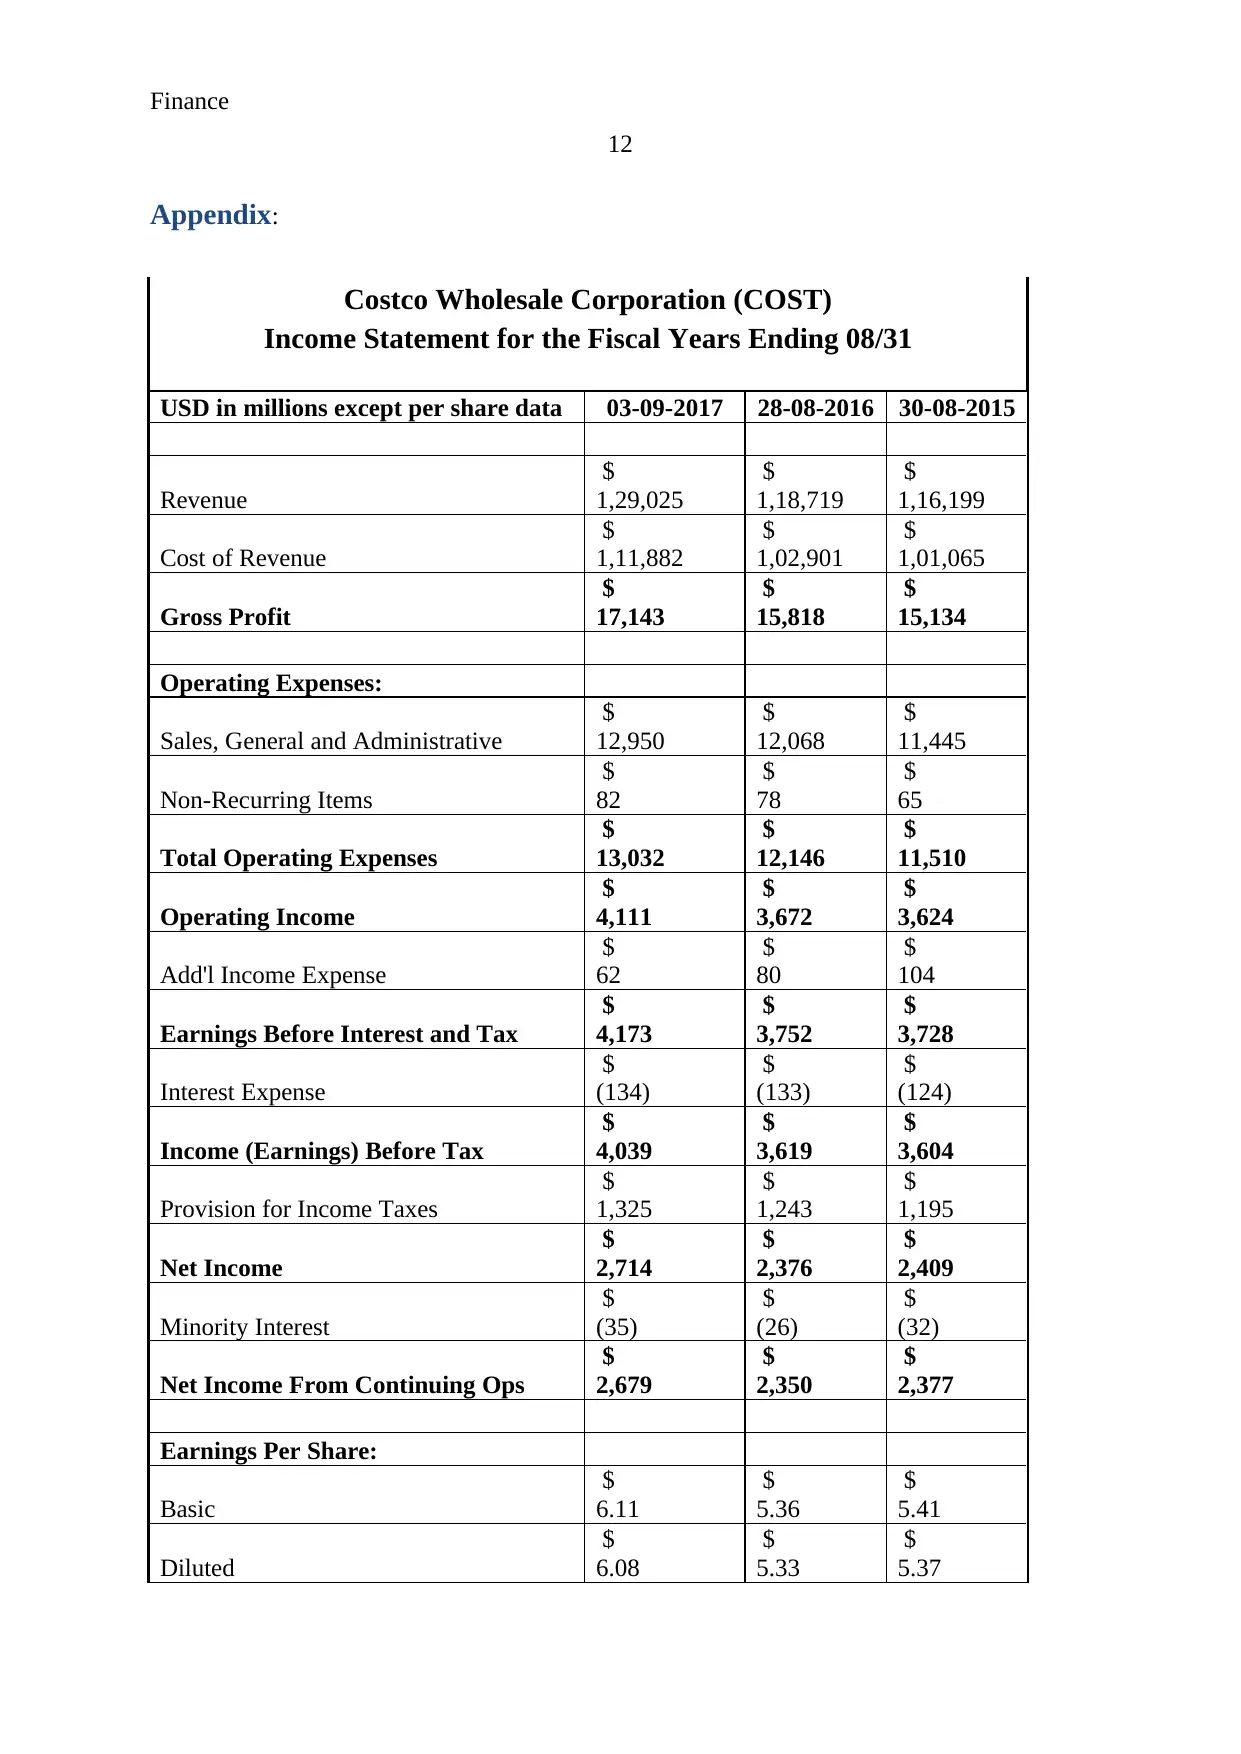
Appendix:
Costco Wholesale Corporation (COST)
Income Statement for the Fiscal Years Ending 08/31
USD in millions except per share data 03-09-2017 28-08-2016 30-08-2015
Revenue
$
1,29,025
$
1,18,719
$
1,16,199
Cost of Revenue
$
1,11,882
$
1,02,901
$
1,01,065
Gross Profit
$
17,143
$
15,818
$
15,134
Operating Expenses:
Sales, General and Administrative
$
12,950
$
12,068
$
11,445
Non-Recurring Items
$
82
$
78
$
65
Total Operating Expenses
$
13,032
$
12,146
$
11,510
Operating Income
$
4,111
$
3,672
$
3,624
Add'l Income Expense
$
62
$
80
$
104
Earnings Before Interest and Tax
$
4,173
$
3,752
$
3,728
Interest Expense
$
(134)
$
(133)
$
(124)
Income (Earnings) Before Tax
$
4,039
$
3,619
$
3,604
Provision for Income Taxes
$
1,325
$
1,243
$
1,195
Net Income
$
2,714
$
2,376
$
2,409
Minority Interest
$
(35)
$
(26)
$
(32)
Net Income From Continuing Ops
$
2,679
$
2,350
$
2,377
Earnings Per Share:
Basic
$
6.11
$
5.36
$
5.41
Diluted
$
6.08
$
5.33
$
5.37
12
Appendix:
Costco Wholesale Corporation (COST)
Income Statement for the Fiscal Years Ending 08/31
USD in millions except per share data 03-09-2017 28-08-2016 30-08-2015
Revenue
$
1,29,025
$
1,18,719
$
1,16,199
Cost of Revenue
$
1,11,882
$
1,02,901
$
1,01,065
Gross Profit
$
17,143
$
15,818
$
15,134
Operating Expenses:
Sales, General and Administrative
$
12,950
$
12,068
$
11,445
Non-Recurring Items
$
82
$
78
$
65
Total Operating Expenses
$
13,032
$
12,146
$
11,510
Operating Income
$
4,111
$
3,672
$
3,624
Add'l Income Expense
$
62
$
80
$
104
Earnings Before Interest and Tax
$
4,173
$
3,752
$
3,728
Interest Expense
$
(134)
$
(133)
$
(124)
Income (Earnings) Before Tax
$
4,039
$
3,619
$
3,604
Provision for Income Taxes
$
1,325
$
1,243
$
1,195
Net Income
$
2,714
$
2,376
$
2,409
Minority Interest
$
(35)
$
(26)
$
(32)
Net Income From Continuing Ops
$
2,679
$
2,350
$
2,377
Earnings Per Share:
Basic
$
6.11
$
5.36
$
5.41
Diluted
$
6.08
$
5.33
$
5.37
⊘ This is a preview!⊘
Do you want full access?
Subscribe today to unlock all pages.
Trusted by 1+ million students worldwide
1 out of 20
Related Documents


Your All-in-One AI-Powered Toolkit for Academic Success.
+13062052269
info@desklib.com
Available 24*7 on WhatsApp / Email
![[object Object]](/_next/static/media/star-bottom.7253800d.svg)
Unlock your academic potential
Copyright © 2020–2026 A2Z Services. All Rights Reserved. Developed and managed by ZUCOL.