Comparative Financial Analysis and Project Evaluation Report
VerifiedAdded on 2020/01/28
|19
|3782
|45
Report
AI Summary
This report, prepared for an Accounting and Finance for Managers course, undertakes a comparative financial analysis of Next Plc and Hennes & Mauritz (H&M) using ratio analysis to assess their financial strengths, efficiency, and profitability. The analysis includes liquidity, efficiency, profitability, valuation, and non-financial ratios. Based on the findings, recommendations are made regarding investment decisions for Asol Ltd. The report further evaluates two capital projects for Hilltop Ltd using project evaluation techniques such as Net Cash Flow, Payback Period, Net Present Value, and Accounting Rate of Return to determine the most viable project. Limitations of the techniques used are also discussed, providing a comprehensive overview of financial analysis and project evaluation methodologies.

ACCOUNTING AND FINANCE FOR
MANAGERS
MANAGERS
Paraphrase This Document
Need a fresh take? Get an instant paraphrase of this document with our AI Paraphraser
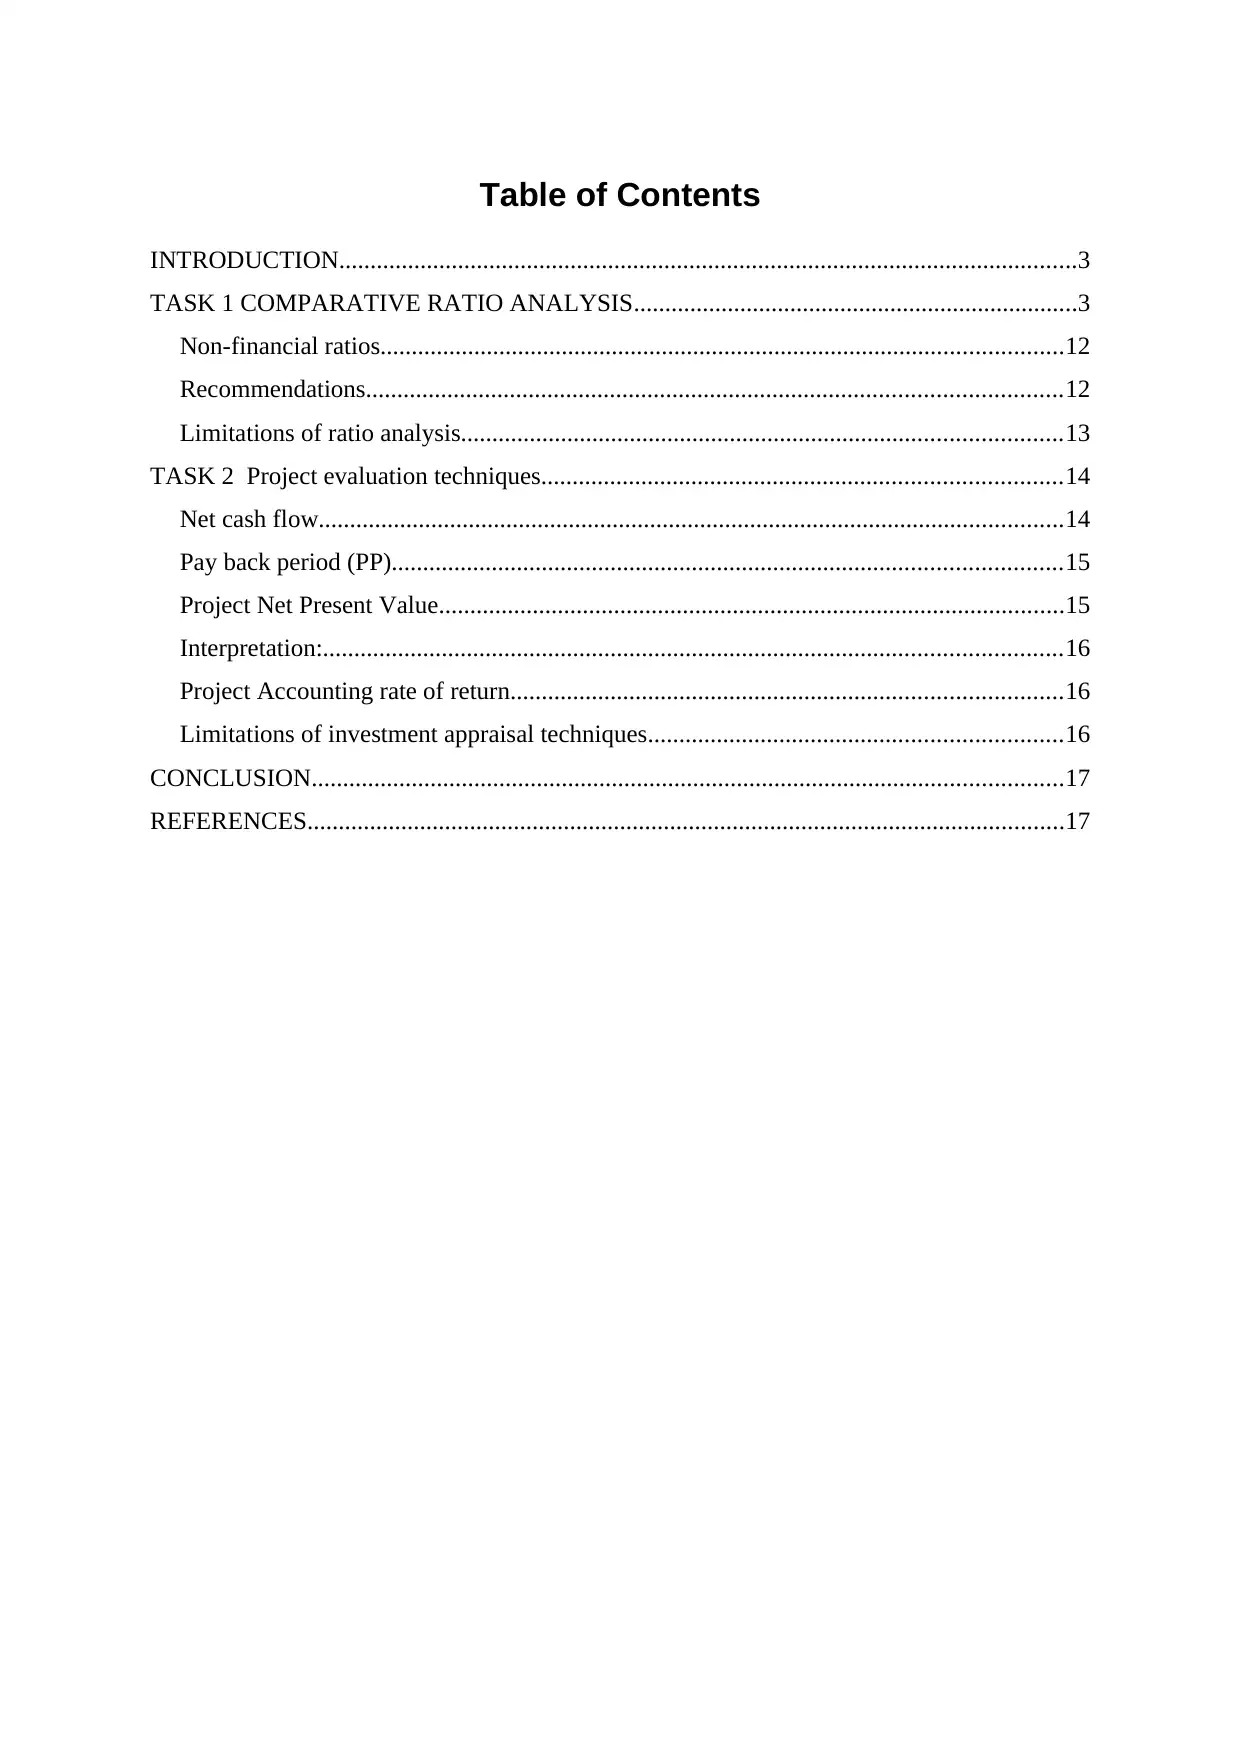
Table of Contents
INTRODUCTION......................................................................................................................3
TASK 1 COMPARATIVE RATIO ANALYSIS.......................................................................3
Non-financial ratios.............................................................................................................12
Recommendations...............................................................................................................12
Limitations of ratio analysis................................................................................................13
TASK 2 Project evaluation techniques...................................................................................14
Net cash flow.......................................................................................................................14
Pay back period (PP)...........................................................................................................15
Project Net Present Value....................................................................................................15
Interpretation:......................................................................................................................16
Project Accounting rate of return........................................................................................16
Limitations of investment appraisal techniques..................................................................16
CONCLUSION........................................................................................................................17
REFERENCES.........................................................................................................................17
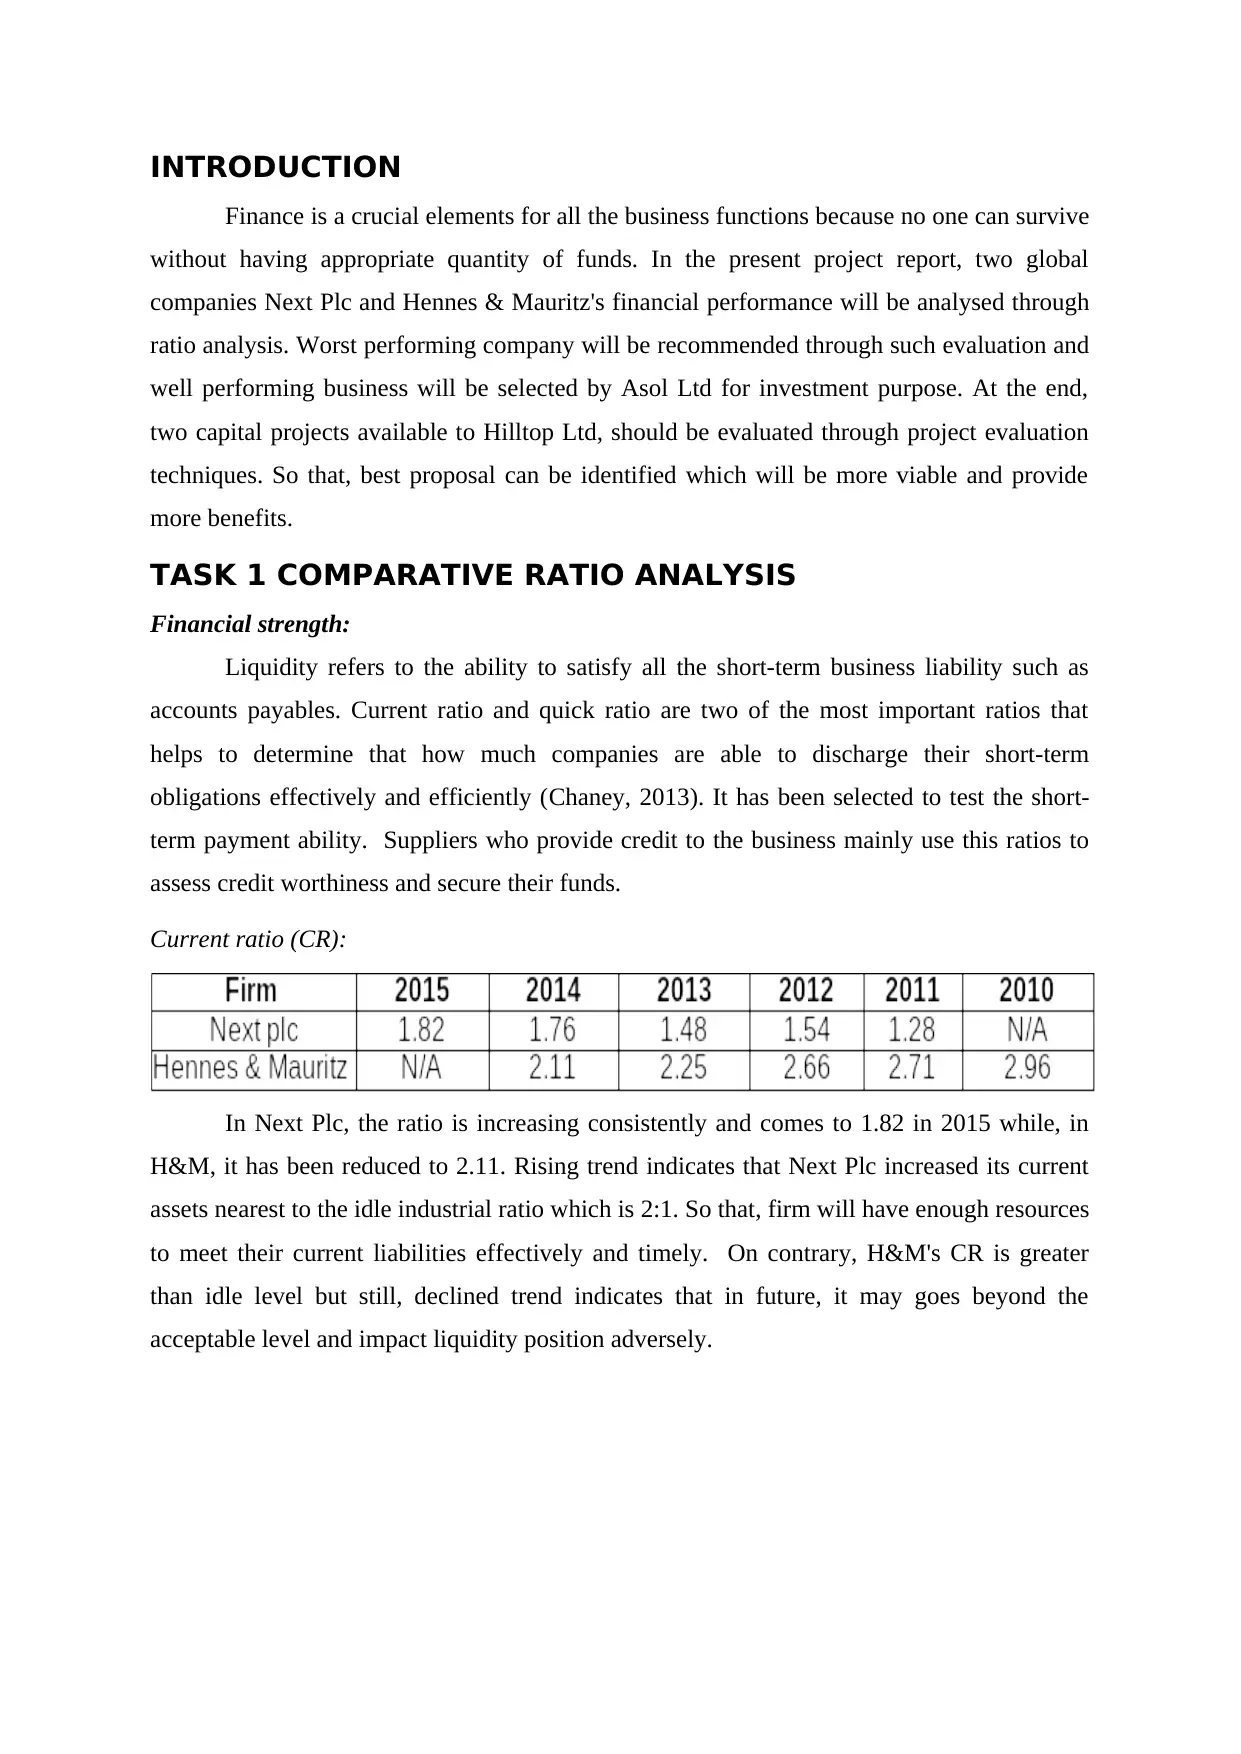
INTRODUCTION
Finance is a crucial elements for all the business functions because no one can survive
without having appropriate quantity of funds. In the present project report, two global
companies Next Plc and Hennes & Mauritz's financial performance will be analysed through
ratio analysis. Worst performing company will be recommended through such evaluation and
well performing business will be selected by Asol Ltd for investment purpose. At the end,
two capital projects available to Hilltop Ltd, should be evaluated through project evaluation
techniques. So that, best proposal can be identified which will be more viable and provide
more benefits.
TASK 1 COMPARATIVE RATIO ANALYSIS
Financial strength:
Liquidity refers to the ability to satisfy all the short-term business liability such as
accounts payables. Current ratio and quick ratio are two of the most important ratios that
helps to determine that how much companies are able to discharge their short-term
obligations effectively and efficiently (Chaney, 2013). It has been selected to test the short-
term payment ability. Suppliers who provide credit to the business mainly use this ratios to
assess credit worthiness and secure their funds.
Current ratio (CR):
In Next Plc, the ratio is increasing consistently and comes to 1.82 in 2015 while, in
H&M, it has been reduced to 2.11. Rising trend indicates that Next Plc increased its current
assets nearest to the idle industrial ratio which is 2:1. So that, firm will have enough resources
to meet their current liabilities effectively and timely. On contrary, H&M's CR is greater
than idle level but still, declined trend indicates that in future, it may goes beyond the
acceptable level and impact liquidity position adversely.
⊘ This is a preview!⊘
Do you want full access?
Subscribe today to unlock all pages.
Trusted by 1+ million students worldwide
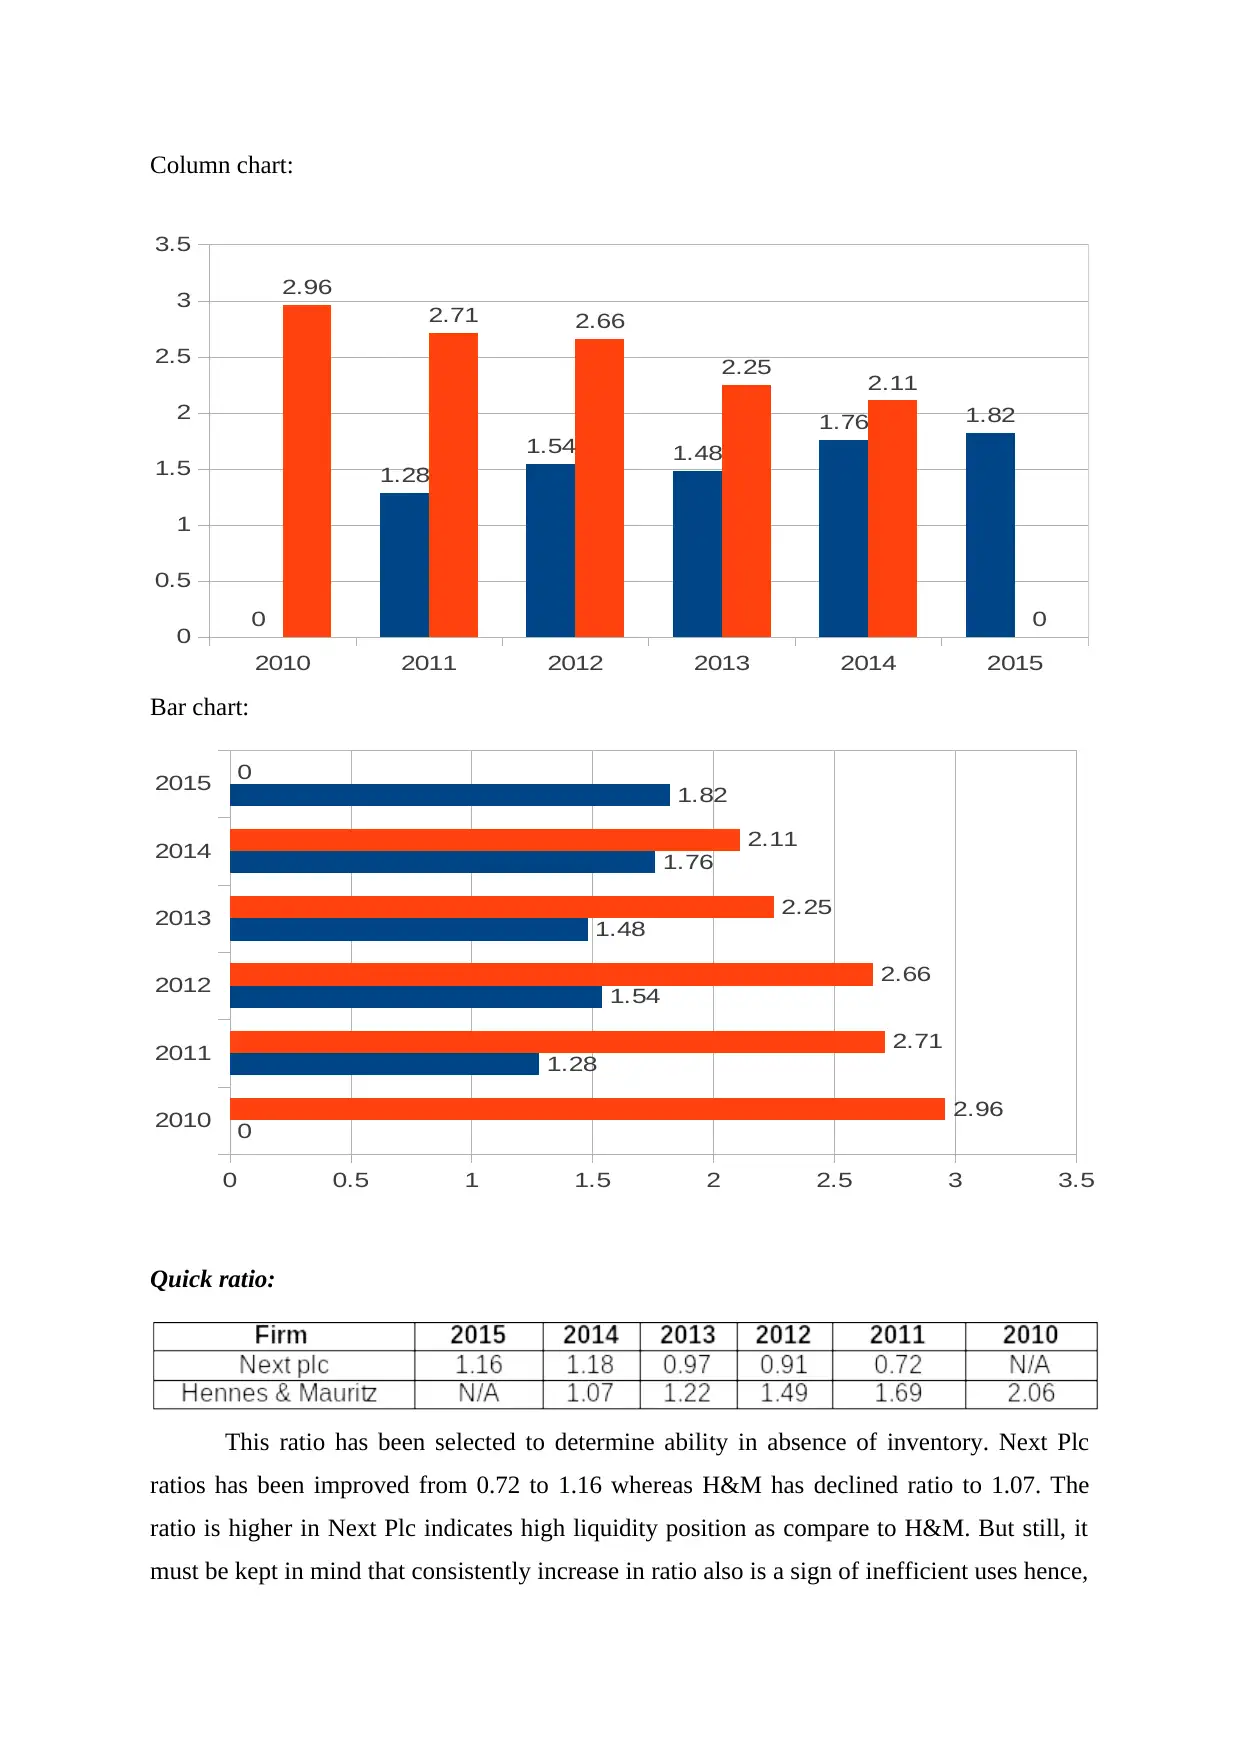
Column chart:
Bar chart:
Quick ratio:
This ratio has been selected to determine ability in absence of inventory. Next Plc
ratios has been improved from 0.72 to 1.16 whereas H&M has declined ratio to 1.07. The
ratio is higher in Next Plc indicates high liquidity position as compare to H&M. But still, it
must be kept in mind that consistently increase in ratio also is a sign of inefficient uses hence,
2010 2011 2012 2013 2014 2015
0
0.5
1
1.5
2
2.5
3
3.5
0
1.28
1.54 1.48
1.76 1.82
2.96
2.71 2.66
2.25 2.11
0
2010
2011
2012
2013
2014
2015
0 0.5 1 1.5 2 2.5 3 3.5
0
1.28
1.54
1.48
1.76
1.82
2.96
2.71
2.66
2.25
2.11
0
Paraphrase This Document
Need a fresh take? Get an instant paraphrase of this document with our AI Paraphraser
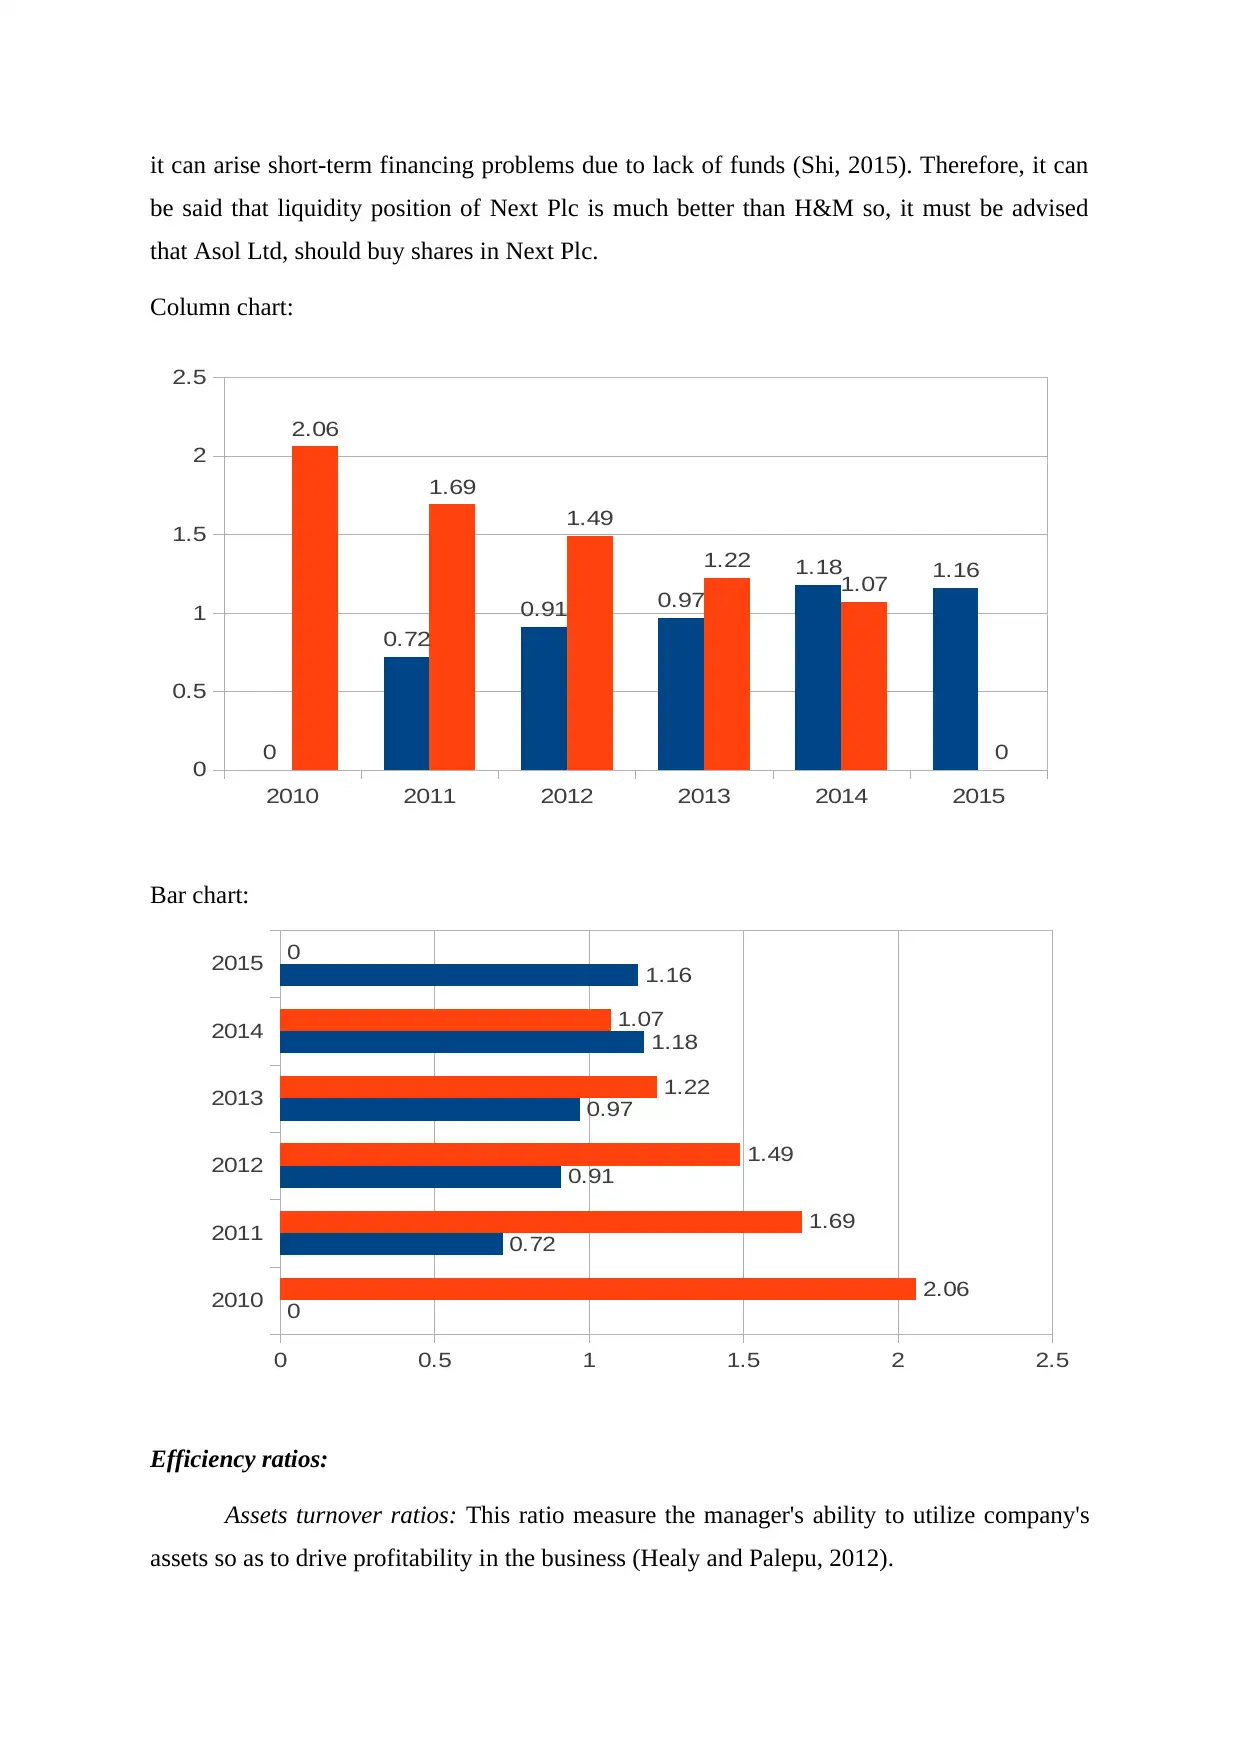
it can arise short-term financing problems due to lack of funds (Shi, 2015). Therefore, it can
be said that liquidity position of Next Plc is much better than H&M so, it must be advised
that Asol Ltd, should buy shares in Next Plc.
Column chart:
Bar chart:
Efficiency ratios:
Assets turnover ratios: This ratio measure the manager's ability to utilize company's
assets so as to drive profitability in the business (Healy and Palepu, 2012).
2010 2011 2012 2013 2014 2015
0
0.5
1
1.5
2
2.5
0
0.72
0.91 0.97
1.18 1.16
2.06
1.69
1.49
1.22
1.07
0
2010
2011
2012
2013
2014
2015
0 0.5 1 1.5 2 2.5
0
0.72
0.91
0.97
1.18
1.16
2.06
1.69
1.49
1.22
1.07
0
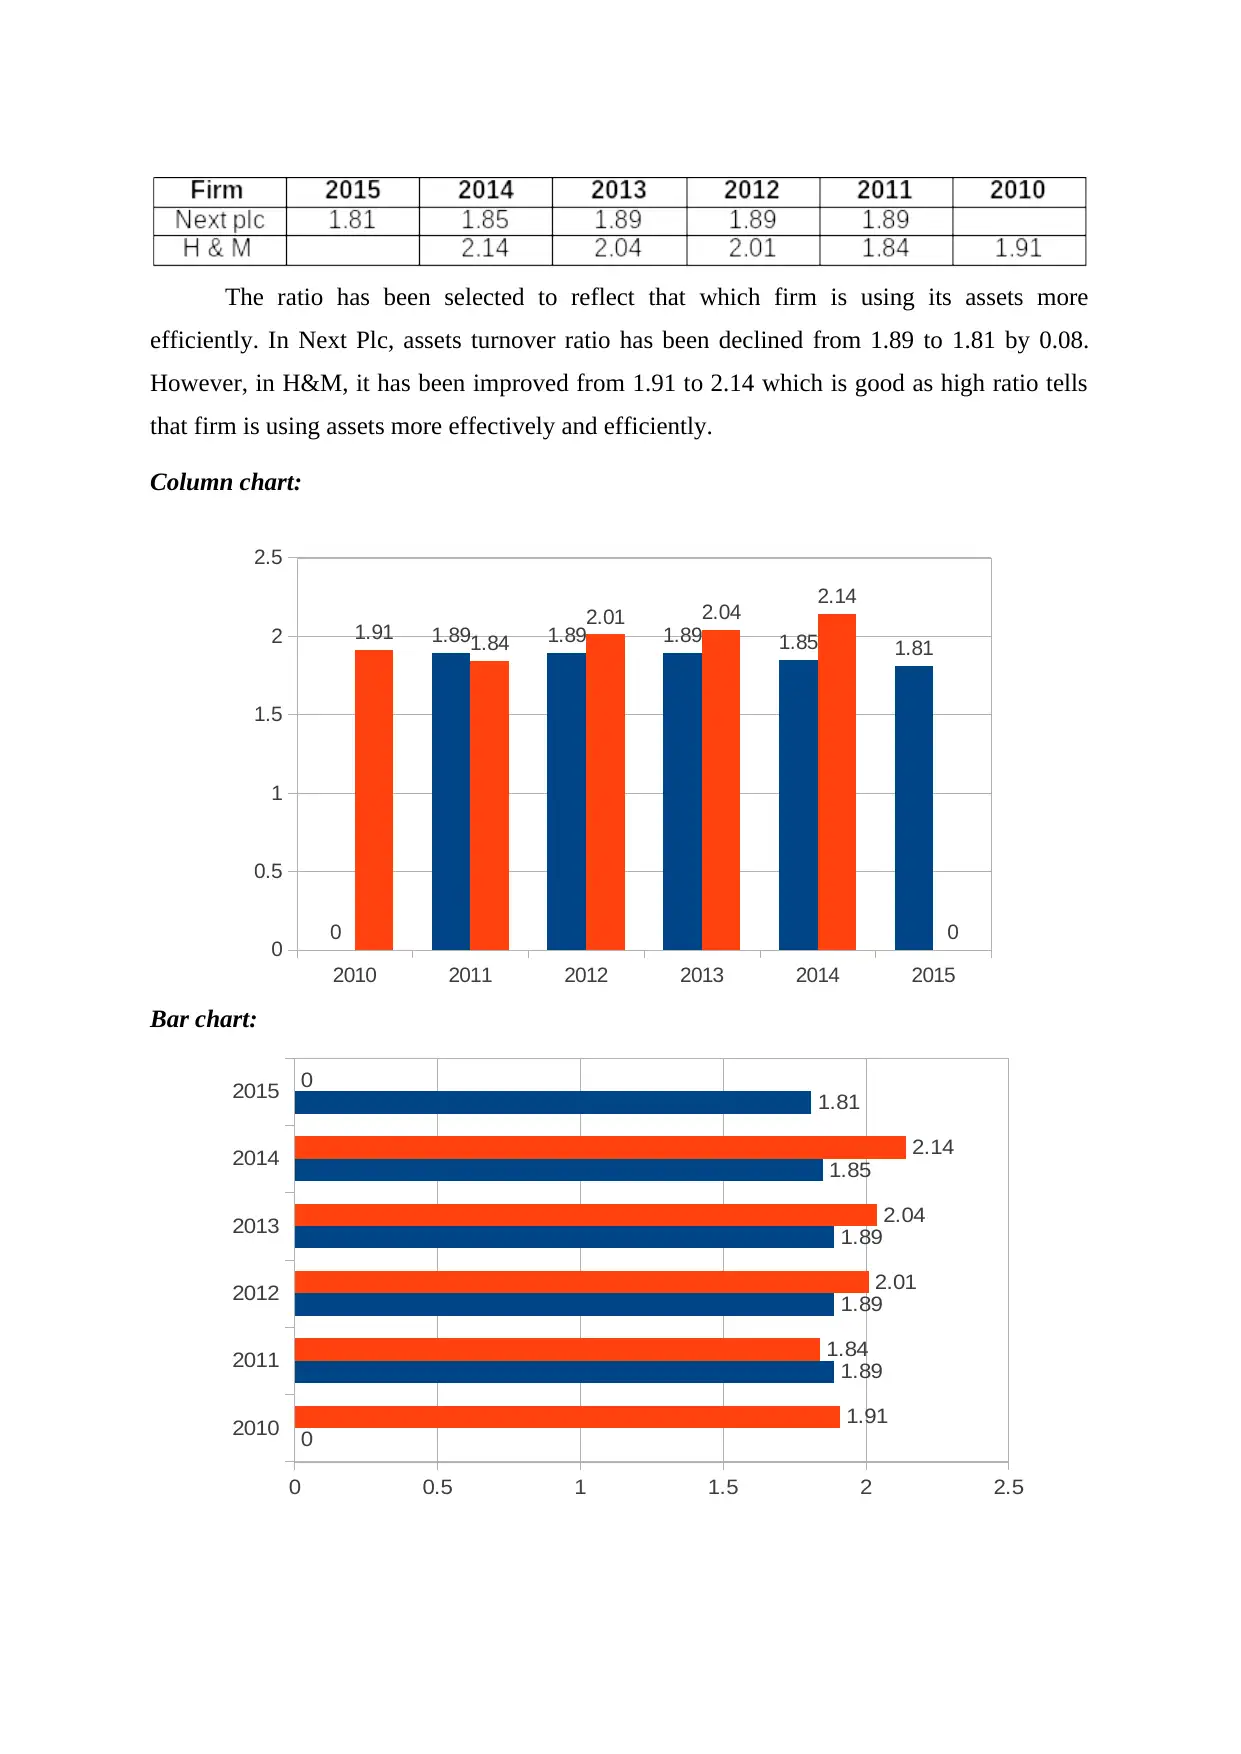
The ratio has been selected to reflect that which firm is using its assets more
efficiently. In Next Plc, assets turnover ratio has been declined from 1.89 to 1.81 by 0.08.
However, in H&M, it has been improved from 1.91 to 2.14 which is good as high ratio tells
that firm is using assets more effectively and efficiently.
Column chart:
Bar chart:
2010 2011 2012 2013 2014 2015
0
0.5
1
1.5
2
2.5
0
1.89 1.89 1.89 1.85 1.81
1.91 1.84
2.01 2.04 2.14
0
2010
2011
2012
2013
2014
2015
0 0.5 1 1.5 2 2.5
0
1.89
1.89
1.89
1.85
1.81
1.91
1.84
2.01
2.04
2.14
0
⊘ This is a preview!⊘
Do you want full access?
Subscribe today to unlock all pages.
Trusted by 1+ million students worldwide
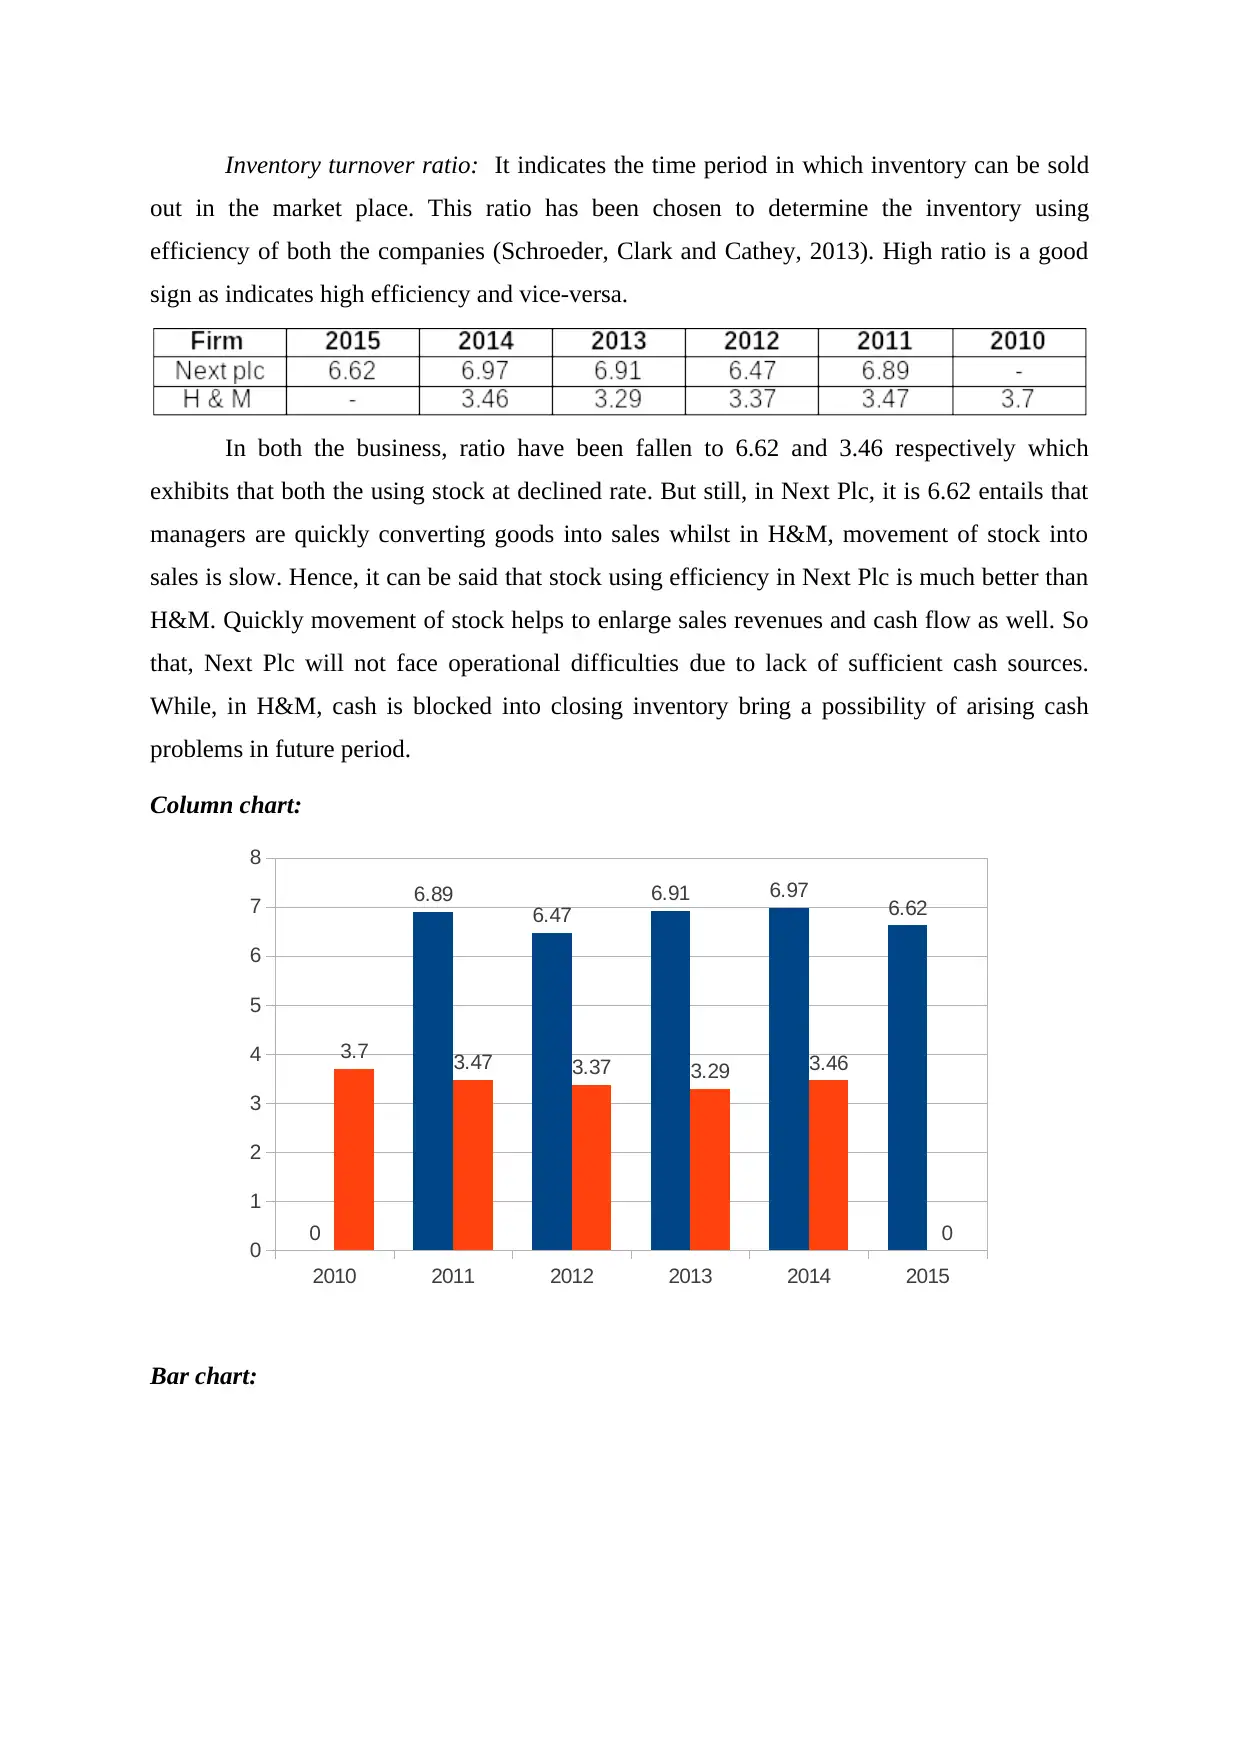
Inventory turnover ratio: It indicates the time period in which inventory can be sold
out in the market place. This ratio has been chosen to determine the inventory using
efficiency of both the companies (Schroeder, Clark and Cathey, 2013). High ratio is a good
sign as indicates high efficiency and vice-versa.
In both the business, ratio have been fallen to 6.62 and 3.46 respectively which
exhibits that both the using stock at declined rate. But still, in Next Plc, it is 6.62 entails that
managers are quickly converting goods into sales whilst in H&M, movement of stock into
sales is slow. Hence, it can be said that stock using efficiency in Next Plc is much better than
H&M. Quickly movement of stock helps to enlarge sales revenues and cash flow as well. So
that, Next Plc will not face operational difficulties due to lack of sufficient cash sources.
While, in H&M, cash is blocked into closing inventory bring a possibility of arising cash
problems in future period.
Column chart:
Bar chart:
2010 2011 2012 2013 2014 2015
0
1
2
3
4
5
6
7
8
0
6.89 6.47
6.91 6.97 6.62
3.7 3.47 3.37 3.29 3.46
0
Paraphrase This Document
Need a fresh take? Get an instant paraphrase of this document with our AI Paraphraser
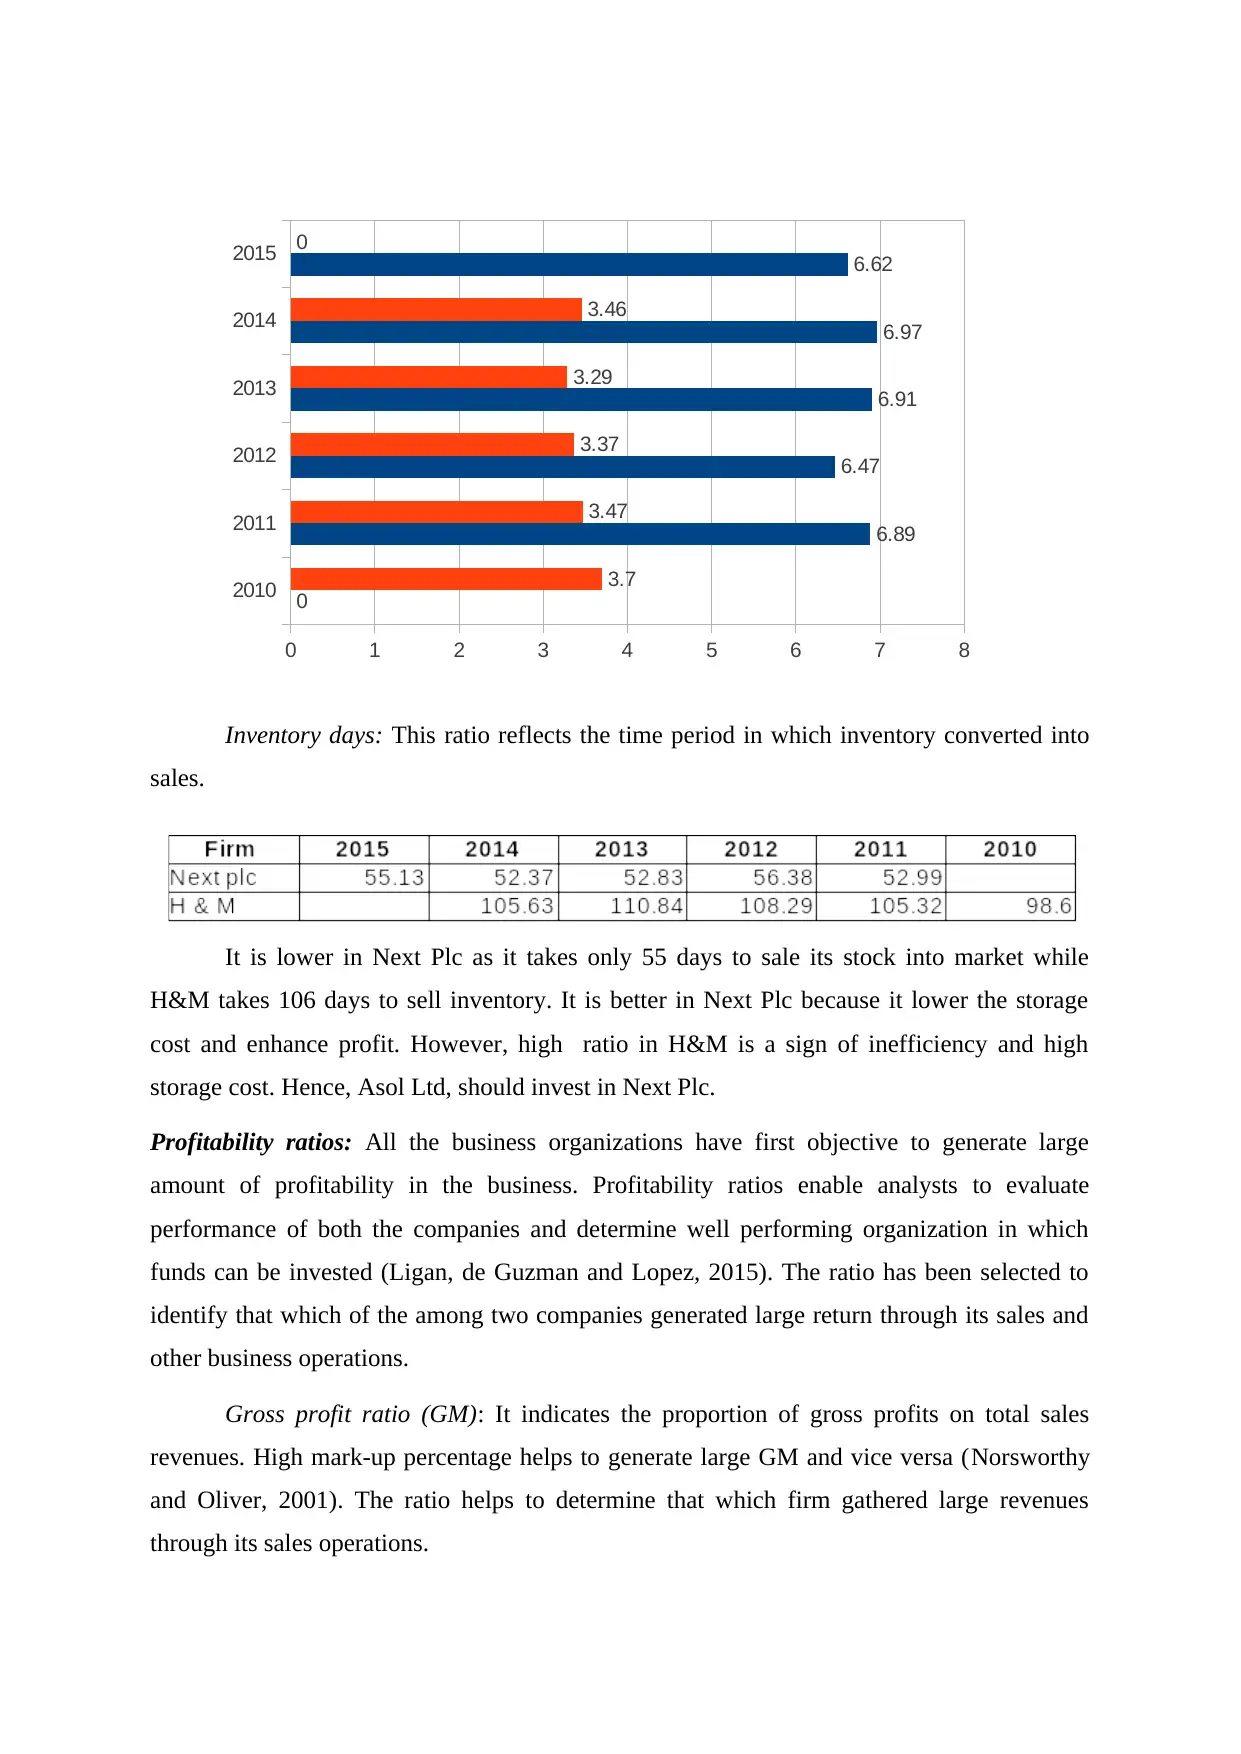
Inventory days: This ratio reflects the time period in which inventory converted into
sales.
It is lower in Next Plc as it takes only 55 days to sale its stock into market while
H&M takes 106 days to sell inventory. It is better in Next Plc because it lower the storage
cost and enhance profit. However, high ratio in H&M is a sign of inefficiency and high
storage cost. Hence, Asol Ltd, should invest in Next Plc.
Profitability ratios: All the business organizations have first objective to generate large
amount of profitability in the business. Profitability ratios enable analysts to evaluate
performance of both the companies and determine well performing organization in which
funds can be invested (Ligan, de Guzman and Lopez, 2015). The ratio has been selected to
identify that which of the among two companies generated large return through its sales and
other business operations.
Gross profit ratio (GM): It indicates the proportion of gross profits on total sales
revenues. High mark-up percentage helps to generate large GM and vice versa (Norsworthy
and Oliver, 2001). The ratio helps to determine that which firm gathered large revenues
through its sales operations.
2010
2011
2012
2013
2014
2015
0 1 2 3 4 5 6 7 8
0
6.89
6.47
6.91
6.97
6.62
3.7
3.47
3.37
3.29
3.46
0
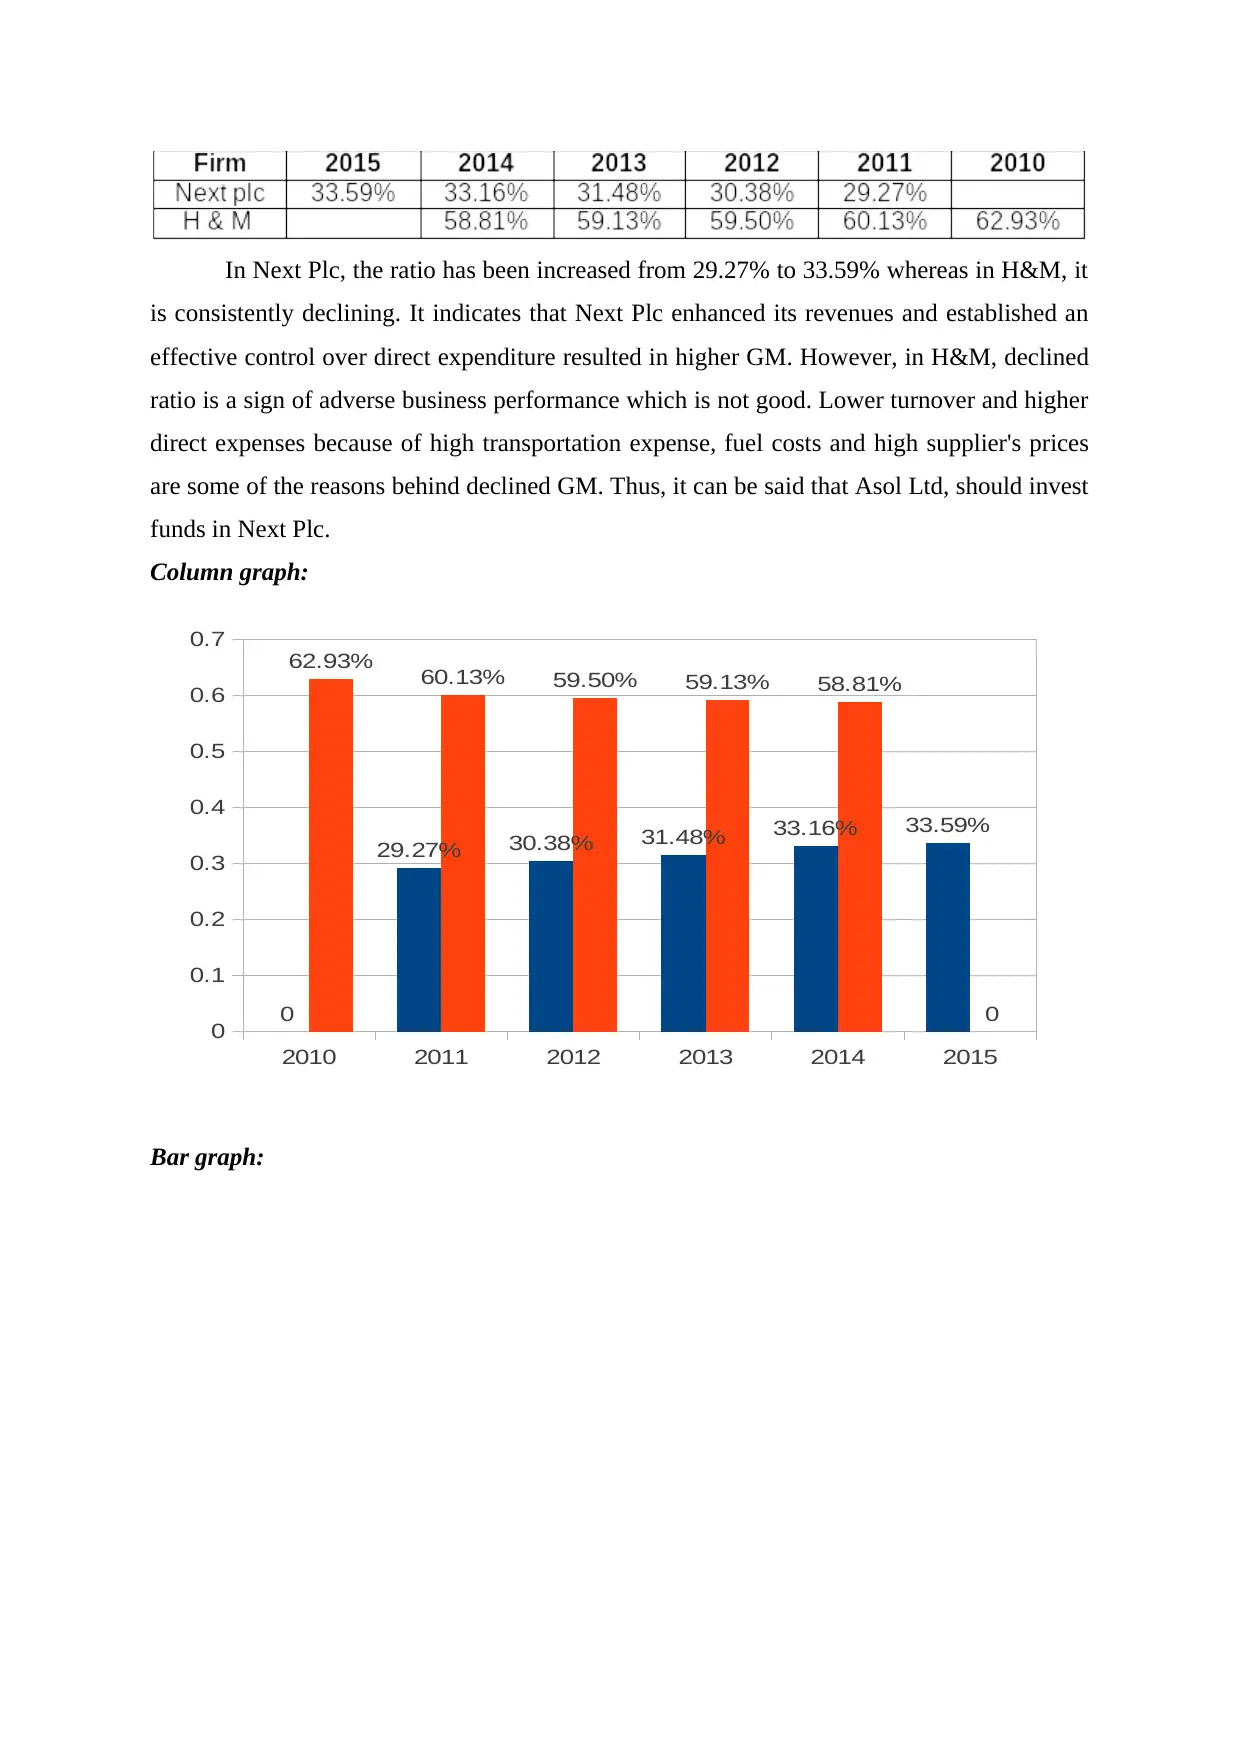
In Next Plc, the ratio has been increased from 29.27% to 33.59% whereas in H&M, it
is consistently declining. It indicates that Next Plc enhanced its revenues and established an
effective control over direct expenditure resulted in higher GM. However, in H&M, declined
ratio is a sign of adverse business performance which is not good. Lower turnover and higher
direct expenses because of high transportation expense, fuel costs and high supplier's prices
are some of the reasons behind declined GM. Thus, it can be said that Asol Ltd, should invest
funds in Next Plc.
Column graph:
Bar graph:
2010 2011 2012 2013 2014 2015
0
0.1
0.2
0.3
0.4
0.5
0.6
0.7
0
29.27% 30.38% 31.48% 33.16% 33.59%
62.93% 60.13% 59.50% 59.13% 58.81%
0
⊘ This is a preview!⊘
Do you want full access?
Subscribe today to unlock all pages.
Trusted by 1+ million students worldwide
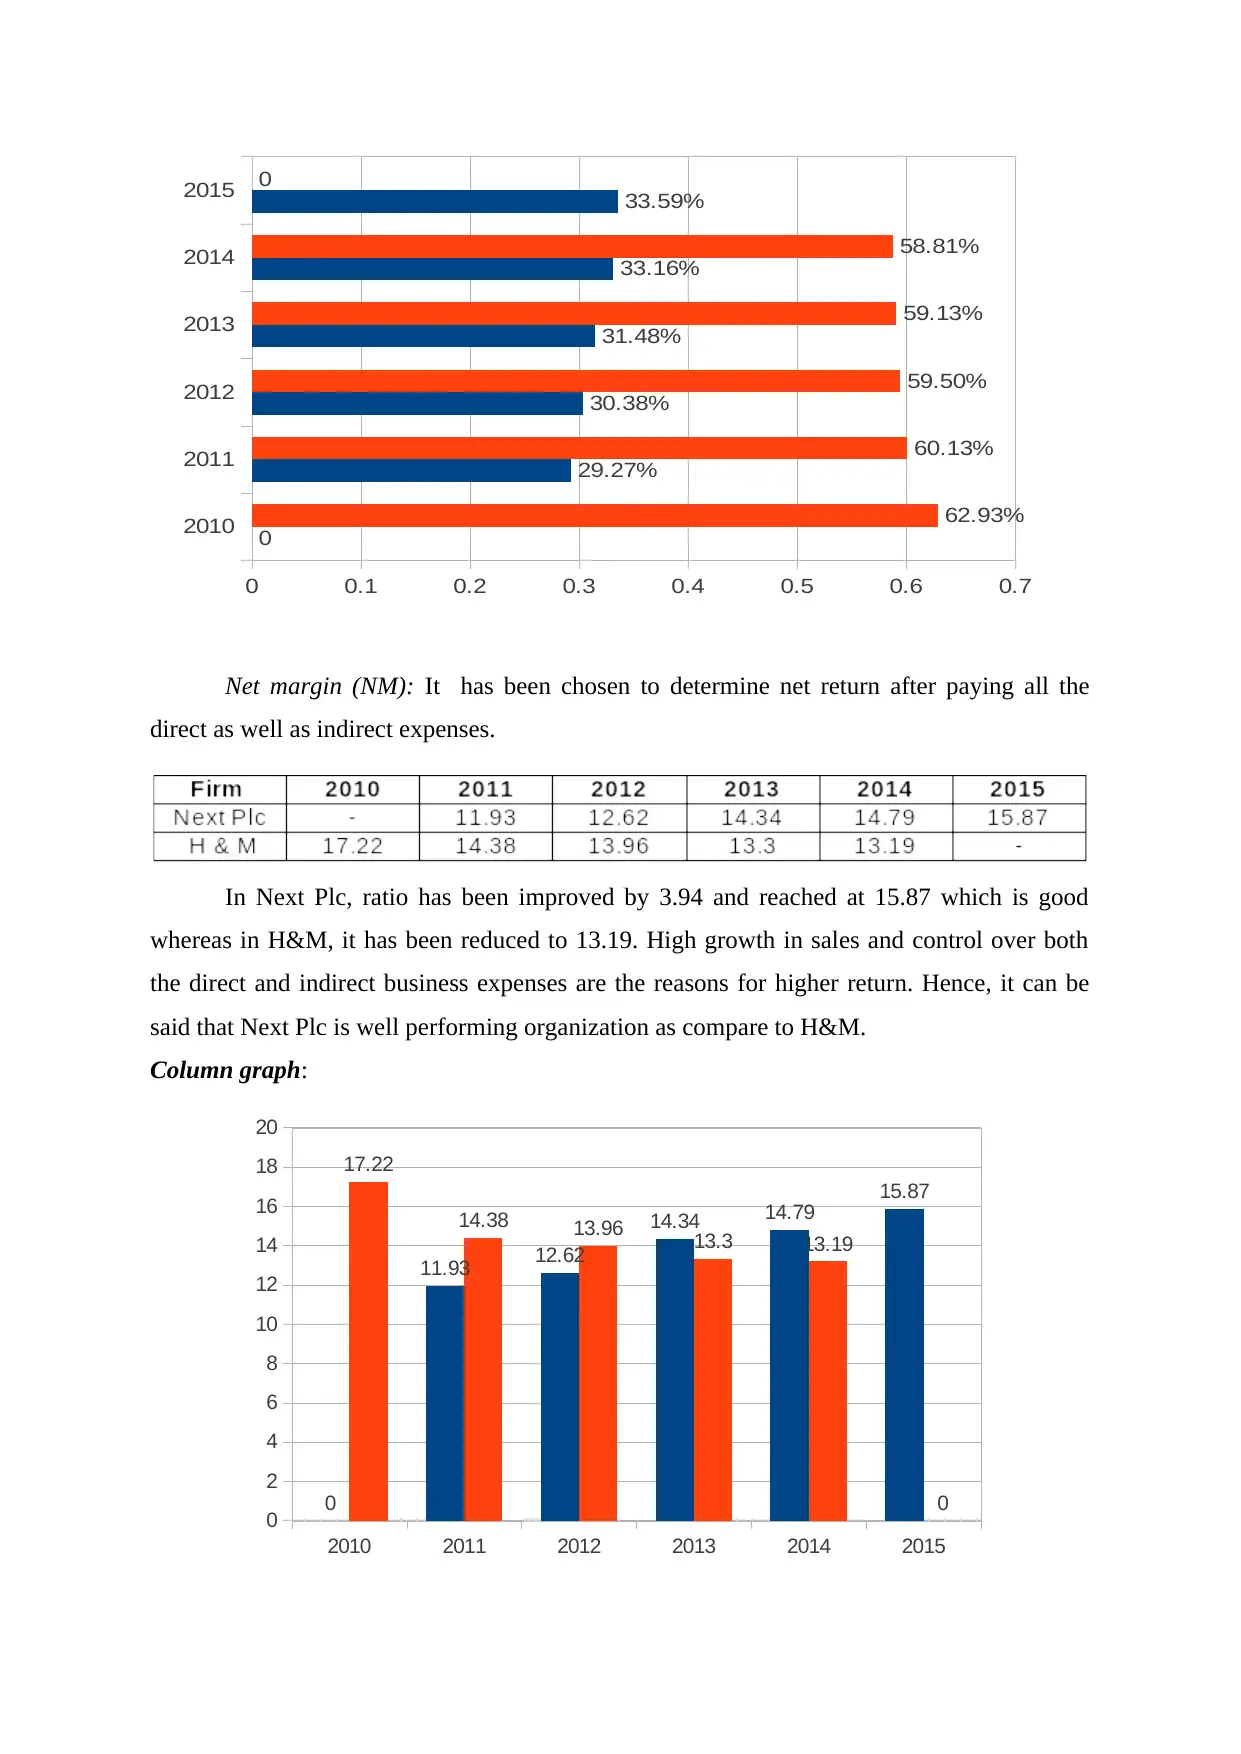
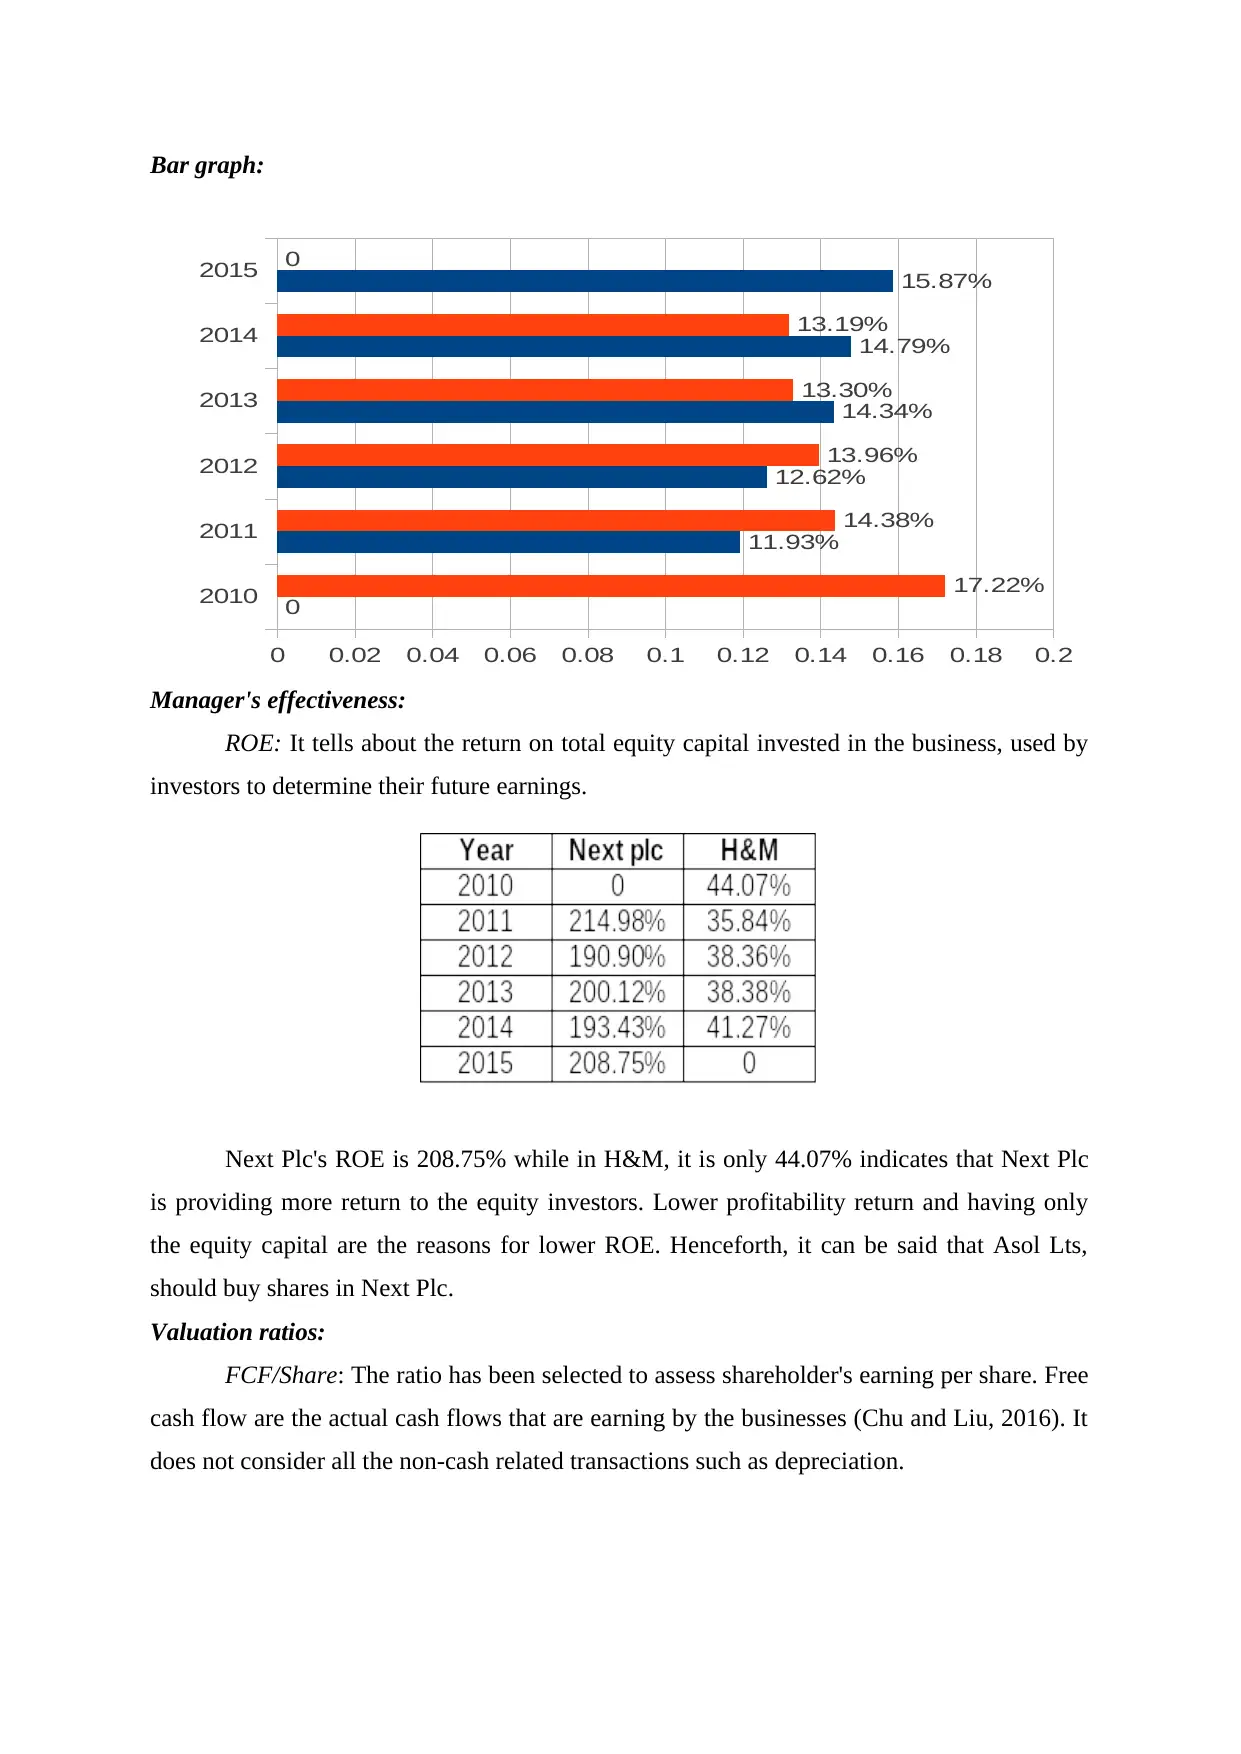
Net margin (NM): It has been chosen to determine net return after paying all the
direct as well as indirect expenses.
In Next Plc, ratio has been improved by 3.94 and reached at 15.87 which is good
whereas in H&M, it has been reduced to 13.19. High growth in sales and control over both
the direct and indirect business expenses are the reasons for higher return. Hence, it can be
said that Next Plc is well performing organization as compare to H&M.
Column graph:
2010 2011 2012 2013 2014 2015
0
2
4
6
8
10
12
14
16
18
20
0
11.93 12.62
14.34 14.79
15.87
17.22
14.38 13.96 13.3 13.19
0
2010
2011
2012
2013
2014
2015
0 0.1 0.2 0.3 0.4 0.5 0.6 0.7
0
29.27%
30.38%
31.48%
33.16%
33.59%
62.93%
60.13%
59.50%
59.13%
58.81%
0
Paraphrase This Document
Need a fresh take? Get an instant paraphrase of this document with our AI Paraphraser
Bar graph:
Manager's effectiveness:
ROE: It tells about the return on total equity capital invested in the business, used by
investors to determine their future earnings.
Next Plc's ROE is 208.75% while in H&M, it is only 44.07% indicates that Next Plc
is providing more return to the equity investors. Lower profitability return and having only
the equity capital are the reasons for lower ROE. Henceforth, it can be said that Asol Lts,
should buy shares in Next Plc.
Valuation ratios:
FCF/Share: The ratio has been selected to assess shareholder's earning per share. Free
cash flow are the actual cash flows that are earning by the businesses (Chu and Liu, 2016). It
does not consider all the non-cash related transactions such as depreciation.
2010
2011
2012
2013
2014
2015
0 0.02 0.04 0.06 0.08 0.1 0.12 0.14 0.16 0.18 0.2
0
11.93%
12.62%
14.34%
14.79%
15.87%
17.22%
14.38%
13.96%
13.30%
13.19%
0
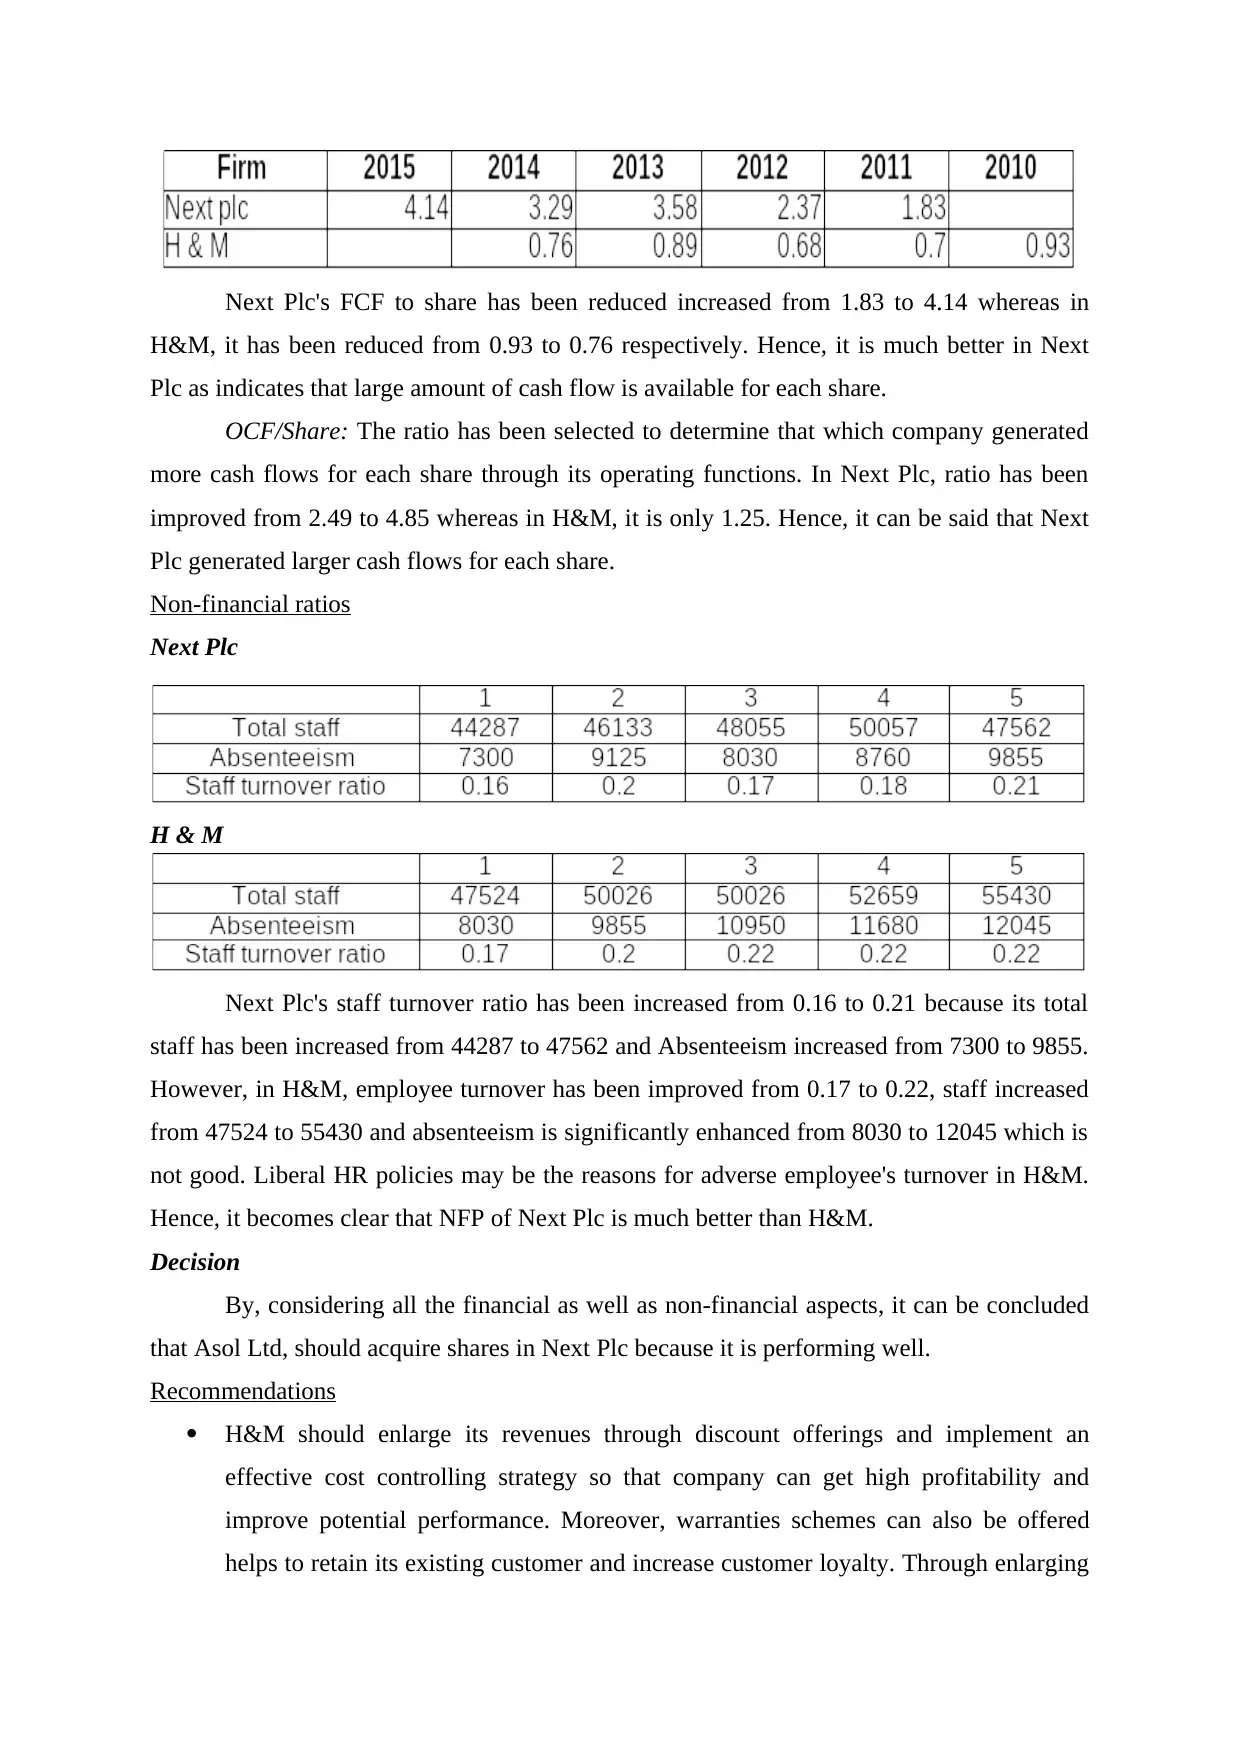
Next Plc's FCF to share has been reduced increased from 1.83 to 4.14 whereas in
H&M, it has been reduced from 0.93 to 0.76 respectively. Hence, it is much better in Next
Plc as indicates that large amount of cash flow is available for each share.
OCF/Share: The ratio has been selected to determine that which company generated
more cash flows for each share through its operating functions. In Next Plc, ratio has been
improved from 2.49 to 4.85 whereas in H&M, it is only 1.25. Hence, it can be said that Next
Plc generated larger cash flows for each share.
Non-financial ratios
Next Plc
H & M
Next Plc's staff turnover ratio has been increased from 0.16 to 0.21 because its total
staff has been increased from 44287 to 47562 and Absenteeism increased from 7300 to 9855.
However, in H&M, employee turnover has been improved from 0.17 to 0.22, staff increased
from 47524 to 55430 and absenteeism is significantly enhanced from 8030 to 12045 which is
not good. Liberal HR policies may be the reasons for adverse employee's turnover in H&M.
Hence, it becomes clear that NFP of Next Plc is much better than H&M.
Decision
By, considering all the financial as well as non-financial aspects, it can be concluded
that Asol Ltd, should acquire shares in Next Plc because it is performing well.
Recommendations
H&M should enlarge its revenues through discount offerings and implement an
effective cost controlling strategy so that company can get high profitability and
improve potential performance. Moreover, warranties schemes can also be offered
helps to retain its existing customer and increase customer loyalty. Through enlarging
⊘ This is a preview!⊘
Do you want full access?
Subscribe today to unlock all pages.
Trusted by 1+ million students worldwide
1 out of 19
Related Documents


Your All-in-One AI-Powered Toolkit for Academic Success.
+13062052269
info@desklib.com
Available 24*7 on WhatsApp / Email
![[object Object]](/_next/static/media/star-bottom.7253800d.svg)
Unlock your academic potential
Copyright © 2020–2026 A2Z Services. All Rights Reserved. Developed and managed by ZUCOL.