Project Report: Finance for Managers - Semester 1, 2024
VerifiedAdded on 2021/04/16
|13
|2793
|175
Project
AI Summary
This project report provides a detailed financial analysis, focusing on portfolio return, risk assessment, and Capital Asset Pricing Model (CAPM) calculations. It examines the historical monthly returns of a market index, along with JB HI FI and Bega Cheese stocks. The report calculates average rates of return, standard deviations, and covariance to assess portfolio performance and risk. CAPM calculations are performed for both JB HI FI and Bega Cheese to determine expected returns. Furthermore, the report explores the relationship between risk and return, differentiating between systematic and unsystematic risk and the impact of diversification. It also compares the performance of JB HI FI with the market index and Bega Cheese, offering insights into stock volatility and investment strategies, and concludes with recommendations for investors considering risk and return trade-offs.

Running Head: Finance for managers
1
Project Report: Finance for managers
1
Project Report: Finance for managers
Paraphrase This Document
Need a fresh take? Get an instant paraphrase of this document with our AI Paraphraser
Finance for managers
2
Contents
Introduction.......................................................................................................................4
Question 1.........................................................................................................................4
Historical rate of return for market index.....................................................................4
Historical average rate of return and standard deviation..............................................4
Question 2.........................................................................................................................5
Portfolio historical average rate of return and standard deviation....................................5
Question 3.........................................................................................................................5
Calculation of CAPM.......................................................................................................5
Question 4.........................................................................................................................6
Portfolio expected return and beta....................................................................................6
Question 5.........................................................................................................................6
Risk and return..................................................................................................................6
Conclusion........................................................................................................................8
References.........................................................................................................................9
Finance for managers
3
Data collected and calculated for JB HI FI, Bega Cheese and AORD:
Historical Monthly Returns of
Market Index:
Date
Monthly
Closing
Index
Monthly
Returns
Zi
Z = [zi – z(i–
1)]/ z(i- 1)
Sep-17 55459.75
Oct-17 57712.86 4.06%
Nov-17 58813.50 1.91%
Dec-17 60007.77 2.03%
Jan-18 59809.19 -0.33%
Feb-18 59916.01 0.18%
Q.1.a:
Historical Average Rate of Returns
& Standard Deviation:
Date JB HI FI
Referen
ce Co.
(Bega
Cheese) Market Index
JB
HI
FI
Refe
renc
e Co.
(Beg
a
Chee
se)
Ma
rke
t
Ind
ex
Xi Yi
Zi
(X -
Xi )2 (Y - Yi )2 (Z -
Zi )2
Oct-17 -0.087% 7.61% 4.06%
0.1
30
%
0.547
%
0.0
62
%
Nov-17 3.10% 4.90% 1.91%
0.0
02
%
0.219
%
0.0
01
%
Dec-17 5.63% -6.23% 2.03%
0.0
45
%
0.416
%
0.0
02
%
Jan-18 17.20% -2.49% -0.33%
1.8
73
%
0.073
%
0.0
36
%
Feb-18 -8.28% -2.70% 0.18%
1.3
91
%
0.085
%
0.0
19
%
Average
Rate of
Returns 3.513% 0.220% 1.570%
⊘ This is a preview!⊘
Do you want full access?
Subscribe today to unlock all pages.
Trusted by 1+ million students worldwide
Finance for managers
4
X = ΣXi/n Y= ΣYi/n Z=ΣZi/n
Standard
Deviation 9.27% 5.79% 1.74%
σx = √Σ(x-xi)2/(n-
1)
σy = √Σ(y-
yi)2/(n-1) σz = √Σ(z-zi)2/(n-1)
Q.2:
Date JB HI FI
Referen
ce Co.
(Bega
Cheese)
(X - Xi ) (Y - Yi )
Oct-17 3.600% 7.393%
Nov-17 0.413% 4.678%
Dec-17 2.120% 6.446%
Jan-18 13.687% 2.710%
Feb-18 11.792% 2.915%
Covariance
0.0028420
03
COV(x,y) =Σ(x-
xi)(y-yi)/(n-1)
Particulars JB HI FI
Referen
ce Co.
(Bega
Cheese)
Weightage 50% 50%
wx wy
Average Rate
of Return 3.513% 0.220%
rx ry
Variance 0.860% 0.335%
σ2x σ2y
Covariance 0.002842003
Cov(x,y)
Portfolio
Return 1.866700%
R= [(wx x rx)+(wy x
ry)]
Portfolio
Standard
Deviation 6.64%
Paraphrase This Document
Need a fresh take? Get an instant paraphrase of this document with our AI Paraphraser
Finance for managers
5
σ = √(wx2 x σ2x) + (wy2 x
σ2y) + [2wx x wy x
Cov(w,y)]
Q.c:
Particulars JB HI FI
Reference Co.
(Bega Cheese)
Beta A 0.48 -0.2
Market Risk
Premium B 6.60% 6.60%
Risk Free
Rate C 2.58% 2.58%
Expected
Return
D=C+
(AxB) 5.75% 1.26%
Q.d:
Particulars
Boral
Ltd. Reference Co.
Weightage A 50% 50%
w1 w2
Beta B 0.48 -0.20
Portfolio Beta β1 β2
Portfolio
Beta
βp=(w1xβ
1)+
(w2xβ2) 0.14
Market Risk
Premium B 6.60%
Risk Free
Rate C 2.58%
Portfolio
Expected
Return
D=C +
(βpxB) 3.50%
Finance for managers
6
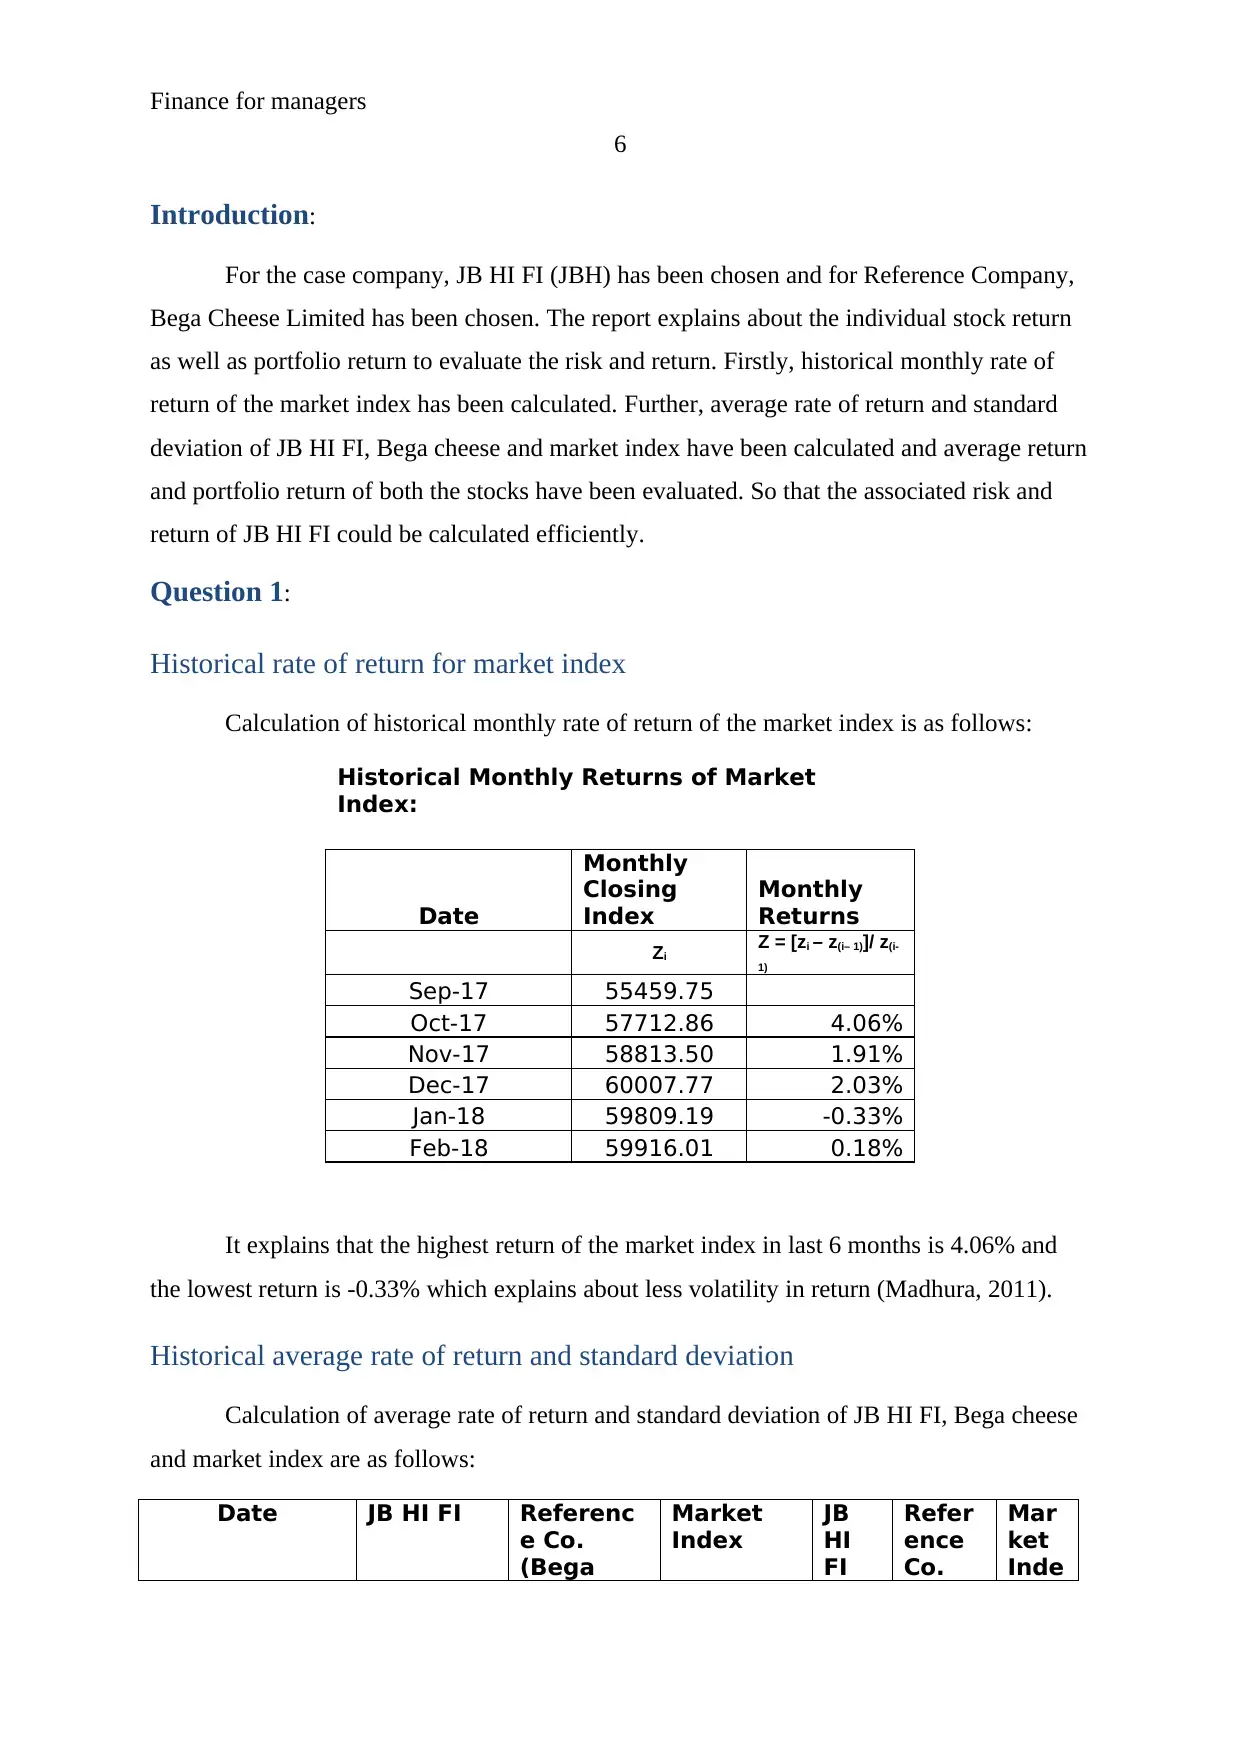
Introduction:
For the case company, JB HI FI (JBH) has been chosen and for Reference Company,
Bega Cheese Limited has been chosen. The report explains about the individual stock return
as well as portfolio return to evaluate the risk and return. Firstly, historical monthly rate of
return of the market index has been calculated. Further, average rate of return and standard
deviation of JB HI FI, Bega cheese and market index have been calculated and average return
and portfolio return of both the stocks have been evaluated. So that the associated risk and
return of JB HI FI could be calculated efficiently.
Question 1:
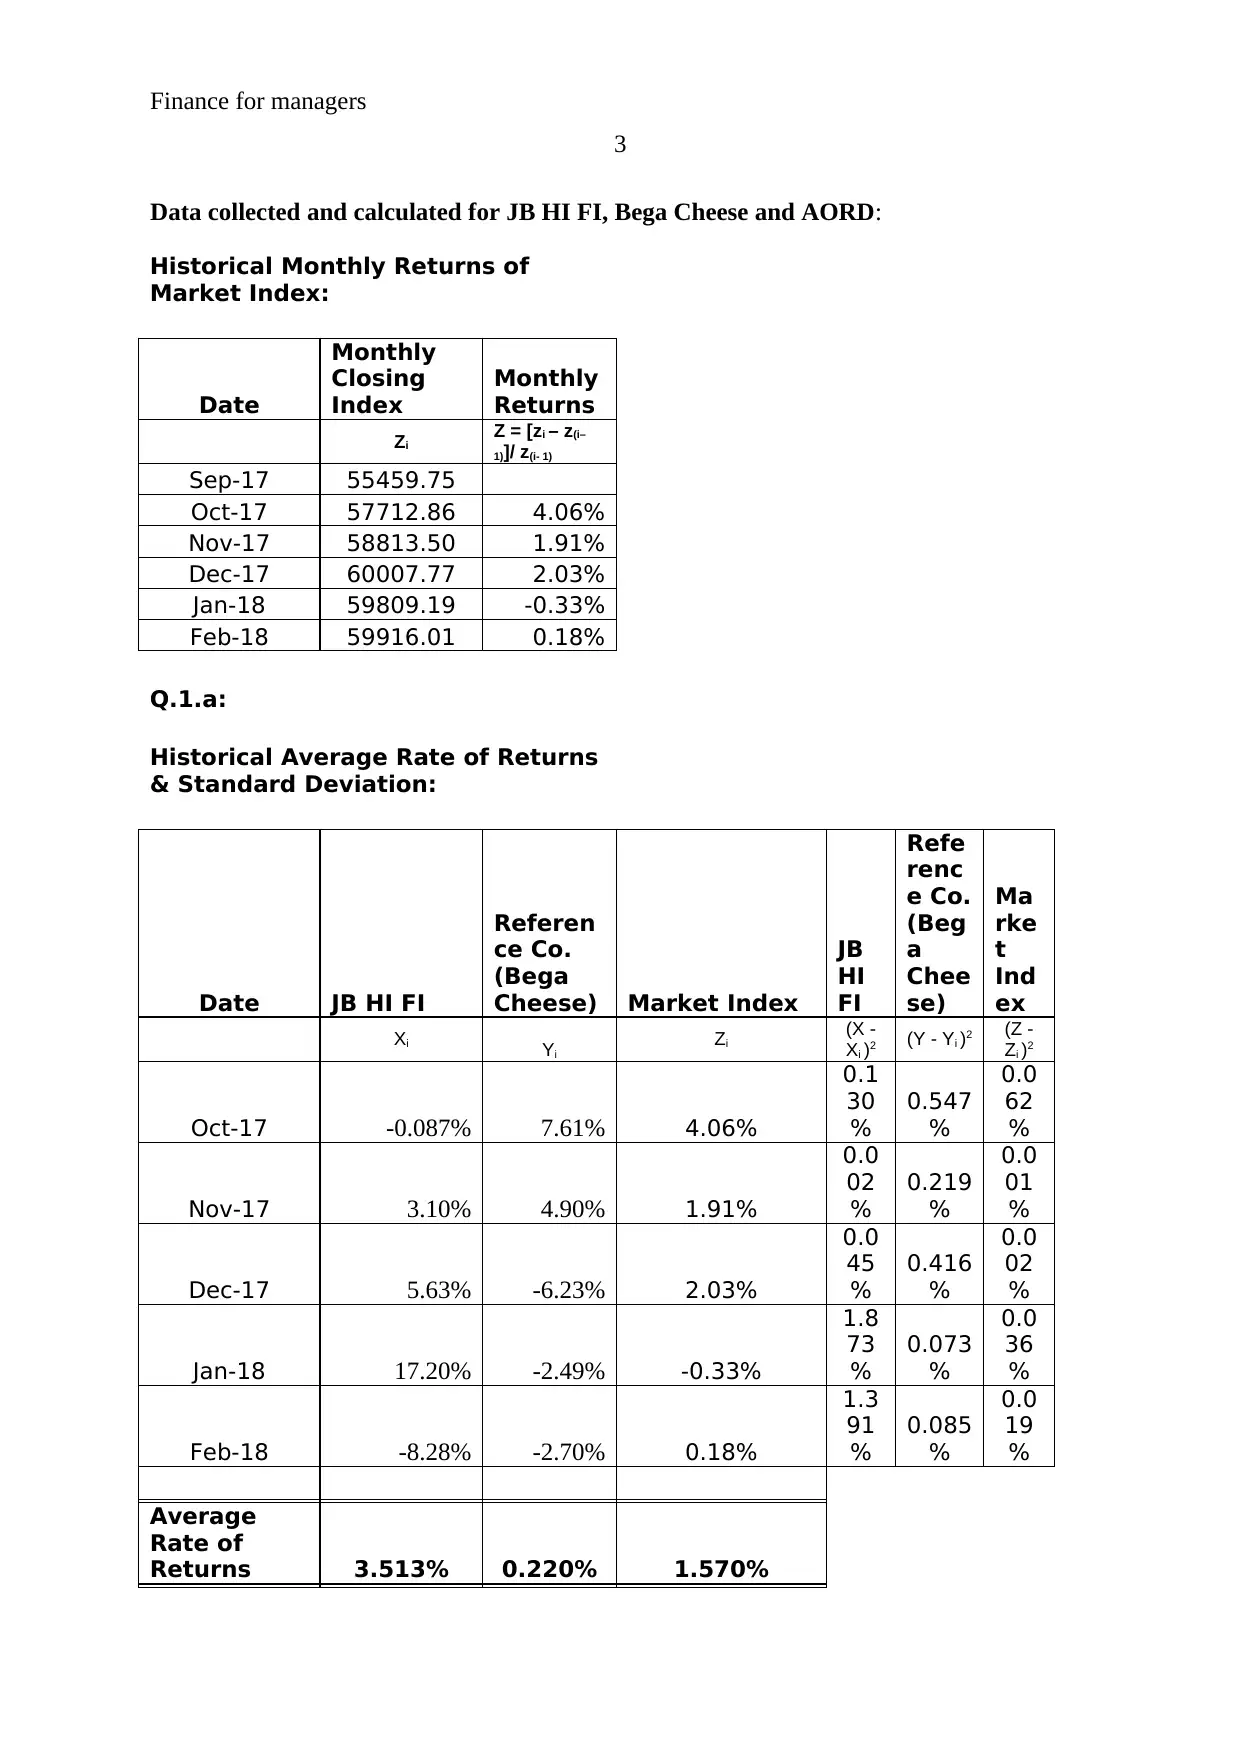
Historical rate of return for market index
Calculation of historical monthly rate of return of the market index is as follows:
Historical Monthly Returns of Market
Index:
Date
Monthly
Closing
Index
Monthly
Returns
Zi
Z = [zi – z(i– 1)]/ z(i-
1)
Sep-17 55459.75
Oct-17 57712.86 4.06%
Nov-17 58813.50 1.91%
Dec-17 60007.77 2.03%
Jan-18 59809.19 -0.33%
Feb-18 59916.01 0.18%
It explains that the highest return of the market index in last 6 months is 4.06% and
the lowest return is -0.33% which explains about less volatility in return (Madhura, 2011).
Historical average rate of return and standard deviation
Calculation of average rate of return and standard deviation of JB HI FI, Bega cheese
and market index are as follows:
Date JB HI FI Referenc
e Co.
(Bega
Market
Index
JB
HI
FI
Refer
ence
Co.
Mar
ket
Inde
6
Introduction:
For the case company, JB HI FI (JBH) has been chosen and for Reference Company,
Bega Cheese Limited has been chosen. The report explains about the individual stock return
as well as portfolio return to evaluate the risk and return. Firstly, historical monthly rate of
return of the market index has been calculated. Further, average rate of return and standard
deviation of JB HI FI, Bega cheese and market index have been calculated and average return
and portfolio return of both the stocks have been evaluated. So that the associated risk and
return of JB HI FI could be calculated efficiently.
Question 1:
Historical rate of return for market index
Calculation of historical monthly rate of return of the market index is as follows:
Historical Monthly Returns of Market
Index:
Date
Monthly
Closing
Index
Monthly
Returns
Zi
Z = [zi – z(i– 1)]/ z(i-
1)
Sep-17 55459.75
Oct-17 57712.86 4.06%
Nov-17 58813.50 1.91%
Dec-17 60007.77 2.03%
Jan-18 59809.19 -0.33%
Feb-18 59916.01 0.18%
It explains that the highest return of the market index in last 6 months is 4.06% and
the lowest return is -0.33% which explains about less volatility in return (Madhura, 2011).
Historical average rate of return and standard deviation
Calculation of average rate of return and standard deviation of JB HI FI, Bega cheese
and market index are as follows:
Date JB HI FI Referenc
e Co.
(Bega
Market
Index
JB
HI
FI
Refer
ence
Co.
Mar
ket
Inde
⊘ This is a preview!⊘
Do you want full access?
Subscribe today to unlock all pages.
Trusted by 1+ million students worldwide
Finance for managers
7
Cheese)
(Bega
Chees
e) x
Xi Yi
Zi
(X - Xi
)2 (Y - Yi )2 (Z - Zi
)2
Oct-17 -0.087% 7.61% 4.06%
0.13
0%
0.547
%
0.06
2%
Nov-17 3.10% 4.90% 1.91%
0.00
2%
0.219
%
0.00
1%
Dec-17 5.63% -6.23% 2.03%
0.04
5%
0.416
%
0.00
2%
Jan-18 17.20% -2.49% -0.33%
1.87
3%
0.073
%
0.03
6%
Feb-18 -8.28% -2.70% 0.18%
1.39
1%
0.085
%
0.01
9%
Average Rate
of Returns 3.513% 0.220% 1.570%
X = ΣXi/n Y= ΣYi/n Z=ΣZi/n
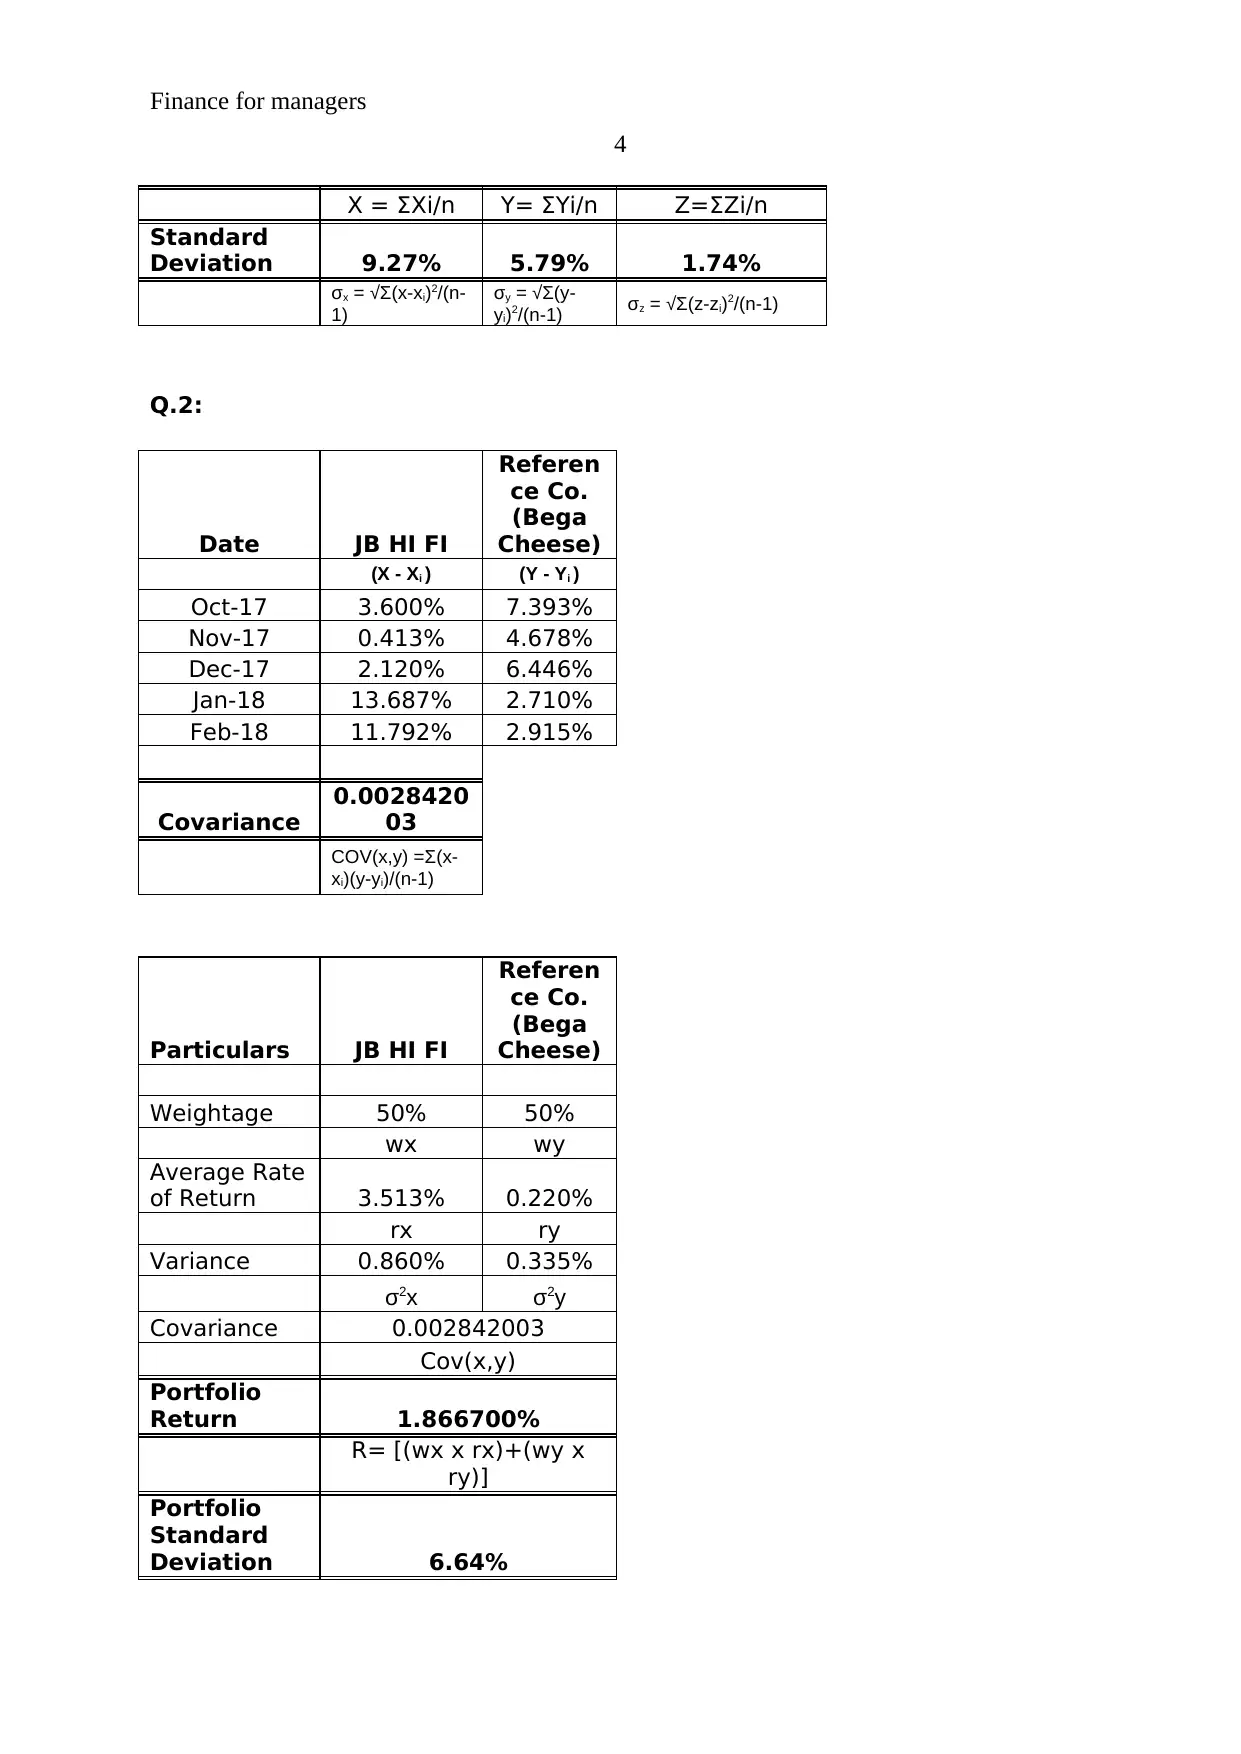
Standard
Deviation 9.27% 5.79% 1.74%
σx = √Σ(x-
xi)2/(n-1)
σy = √Σ(y-
yi)2/(n-1)
σz = √Σ(z-
zi)2/(n-1)
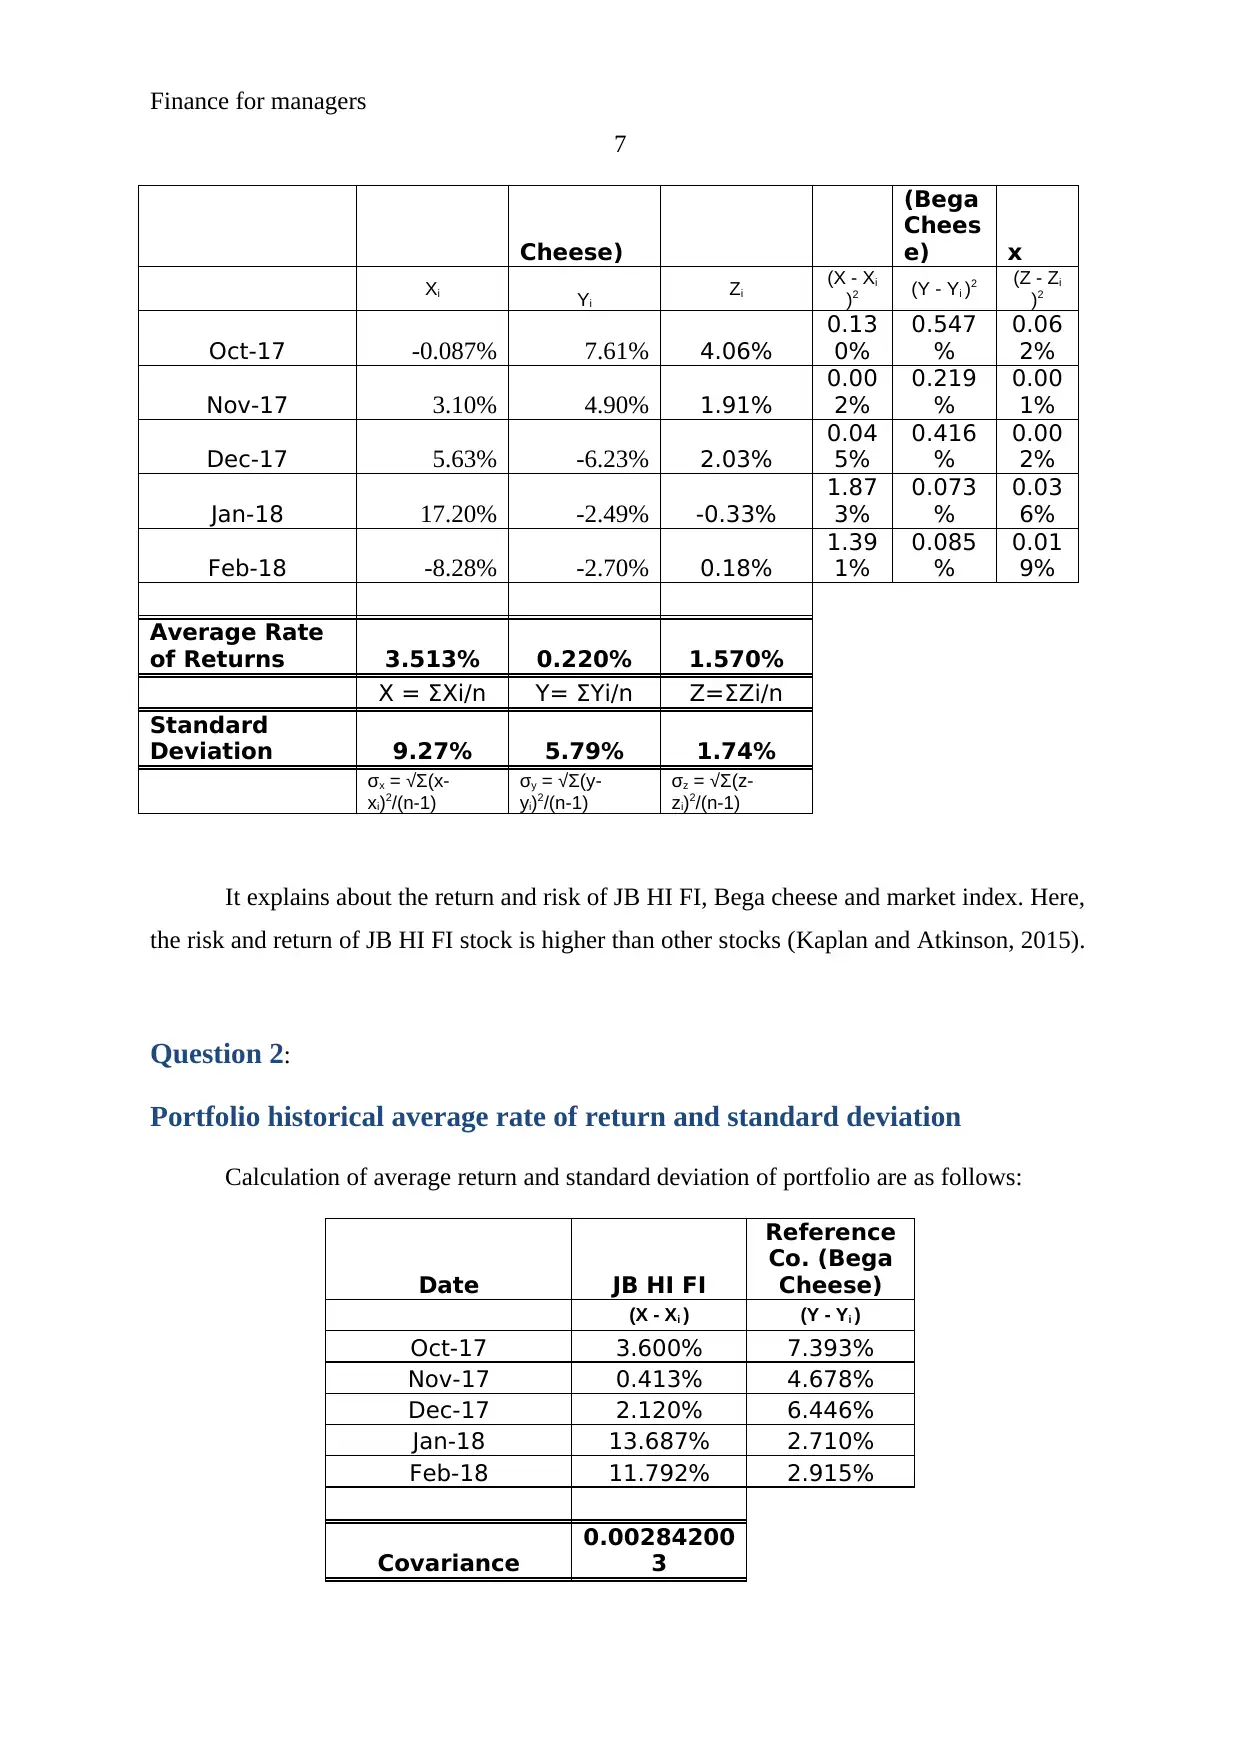
It explains about the return and risk of JB HI FI, Bega cheese and market index. Here,
the risk and return of JB HI FI stock is higher than other stocks (Kaplan and Atkinson, 2015).
Question 2:
Portfolio historical average rate of return and standard deviation
Calculation of average return and standard deviation of portfolio are as follows:
Date JB HI FI
Reference
Co. (Bega
Cheese)
(X - Xi ) (Y - Yi )
Oct-17 3.600% 7.393%
Nov-17 0.413% 4.678%
Dec-17 2.120% 6.446%
Jan-18 13.687% 2.710%
Feb-18 11.792% 2.915%
Covariance
0.00284200
3
7
Cheese)
(Bega
Chees
e) x
Xi Yi
Zi
(X - Xi
)2 (Y - Yi )2 (Z - Zi
)2
Oct-17 -0.087% 7.61% 4.06%
0.13
0%
0.547
%
0.06
2%
Nov-17 3.10% 4.90% 1.91%
0.00
2%
0.219
%
0.00
1%
Dec-17 5.63% -6.23% 2.03%
0.04
5%
0.416
%
0.00
2%
Jan-18 17.20% -2.49% -0.33%
1.87
3%
0.073
%
0.03
6%
Feb-18 -8.28% -2.70% 0.18%
1.39
1%
0.085
%
0.01
9%
Average Rate
of Returns 3.513% 0.220% 1.570%
X = ΣXi/n Y= ΣYi/n Z=ΣZi/n
Standard
Deviation 9.27% 5.79% 1.74%
σx = √Σ(x-
xi)2/(n-1)
σy = √Σ(y-
yi)2/(n-1)
σz = √Σ(z-
zi)2/(n-1)
It explains about the return and risk of JB HI FI, Bega cheese and market index. Here,
the risk and return of JB HI FI stock is higher than other stocks (Kaplan and Atkinson, 2015).
Question 2:
Portfolio historical average rate of return and standard deviation
Calculation of average return and standard deviation of portfolio are as follows:
Date JB HI FI
Reference
Co. (Bega
Cheese)
(X - Xi ) (Y - Yi )
Oct-17 3.600% 7.393%
Nov-17 0.413% 4.678%
Dec-17 2.120% 6.446%
Jan-18 13.687% 2.710%
Feb-18 11.792% 2.915%
Covariance
0.00284200
3
Paraphrase This Document
Need a fresh take? Get an instant paraphrase of this document with our AI Paraphraser
Finance for managers
8
COV(x,y) =Σ(x-xi)
(y-yi)/(n-1)
Particulars JB HI FI
Reference
Co. (Bega
Cheese)
Weightage 50% 50%
wx wy
Average Rate of
Return 3.513% 0.220%
rx ry
Variance 0.860% 0.335%
σ2x σ2y
Covariance 0.002842003
Cov(x,y)
Portfolio Return 1.866700%
R= [(wx x rx)+(wy x ry)]
Portfolio
Standard
Deviation 6.64%
σ = √(wx2 x σ2x) + (wy2 x σ2y) +
[2wx x wy x Cov(w,y)]
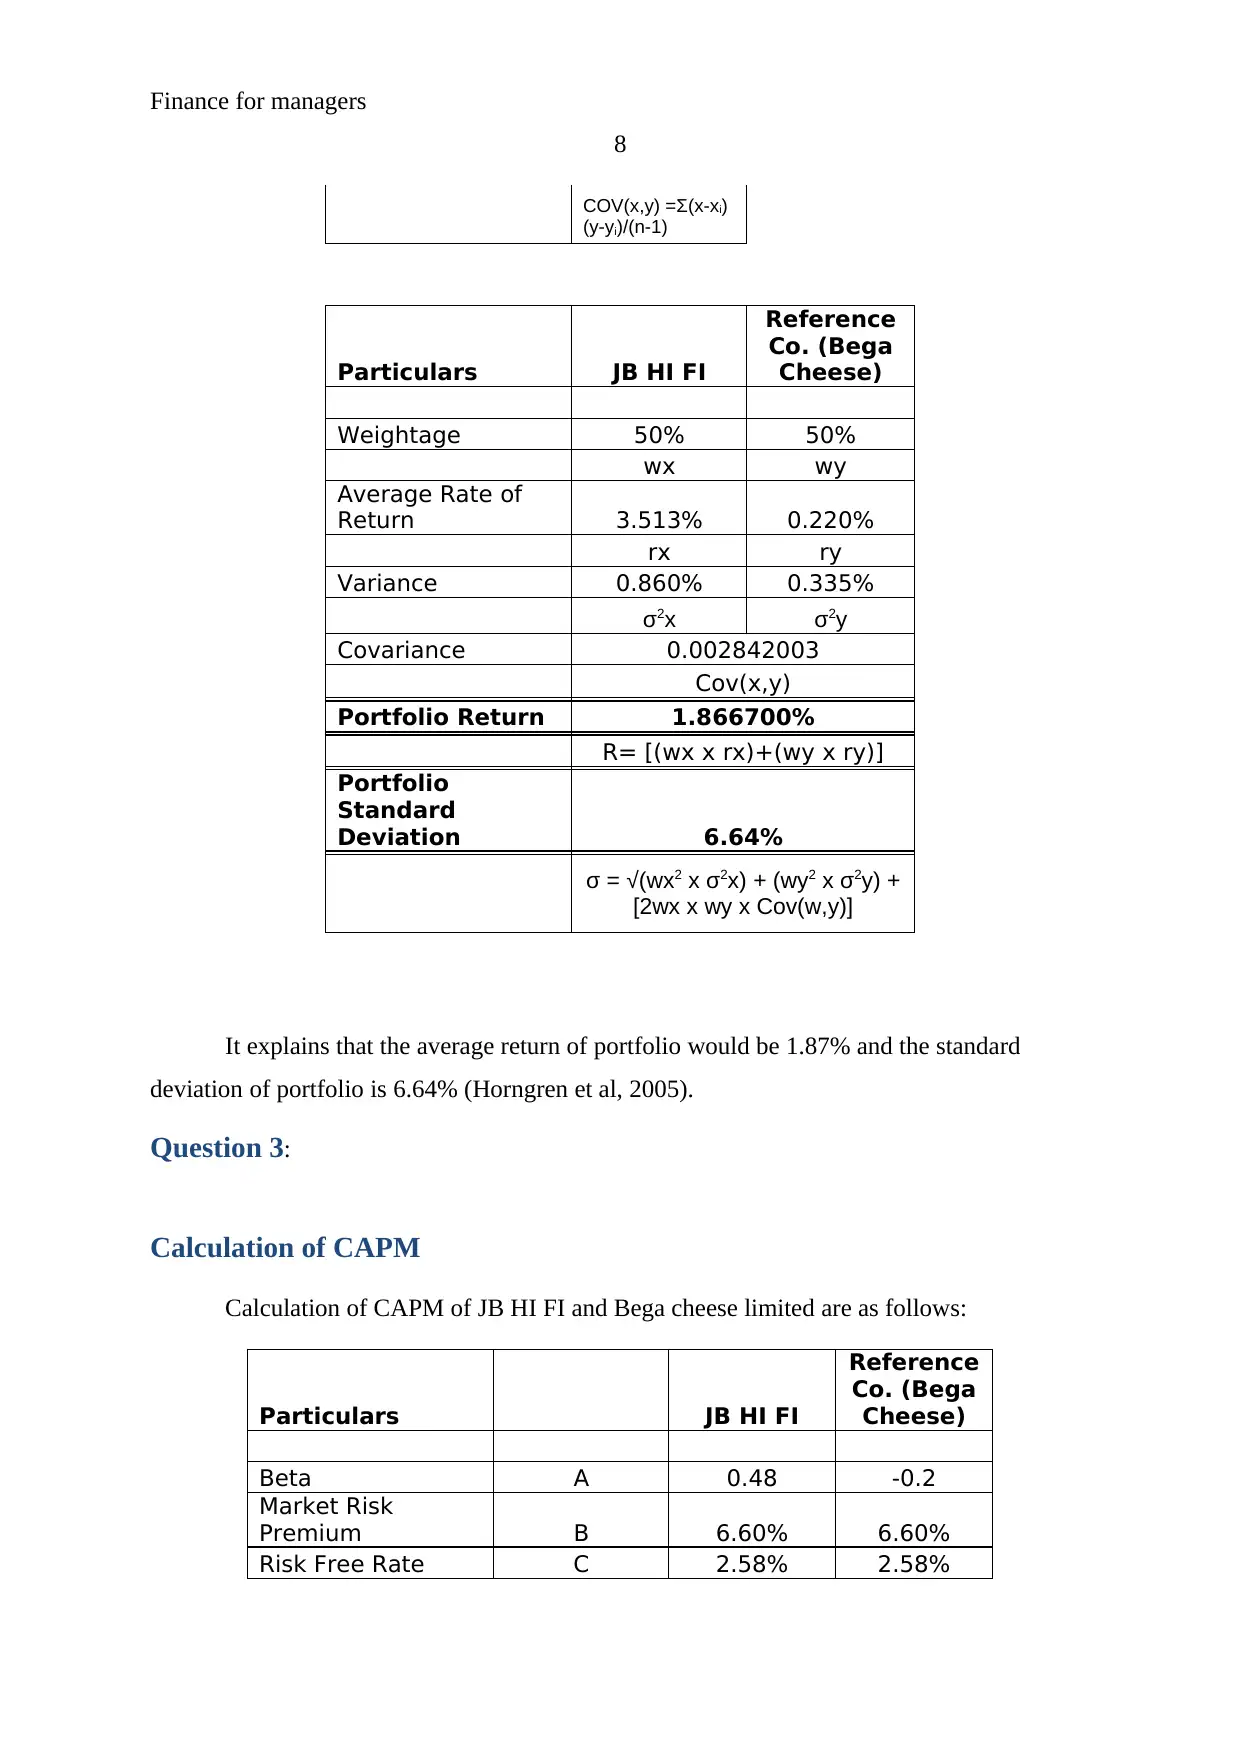
It explains that the average return of portfolio would be 1.87% and the standard
deviation of portfolio is 6.64% (Horngren et al, 2005).
Question 3:
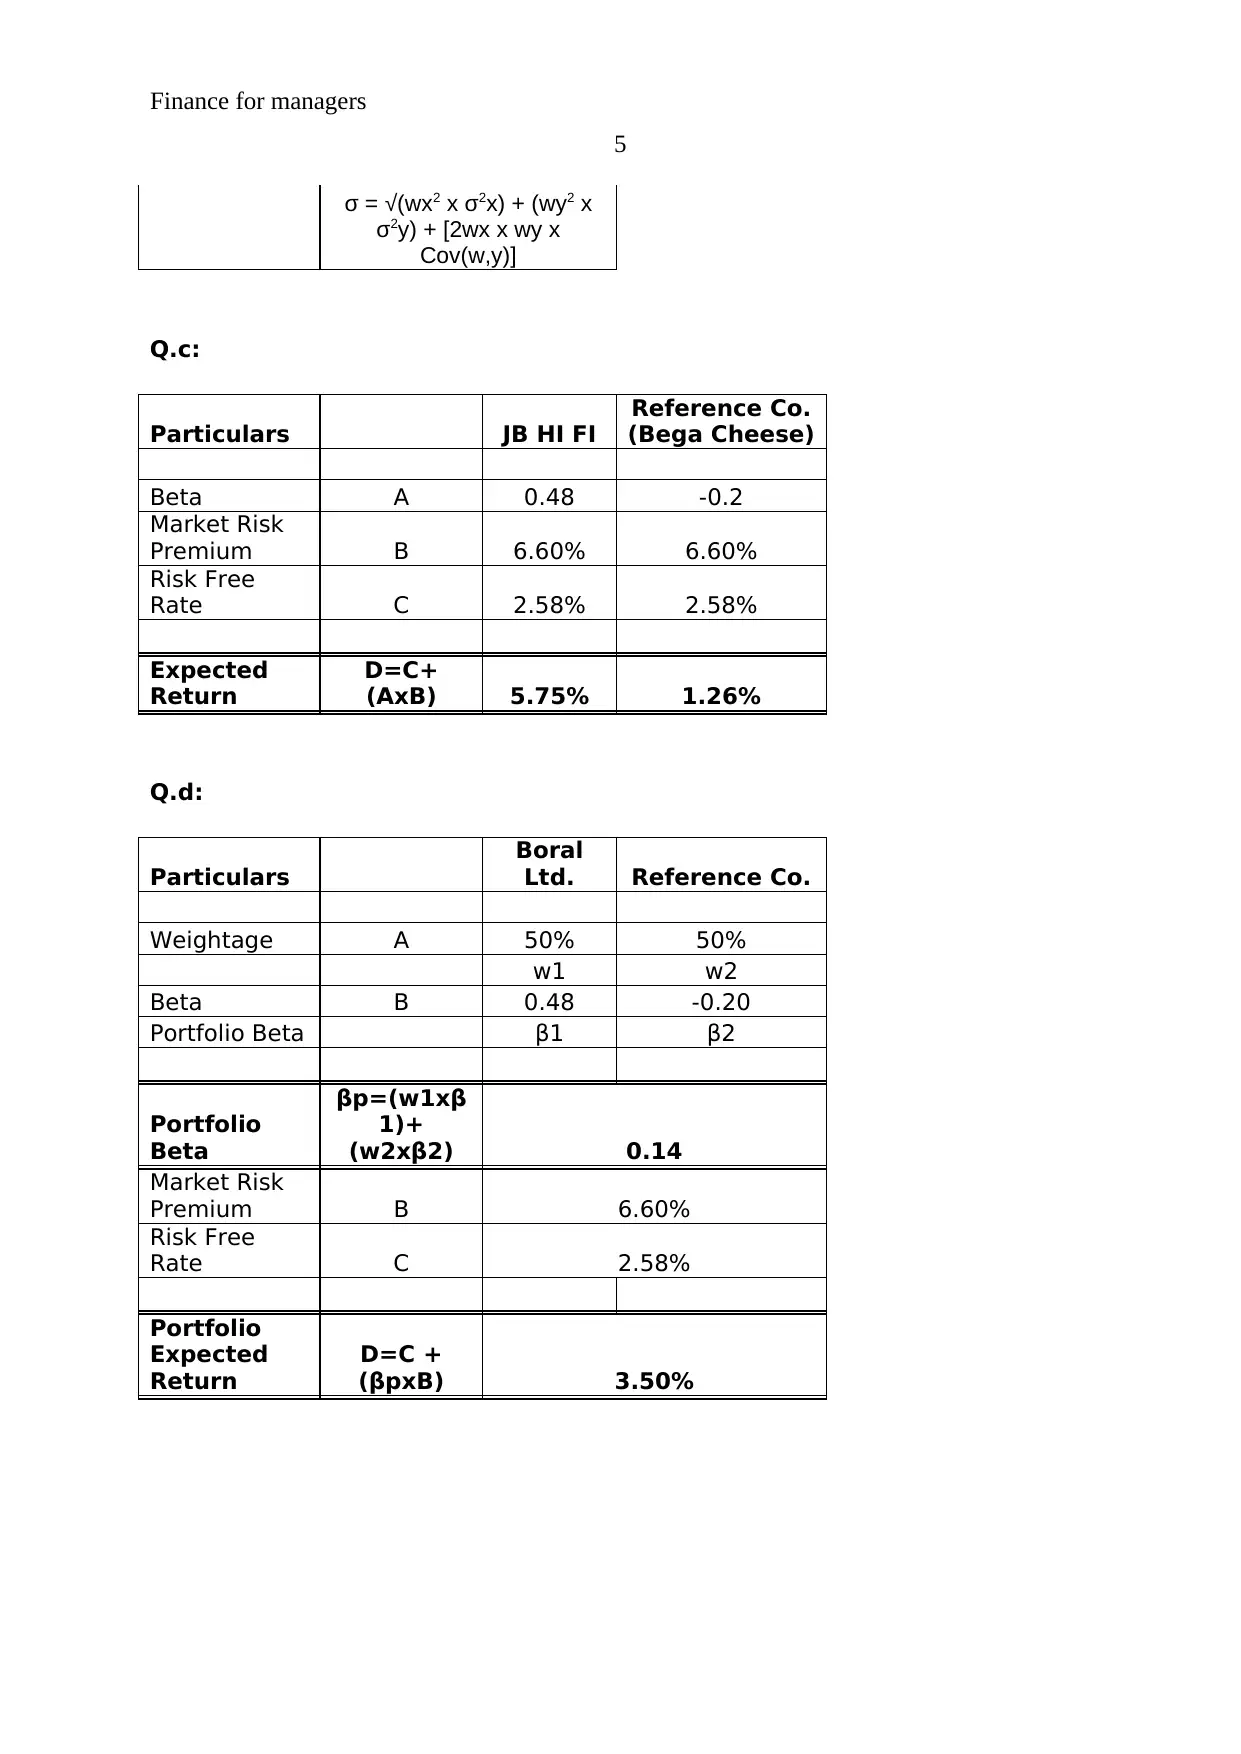
Calculation of CAPM
Calculation of CAPM of JB HI FI and Bega cheese limited are as follows:
Particulars JB HI FI
Reference
Co. (Bega
Cheese)
Beta A 0.48 -0.2
Market Risk
Premium B 6.60% 6.60%
Risk Free Rate C 2.58% 2.58%
8
COV(x,y) =Σ(x-xi)
(y-yi)/(n-1)
Particulars JB HI FI
Reference
Co. (Bega
Cheese)
Weightage 50% 50%
wx wy
Average Rate of
Return 3.513% 0.220%
rx ry
Variance 0.860% 0.335%
σ2x σ2y
Covariance 0.002842003
Cov(x,y)
Portfolio Return 1.866700%
R= [(wx x rx)+(wy x ry)]
Portfolio
Standard
Deviation 6.64%
σ = √(wx2 x σ2x) + (wy2 x σ2y) +
[2wx x wy x Cov(w,y)]
It explains that the average return of portfolio would be 1.87% and the standard
deviation of portfolio is 6.64% (Horngren et al, 2005).
Question 3:
Calculation of CAPM
Calculation of CAPM of JB HI FI and Bega cheese limited are as follows:
Particulars JB HI FI
Reference
Co. (Bega
Cheese)
Beta A 0.48 -0.2
Market Risk
Premium B 6.60% 6.60%
Risk Free Rate C 2.58% 2.58%
Finance for managers
9
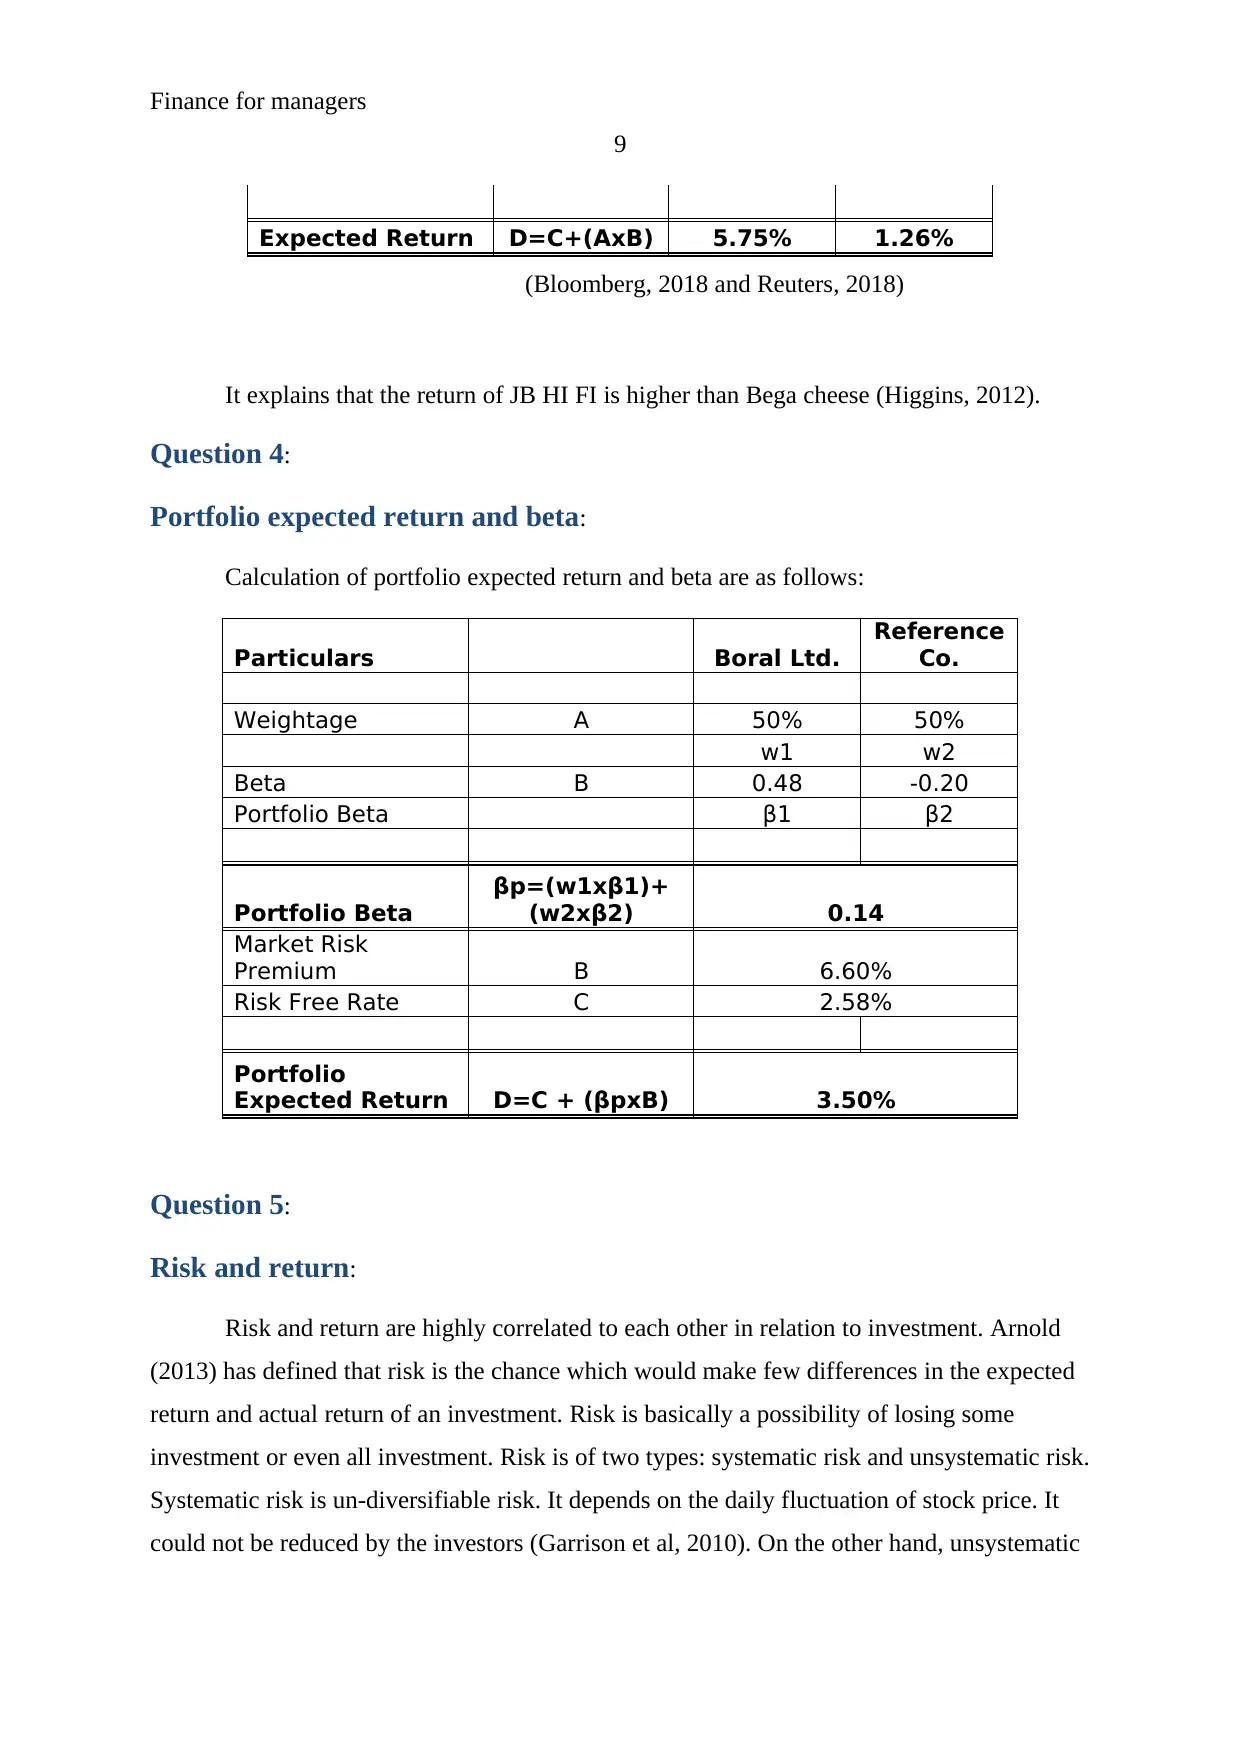
Expected Return D=C+(AxB) 5.75% 1.26%
(Bloomberg, 2018 and Reuters, 2018)
It explains that the return of JB HI FI is higher than Bega cheese (Higgins, 2012).
Question 4:
Portfolio expected return and beta:
Calculation of portfolio expected return and beta are as follows:
Particulars Boral Ltd.
Reference
Co.
Weightage A 50% 50%
w1 w2
Beta B 0.48 -0.20
Portfolio Beta β1 β2
Portfolio Beta
βp=(w1xβ1)+
(w2xβ2) 0.14
Market Risk
Premium B 6.60%
Risk Free Rate C 2.58%
Portfolio
Expected Return D=C + (βpxB) 3.50%
Question 5:
Risk and return:
Risk and return are highly correlated to each other in relation to investment. Arnold
(2013) has defined that risk is the chance which would make few differences in the expected
return and actual return of an investment. Risk is basically a possibility of losing some
investment or even all investment. Risk is of two types: systematic risk and unsystematic risk.
Systematic risk is un-diversifiable risk. It depends on the daily fluctuation of stock price. It
could not be reduced by the investors (Garrison et al, 2010). On the other hand, unsystematic
9
Expected Return D=C+(AxB) 5.75% 1.26%
(Bloomberg, 2018 and Reuters, 2018)
It explains that the return of JB HI FI is higher than Bega cheese (Higgins, 2012).
Question 4:
Portfolio expected return and beta:
Calculation of portfolio expected return and beta are as follows:
Particulars Boral Ltd.
Reference
Co.
Weightage A 50% 50%
w1 w2
Beta B 0.48 -0.20
Portfolio Beta β1 β2
Portfolio Beta
βp=(w1xβ1)+
(w2xβ2) 0.14
Market Risk
Premium B 6.60%
Risk Free Rate C 2.58%
Portfolio
Expected Return D=C + (βpxB) 3.50%
Question 5:
Risk and return:
Risk and return are highly correlated to each other in relation to investment. Arnold
(2013) has defined that risk is the chance which would make few differences in the expected
return and actual return of an investment. Risk is basically a possibility of losing some
investment or even all investment. Risk is of two types: systematic risk and unsystematic risk.
Systematic risk is un-diversifiable risk. It depends on the daily fluctuation of stock price. It
could not be reduced by the investors (Garrison et al, 2010). On the other hand, unsystematic
⊘ This is a preview!⊘
Do you want full access?
Subscribe today to unlock all pages.
Trusted by 1+ million students worldwide
Finance for managers
10
risk depends on the industry and market factors. It could be reduced by the investors through
diversify the investment.
At the same time, return of an investment is either gain or losses which have been
occurred due to investment and trading of a security. Several factors affect the return of a
security. Diversification strategy could help the company to manage and enhance the return
(Besley and Brigham, 2008). The given case of JB HI FI explains that the average monthly
return of the stock is 3.513% whereas the monthly return of market index is 1.57% which
explains that the JBH stock is offering more gain to the investors. A security which offers
gain to the investors is best security in relation to the investment. On the other hand, as a
measurement of risk, standard deviation of JB HI FI stock has been calculated. Standard
deviation of JB HI Stock is 9.27% whereas the risk of market index is 1.74% which explains
that the return of the company is less volatile. It explains that the risk of the company is
lower.
Though, the risk and return of the company has been compared with the market index
and Bega cheese to evaluate the stock performance and risk and return level of the company
in relation with market (Baker and Nofsinger, 2010). The calculation of market index depicts
that the market return is 1.57% whereas standard deviation of the market index is 1.74%
which explains about lesser volatility in the market returns. Stock volatility is the main
measure to identify the stock performance. More volatility of a stock represents about riskier
position of the company. The comparison calculations among market index and JB HI FI
explain that the stock of JB HI FI is riskier than market but at the same time, return is also
higher of JB HI FI. On the other hand, the calculation of Bega cheese depicts that the market
return is 0.22% whereas standard deviation of the stock is 5.79% which explains about lesser
volatility in the market returns in comparison with JB HI FI. The comparison calculations of
Bega cheese and JB HI FI explain that the JB HI FI Stock’s risk and return is higher. It
explains that the risk and return is directly connected to each other. The more the return of a
stock would be, the more the associated risk would be (Deegan, 2013).
According to the above analysis, it has been concluded that the risk of JB HI FI is
quite higher in the market but at the same time, return of the stock is also higher. Ackert and
Deaves, (2009) has explained into his study that returns and risk have positive relation with
each other. With the increment in the one, other factor automatically enhances. Though, it has
been argued by Brown, Beekes and Verhoeven, (2011) that risk and return of an organization
Paraphrase This Document
Need a fresh take? Get an instant paraphrase of this document with our AI Paraphraser
Finance for managers
11
are different to each other. If the stock price of a company is increasing than the return of the
organization would be higher and the risk of the stock would be lower. Further, it explains
that the required rate of return of JB HI FI is 5.75% which explains that if an investor invests
into the stock of JB HI FI than the company would pay 5.75% dividend to the stockholders.
On the other hand, it has been evaluated that the required rate of return of Bega
cheese is 1.26%. It explains that the return of JB HI FI is quite higher than the return of Bega
Cheese. Further, it has been found that the betas of both the stock are 0.48 and -0.2 which
explains that the risk of JB HI FI stock is higher (Reuters, 2018). It explains that the market
return as well as required rate of return of JB HI FI is higher than the Bega cheese and market
index (Besley and Brigham, 2008). It expresses that if an investor would invest into the stock
of JB HI FI than the investor and trader both would be able to get higher return from the
stock as the monthly return as well as dividend return of the company is higher than the other
companies in the market and market index. But, on the other hand, the associated risk would
also be higher as the stock price of the company is changing rapidly.
Diversification is a risk management technique which combines the numerous
investments within a portfolio. Diversification technique reduces the event of unsystematic
risk (Higgins, 2012). Further, it has also been evaluated that if the diversification strategy is
adopted by the investor to reduce the risk and balance the return than the return of the
portfolio would be 3.50% and in that case, the associated risk would also be 0.14. It explains
that if the investor would invest into a portfolio of JB HI FI and Bega cheese with 50% and
50% weight than the return of the portfolio would be lesser in comparison of JB HI FI stock
but at the same time, the risk would also be lower. So it is better option for the inventors to
invest into the portfolio of JB HI FI and Bega Cheese rather than investing into a single
security.
Conclusion:
To conclude, risk and return are financial factors which are directly and positively
connected to each other. The comparison calculations among Bega cheese and JB HI FI
explain that the return and risk, both is higher of JB HI FI Stock. Further, it explains that if
the investor would invest into the portfolio than the risk for the investor would be reduced
and balanced return would be got by the investors. So it is better option for the inventors to

Finance for managers
12
invest into the portfolio of JB HI FI and Bega Cheese rather than investing into a single
security.
12
invest into the portfolio of JB HI FI and Bega Cheese rather than investing into a single
security.
⊘ This is a preview!⊘
Do you want full access?
Subscribe today to unlock all pages.
Trusted by 1+ million students worldwide
1 out of 13

Your All-in-One AI-Powered Toolkit for Academic Success.
+13062052269
info@desklib.com
Available 24*7 on WhatsApp / Email
![[object Object]](/_next/static/media/star-bottom.7253800d.svg)
Unlock your academic potential
Copyright © 2020–2026 A2Z Services. All Rights Reserved. Developed and managed by ZUCOL.