Finance 14 Assignment: Regression Analysis of Olympic Data

Verified

Added on  2022/10/15

|15
|1659
|11
Report
AI Summary
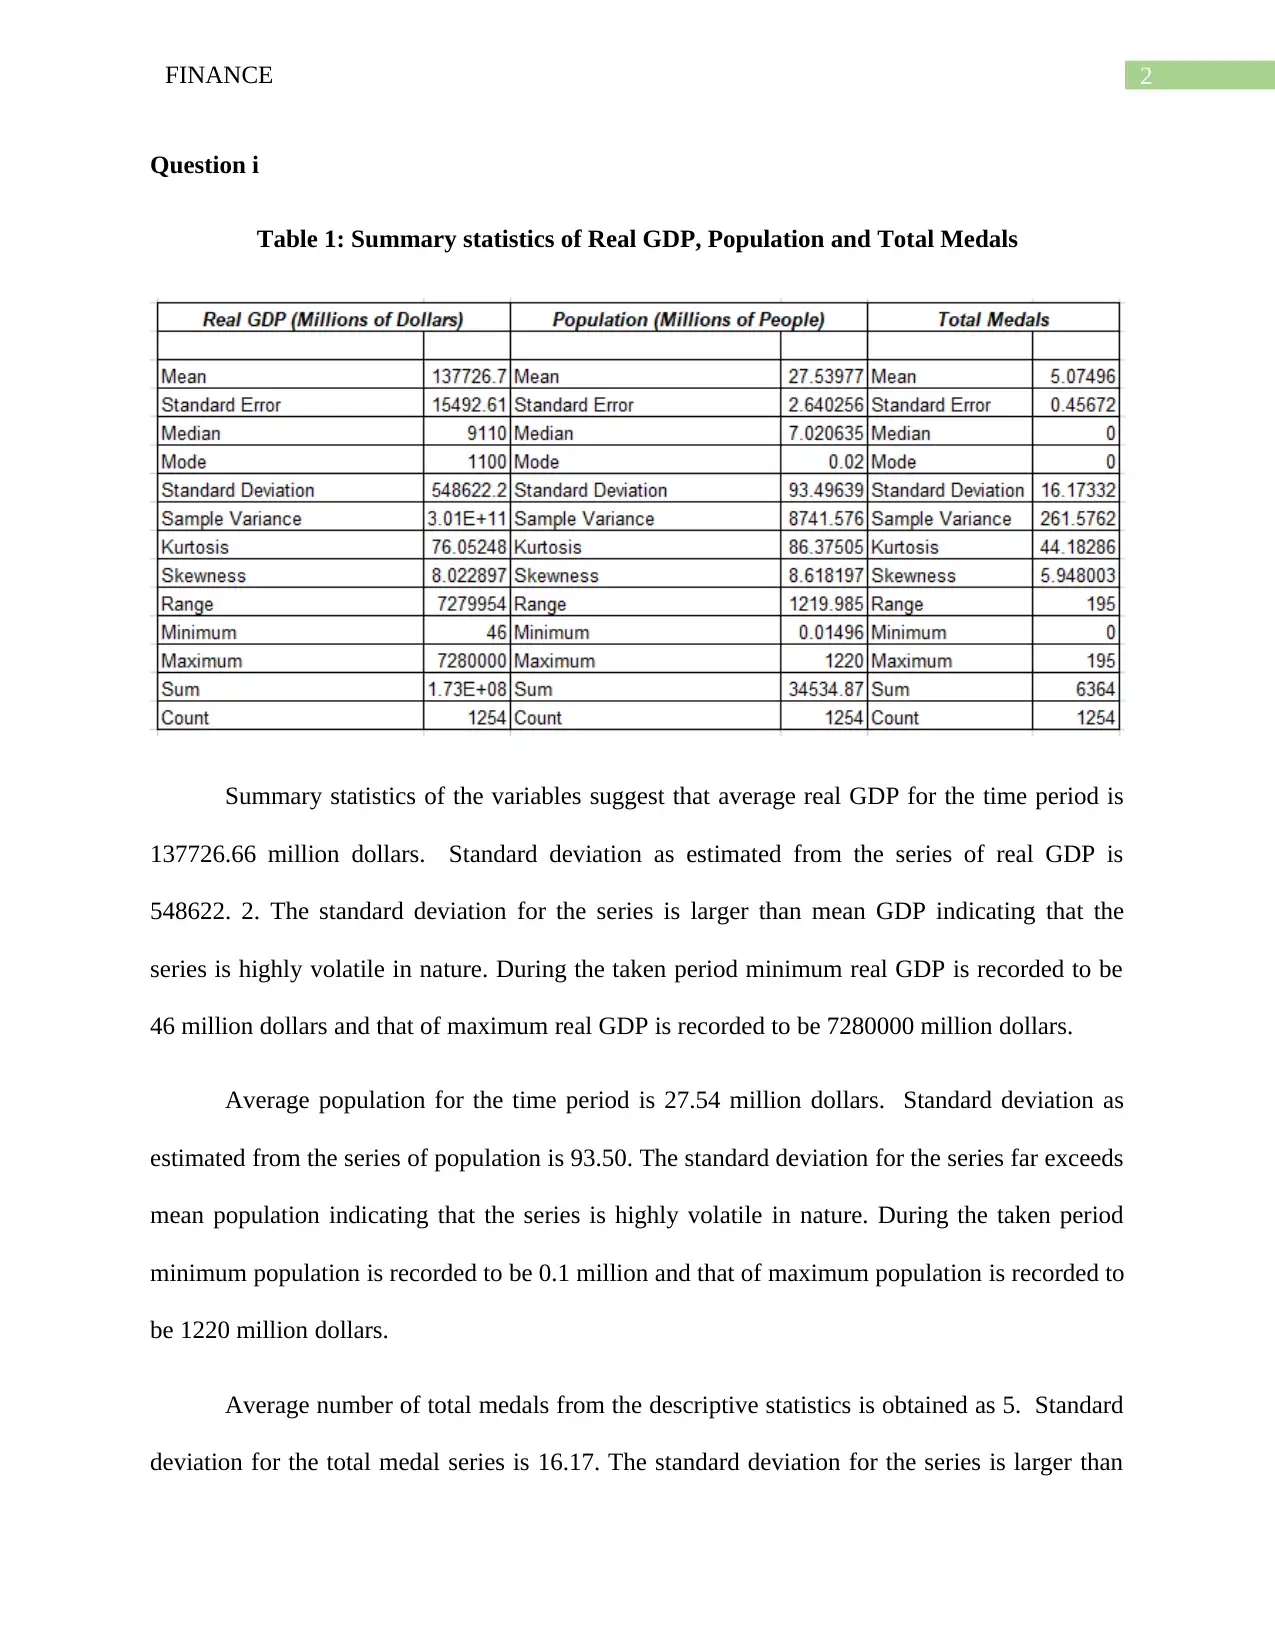
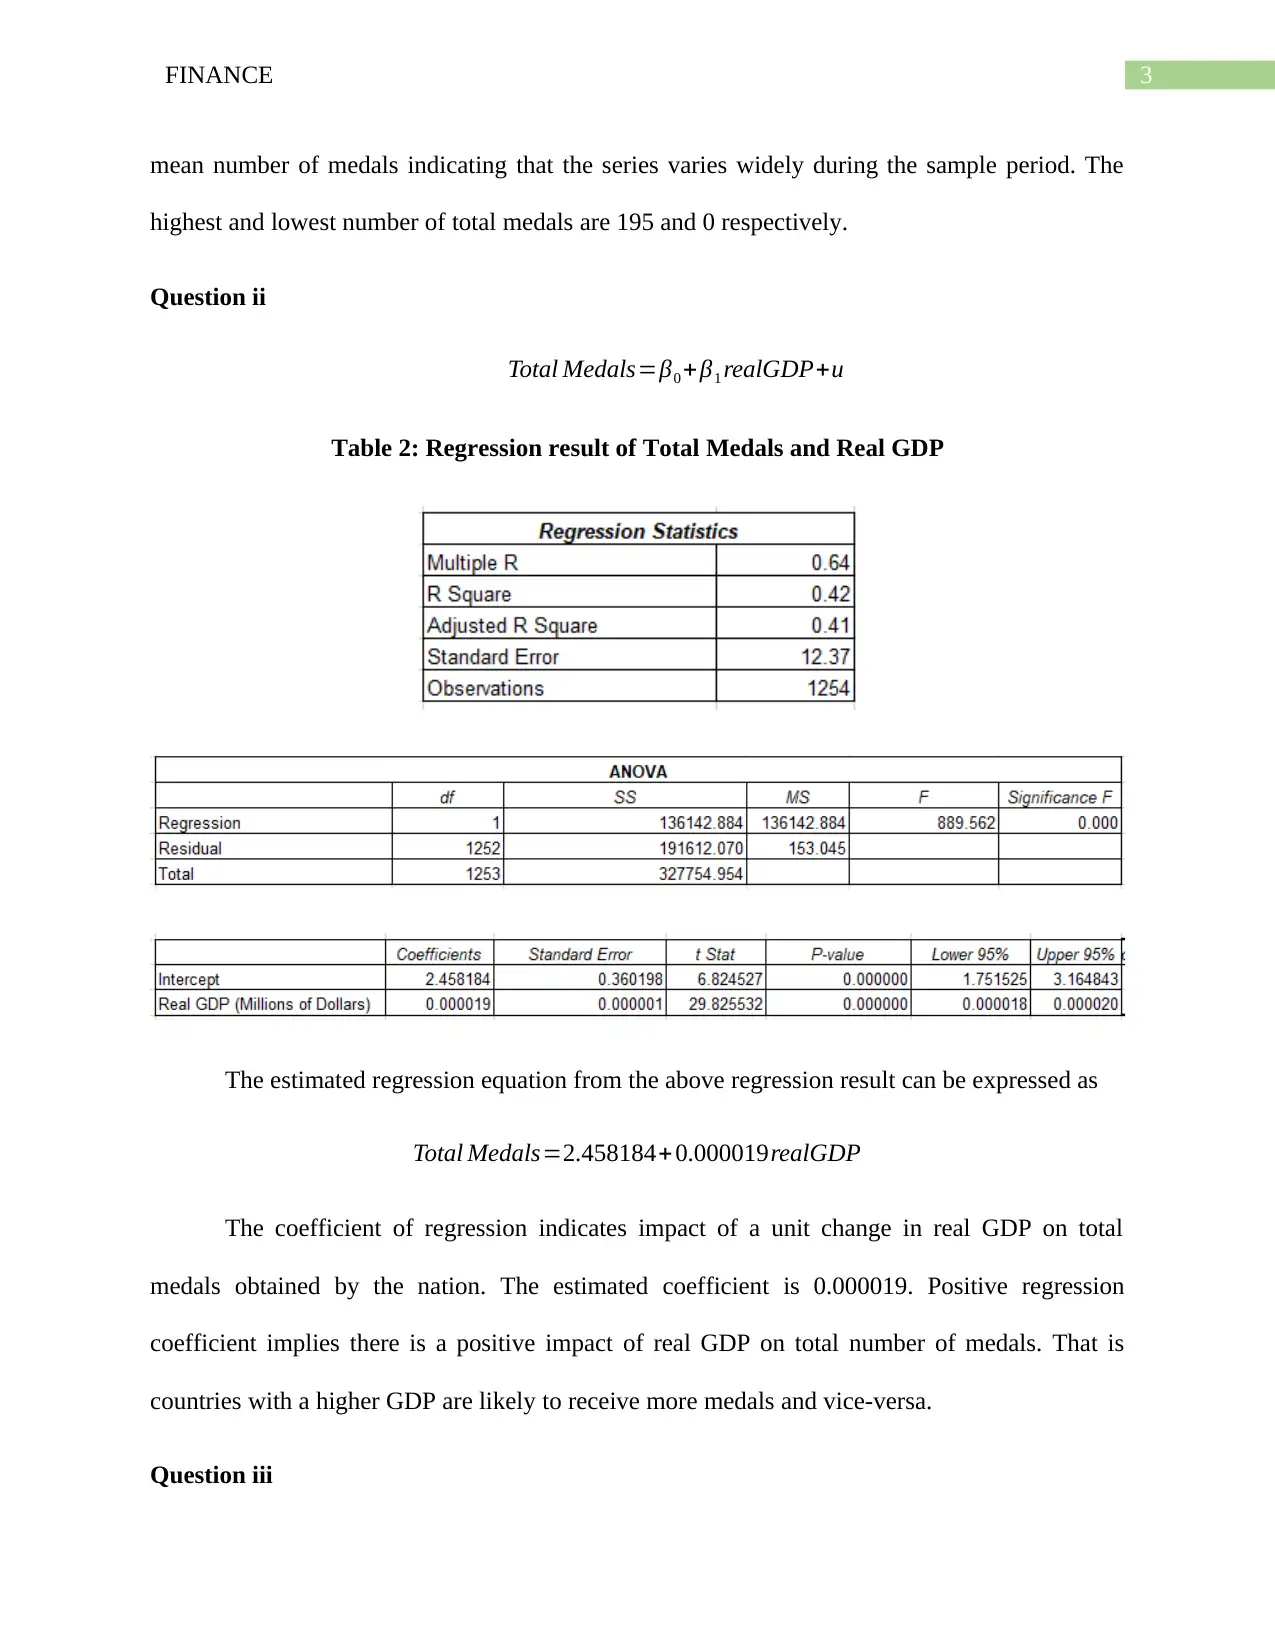
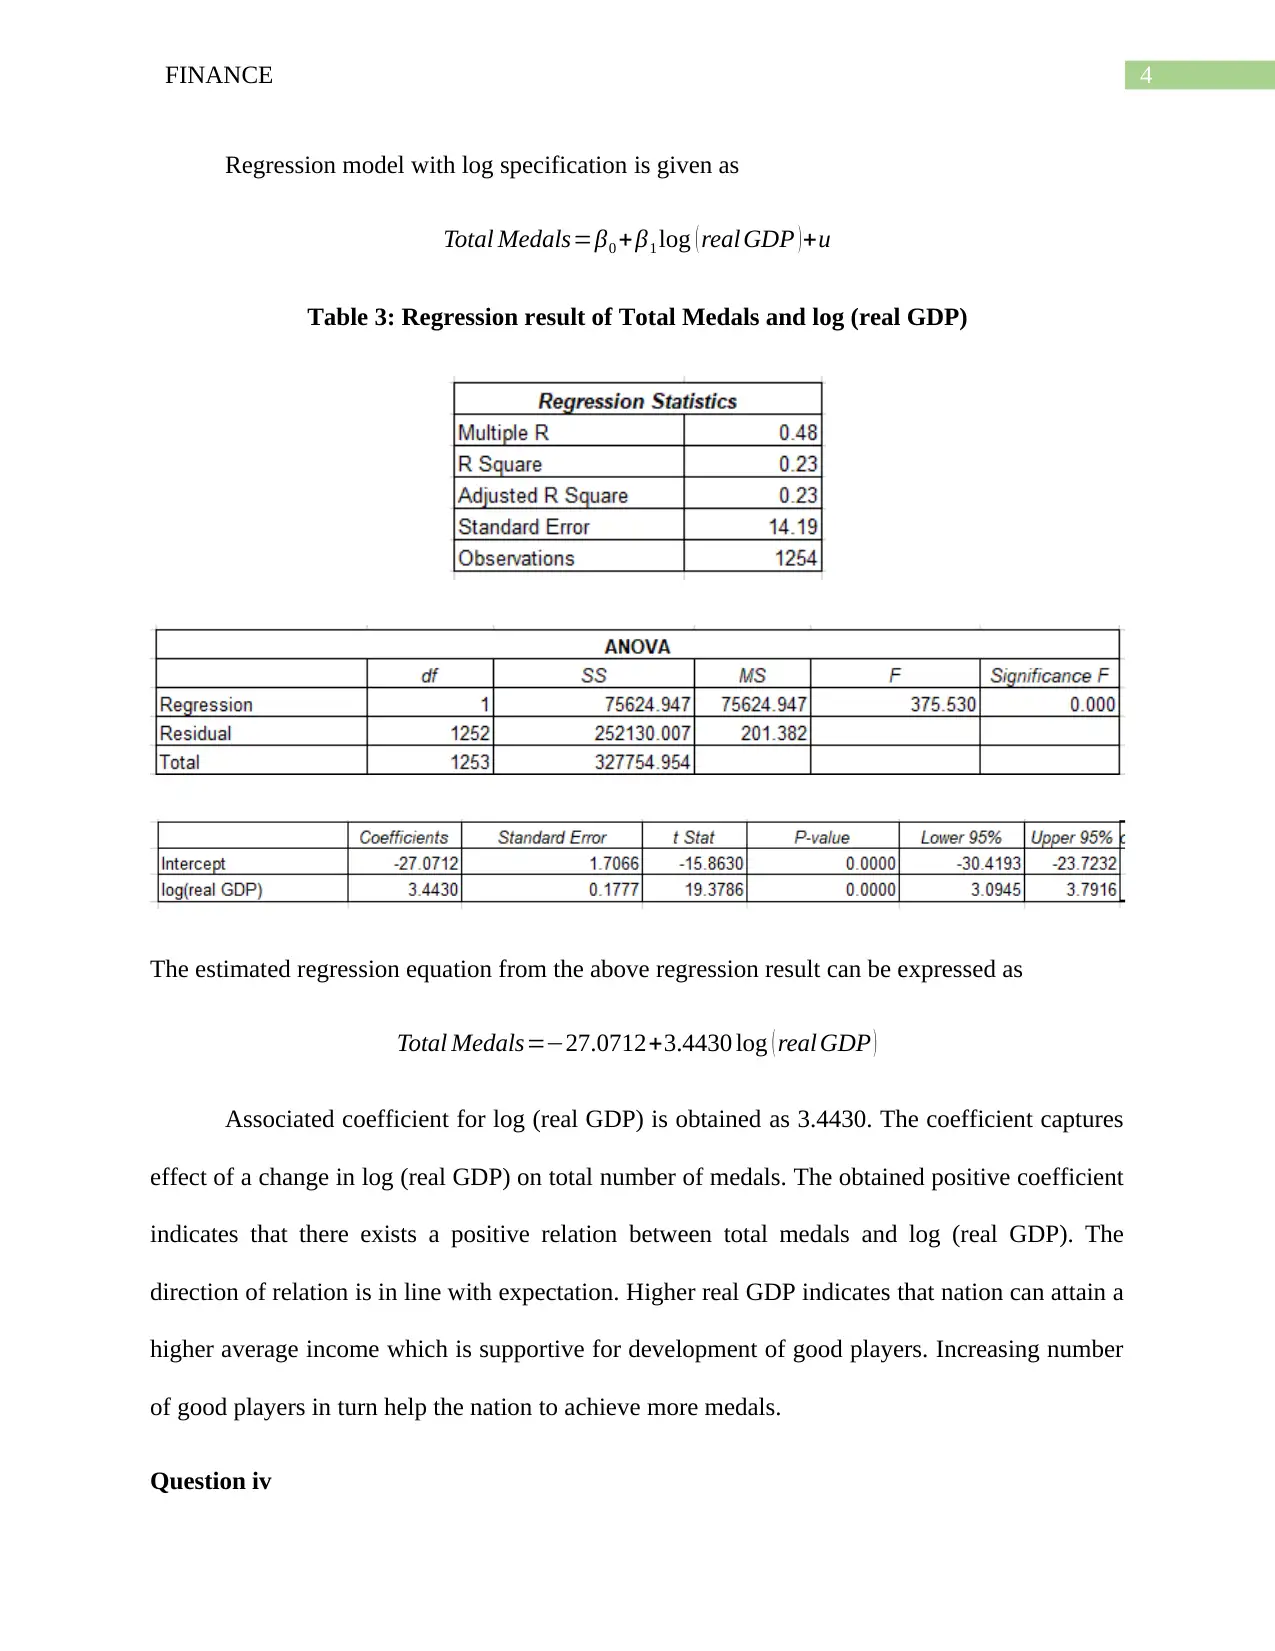
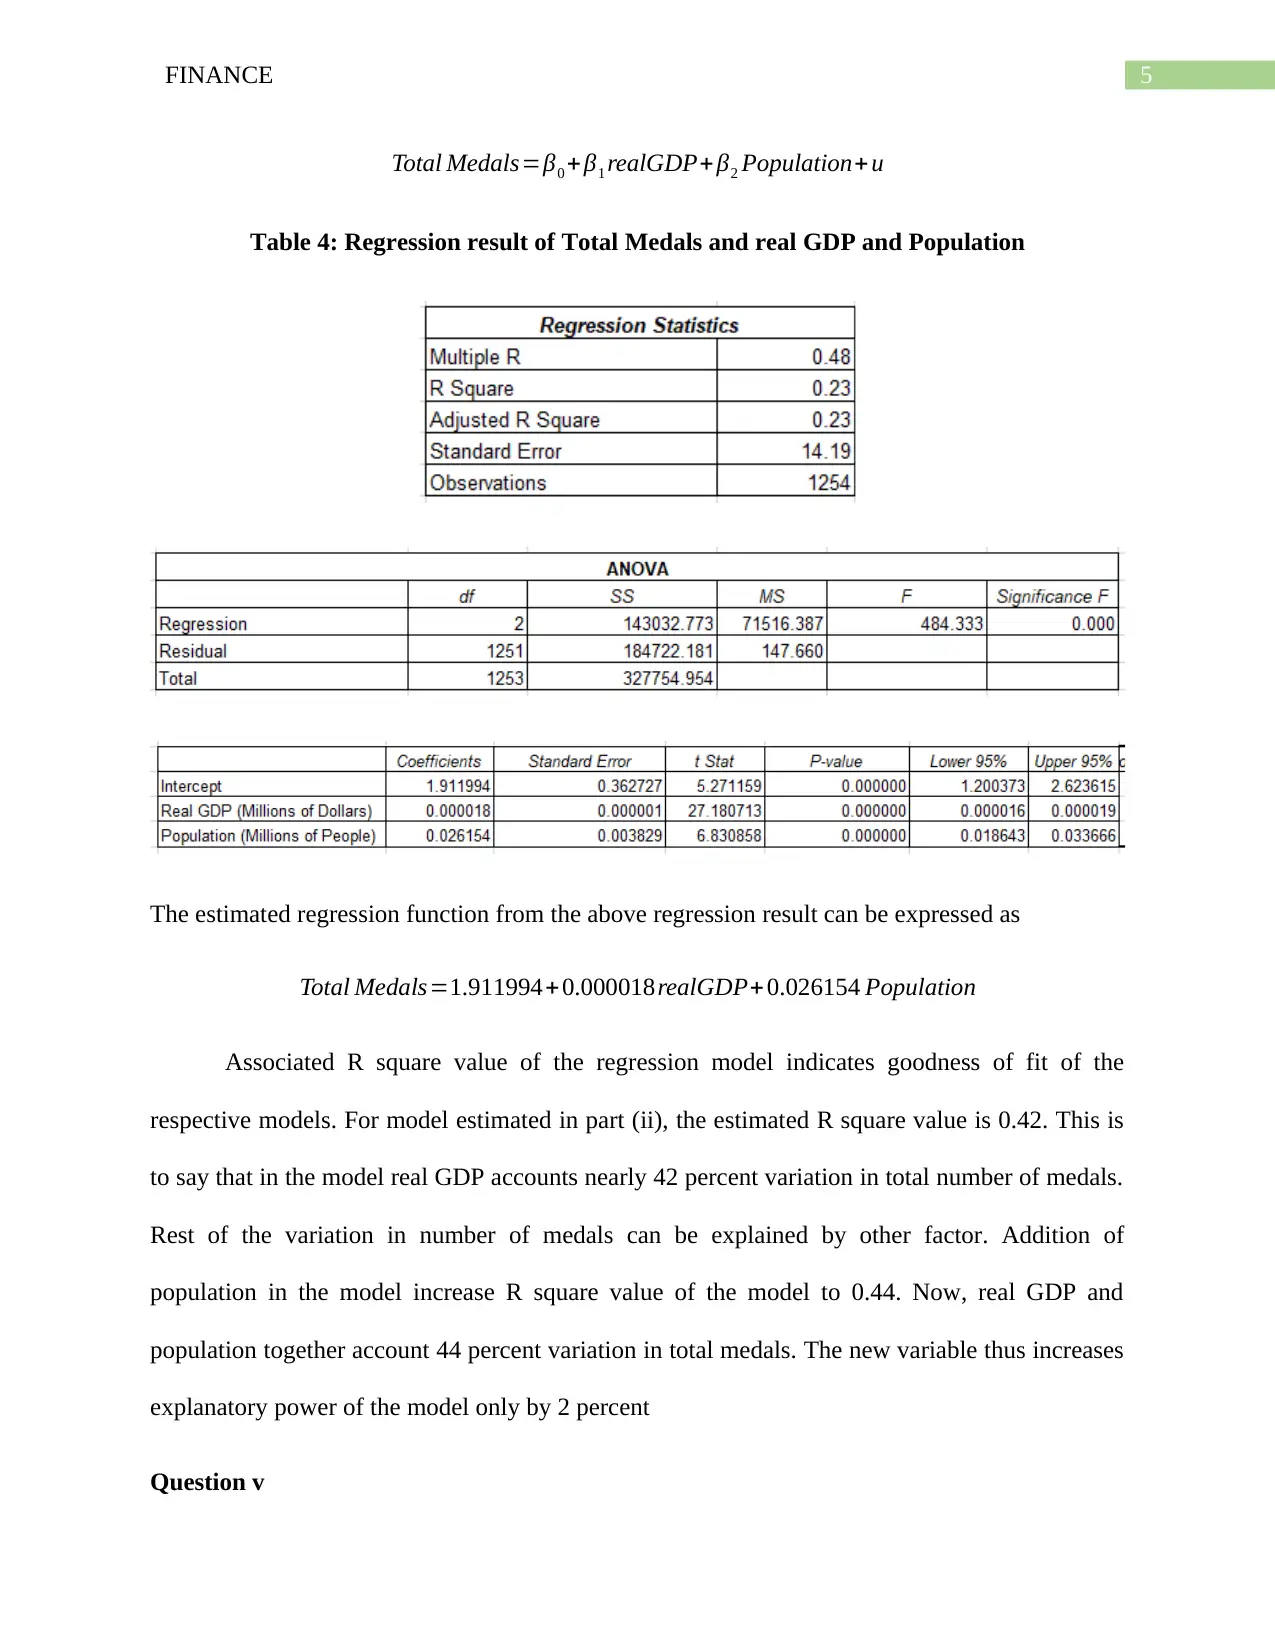
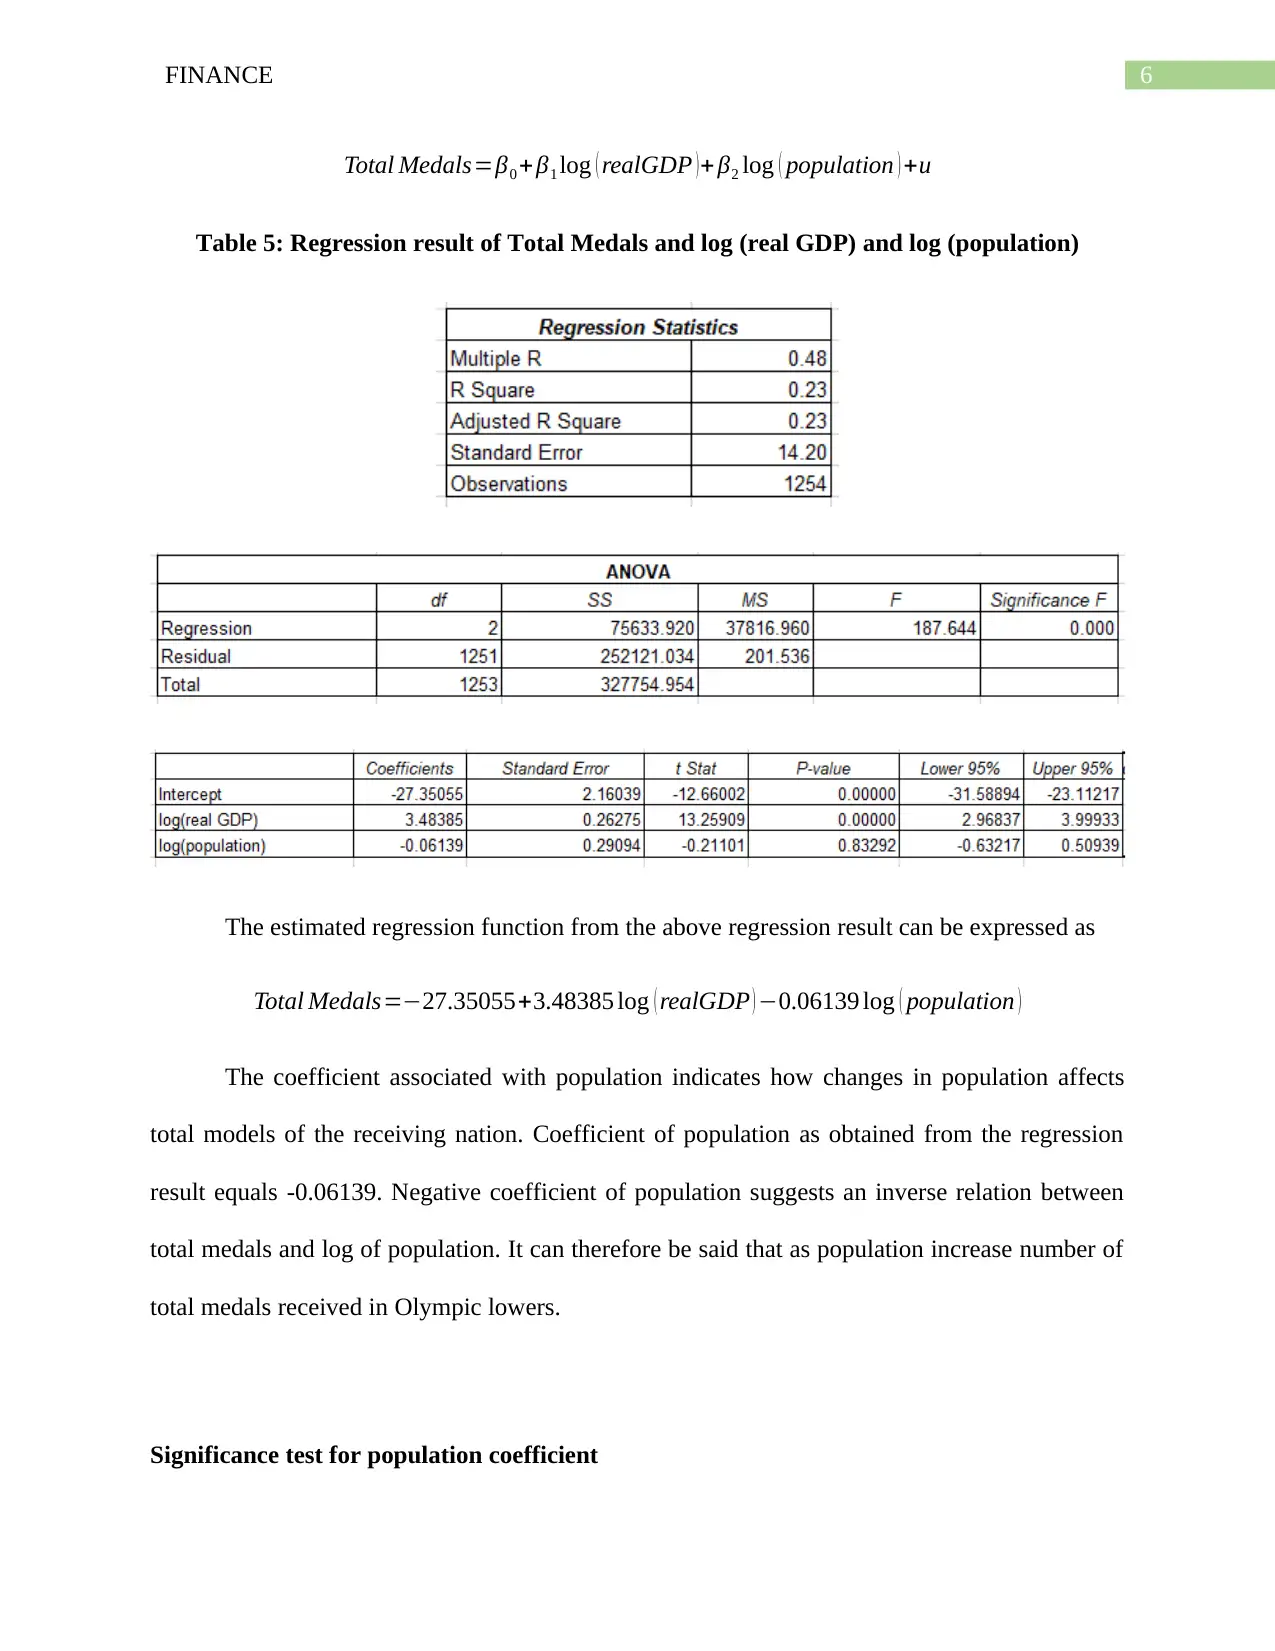
This finance assignment delves into a regression analysis of factors influencing Olympic medal counts. The student explores the relationship between real GDP, population, and the total number of medals won by countries. The analysis includes descriptive statistics, regression equations, and tests for statistical significance. Various models are developed and tested, including the use of logarithmic transformations and the inclusion of variables such as planned economy and host country status. The assignment also examines the impact of Soviet Union membership on medal counts. The report presents tables of regression results, interprets coefficients, and conducts hypothesis tests to determine the significance of different variables. The findings provide insights into the economic and demographic factors that contribute to success in the Olympic Games, and the student demonstrates an understanding of econometric methods and statistical inference.
Document Page
Running head: FINANCE
Finance
Name of the Student
Name of the University
Course ID
tabler-icon-diamond-filled.svg

Paraphrase This Document

Need a fresh take? Get an instant paraphrase of this document with our AI Paraphraser
Document Page
1FINANCE
Table of Contents
Question i.........................................................................................................................................2
Question ii........................................................................................................................................3
Question iii.......................................................................................................................................4
Question iv.......................................................................................................................................5
Question v........................................................................................................................................6
Question vi.......................................................................................................................................8
Question vii......................................................................................................................................9
Question viii...................................................................................................................................10
Question ix.....................................................................................................................................12
Bibliography..................................................................................................................................14
Document Page
2FINANCE
Question i
Table 1: Summary statistics of Real GDP, Population and Total Medals
Summary statistics of the variables suggest that average real GDP for the time period is
137726.66 million dollars. Standard deviation as estimated from the series of real GDP is
548622. 2. The standard deviation for the series is larger than mean GDP indicating that the
series is highly volatile in nature. During the taken period minimum real GDP is recorded to be
46 million dollars and that of maximum real GDP is recorded to be 7280000 million dollars.
Average population for the time period is 27.54 million dollars. Standard deviation as
estimated from the series of population is 93.50. The standard deviation for the series far exceeds
mean population indicating that the series is highly volatile in nature. During the taken period
minimum population is recorded to be 0.1 million and that of maximum population is recorded to
be 1220 million dollars.
Average number of total medals from the descriptive statistics is obtained as 5. Standard
deviation for the total medal series is 16.17. The standard deviation for the series is larger than
Document Page
3FINANCE
mean number of medals indicating that the series varies widely during the sample period. The
highest and lowest number of total medals are 195 and 0 respectively.
Question ii
Total Medals=β0 +β1 realGDP+u
Table 2: Regression result of Total Medals and Real GDP
The estimated regression equation from the above regression result can be expressed as
Total Medals=2.458184+ 0.000019realGDP
The coefficient of regression indicates impact of a unit change in real GDP on total
medals obtained by the nation. The estimated coefficient is 0.000019. Positive regression
coefficient implies there is a positive impact of real GDP on total number of medals. That is
countries with a higher GDP are likely to receive more medals and vice-versa.
Question iii
tabler-icon-diamond-filled.svg

Paraphrase This Document

Need a fresh take? Get an instant paraphrase of this document with our AI Paraphraser
Document Page
4FINANCE
Regression model with log specification is given as
Total Medals=β0 + β1 log ( real GDP )+u
Table 3: Regression result of Total Medals and log (real GDP)
The estimated regression equation from the above regression result can be expressed as
Total Medals=27.0712+3.4430 log ( real GDP )
Associated coefficient for log (real GDP) is obtained as 3.4430. The coefficient captures
effect of a change in log (real GDP) on total number of medals. The obtained positive coefficient
indicates that there exists a positive relation between total medals and log (real GDP). The
direction of relation is in line with expectation. Higher real GDP indicates that nation can attain a
higher average income which is supportive for development of good players. Increasing number
of good players in turn help the nation to achieve more medals.
Question iv
Document Page
5FINANCE
Total Medals=β0 +β1 realGDP+ β2 Population+ u
Table 4: Regression result of Total Medals and real GDP and Population
The estimated regression function from the above regression result can be expressed as
Total Medals=1.911994+0.000018realGDP+ 0.026154 Population
Associated R square value of the regression model indicates goodness of fit of the
respective models. For model estimated in part (ii), the estimated R square value is 0.42. This is
to say that in the model real GDP accounts nearly 42 percent variation in total number of medals.
Rest of the variation in number of medals can be explained by other factor. Addition of
population in the model increase R square value of the model to 0.44. Now, real GDP and
population together account 44 percent variation in total medals. The new variable thus increases
explanatory power of the model only by 2 percent
Question v
Document Page
6FINANCE
Total Medals=β0 +β1 log ( realGDP )+ β2 log ( population ) +u
Table 5: Regression result of Total Medals and log (real GDP) and log (population)
The estimated regression function from the above regression result can be expressed as
Total Medals=27.35055+3.48385 log ( realGDP ) 0.06139 log ( population )
The coefficient associated with population indicates how changes in population affects
total models of the receiving nation. Coefficient of population as obtained from the regression
result equals -0.06139. Negative coefficient of population suggests an inverse relation between
total medals and log of population. It can therefore be said that as population increase number of
total medals received in Olympic lowers.
Significance test for population coefficient
tabler-icon-diamond-filled.svg

Paraphrase This Document

Need a fresh take? Get an instant paraphrase of this document with our AI Paraphraser
Document Page
7FINANCE
Hypotheses
Null hypothesis: The coefficient of population does not significantly differ from zero. That is
β2=0
Alternative hypothesis: The coefficient of population differs significantly from zero. That is
β2 0
Test statistics
For conducting the hypothesis test t test has been used
t=
^β2β2
SE ( β2 ) t α
2 ,n1
¿ 0.06139
0.29094
¿0.21101
Decision rule
The critical value of t corresponding to 1 percent significance level and degrees of
freedom of 1251 equals 2.5798. Computed value of t for the coefficient is less than critical t. The
null hypothesis of no significant relation between total medals and log (population) therefore is
accepted.
Conclusion
The obtained result suggests that population coefficient is statistically insignificant
corresponding to 1 percent significance level.
Document Page
8FINANCE
Question vi
Significance test of real GDP
Hypotheses
Null hypothesis: The coefficient of real GDP does not significantly differ from zero. That is
β1=0
Alternative hypothesis: The coefficient of real GDP significantly exceeds zero.
β2>0
Test statistics
For conducting the hypothesis test t test has been used
t=
^β1β2
SE ( β1 ) t α ,n1
¿ 3.48385
0.26275
¿ 13.25909
Decision rule
The critical value of t corresponding to 1 percent significance level and degrees of
freedom of 1251 equals 2.3293. Computed value of t for the coefficient exceeds the value of
critical t. The null hypothesis of no significant relation between total medals and log (real GDP)
therefore is rejected.
Conclusion
Document Page
9FINANCE
The obtained result suggests that real GDP is a statistically significant positive
determinant of total medals.
Question vii
After adding planned economy and host country to the regression function in (v), the new
model becomes
Total Medals=β0 + β1 log ( realGDP )+ β2 log ( population ) + β3 plannedeconomy+ β4 hostcountry+u
Table 6: Regression result of Total Medals, log (real GDP), log (population), planned
economy and host country
Test for individual significance of planned economy and host economy
The respective value of computed t statistics for the two variables are as follows
tabler-icon-diamond-filled.svg

Paraphrase This Document

Need a fresh take? Get an instant paraphrase of this document with our AI Paraphraser
Document Page
10FINANCE
Planned Economy :t= 3.9665
3.0838 =1.2862
Host Country :t= 47.1033
4.3784 =10.7582
The critical t value corresponding to 1 percent level of significance and degrees of
freedom equivalent to 1249 is 2.5798. For the variable planned economy, computed t is less than
critical t suggesting acceptance of null hypothesis stating the variable is not significant
statistically at 1 percent significance level. However, for the variable host country, computed t
exceeds critical t meaning rejection of null hypothesis claiming the coefficient is not statistically
significant. Host country therefore is statistically significant at 1 percent significance level.
Joint significance of the two variables depend on the result of F test. The regression
analysis shows that significant value of F statistics is 0.0000. The significant value is less than
chosen significance level of 5 percent. P value of F statistics therefore is less than chosen
significance level meaning the two variables are jointly significant.
Question viii
Testing overall significance of the model
Hypotheses
Null hypothesis: Associated coefficients of all the explanatory variables are zero. That is
β1=β2=β3=β4 =0
Alternative hypothesis: Associated coefficient for at least one explanatory variable significantly
differs from zero.
Document Page
11FINANCE
Test statistics
For conducting test for overall significance, the appropriate test statistics is F
F=
RSS
K
SSE
[ n ( k +1 ) ]
¿ Mean regrssion of square
Mean squared error
¿ MSR
MSE 4,1249
Computed value of F statistics is
F=
97192.2954
4
230562.6583
1249
¿ 24298.0739
184.5978
¿ 131.6271
Decision rule
The critical value of F statistics corresponding to 1 percent significance level and (4,
1249) degrees of freedom equals 3.3342. Computed F statistics for the model is greater than
critical F suggesting rejection of null hypothesis of no overall significance of the model.
Conclusion
chevron_up_icon
1 out of 15
circle_padding
hide_on_mobile
zoom_out_icon
[object Object]