HI5002 Finance for Business: BHP Billiton Analysis of Financial Health
VerifiedAdded on 2024/05/30
|20
|3725
|439
Report
AI Summary
This report provides a comprehensive financial analysis of BHP Billiton, an ASX-listed multinational mining and petroleum company. It examines the company's ownership and governance structure, calculates key financial ratios (current ratio, quick ratio, debt-to-equity ratio, inventory turnover, fixed asset turnover, gross profit margin, and return on assets), and analyzes factors influencing its share price. The report includes graphs illustrating share price trends and comparisons with the All Ords Index. Furthermore, it calculates the beta value and expected rate of return using the CAPM, determines the weighted average cost of capital (WACC), and discusses the company's debt ratio and dividend policy. The report concludes with a letter of recommendation, offering insights and suggestions for enhancing the organization's profitability and shareholder value. This document is available on Desklib, a platform with study tools for students.
HI5002: Finance for Business
1
1
Paraphrase This Document
Need a fresh take? Get an instant paraphrase of this document with our AI Paraphraser
Contents
Introduction.................................................................................................................................................3
Questions.....................................................................................................................................................4
1. A Brief Description about company................................................................................................4
2. Ownership Governance Structure....................................................................................................4
3. Fundamental Ratios.........................................................................................................................6
4. Two graphs with description of result..............................................................................................8
5. Factors influencing the share price................................................................................................10
6. Calculation of beta values and expected rate of return using the CAPM.......................................11
7. Weighted Average Cost of Capital (WACC).................................................................................12
8. Debt Ratio......................................................................................................................................14
9. Dividend Policy.............................................................................................................................16
10. Letter of Recommendation........................................................................................................17
Conclusion.................................................................................................................................................18
References.................................................................................................................................................19
2
Introduction
This report explains about the management of the various resources in the organization. The
utilization of the resources is done so that the profitability can be increased and the
accountability can be maintained within the organization. For the explanation of the whole report
the BHP Billiton has been considered so that the practical knowledge about the report can be
gained. The various ratios are calculated so that the financial position of the organization can be
gained. The factors which affect the share price of the organization are also determined. The
dividend policy of the organization is also explained so that the distribution of the profits to
shareholders can be gained. The recommendations are also provided to the organization which
can be used by the organization for attaining the profitability within the organization. To give the
practical implementation for the factors that are affecting price the graphs are depicted.
3
⊘ This is a preview!⊘
Do you want full access?
Subscribe today to unlock all pages.
Trusted by 1+ million students worldwide
Questions
1. A Brief Description about company
The BHP Billiton is the ASX Listed Anglo Australian multinational metal, mining and petroleum
company which have its headquarters in Melbourne, Australia (BHP Billiton, 2018). It was
founded in on 29 September 1860 and is ranked as one of the world’s largest mining company
which is based upon the capitalization of market. The products of the company are coal,
petroleum and iron ore. According to the survey of 2017 revenue of the organization was
$38.285 and about 65000 employees are working to provide the quality of products to the
customers. They are committed to the highest level of governance to create the long term
shareholders value (BHP Billiton, 2018).
2. Ownership Governance Structure
I) The shareholders with higher than 20% of the shareholdings are: One of the largest is
the bank of America Corporation who has 4.2 million shareholdings. The second is
Dimensional fund Advisor LP who have the holdings of 3.2 million. The Earnest
Partners LC reported 2.1 million shares (BHP Billiton, 2018).
The shareholders for more than 5% shareholdings are: The shareholders of the organization who
have the shareholdings of more than 5% are Neuberger Berman Group LLC has the
shareholdings of 1.9 million shares (BHP Billiton, 2018).
II) The main people who are involved in the corporate governance are:
Chairman: Ken Mackenzie
Board Members: The members of the board are:
Jac Nasser
Andrew Mackenzie (Non independent Director and CEO)
Malcolm Brinded (Non Executive Director)
Malcolm Broomhead (Independent Non- Executive Director)
Shriti Vadera (Senior Independent Director)
Anita Frew (Independent Non- Executive Director)
4
Paraphrase This Document
Need a fresh take? Get an instant paraphrase of this document with our AI Paraphraser

Lindsay Maxsted (Independent Non Executive Director)
Wayne Murdy (Independent Non Executive Director)
5
Wayne Murdy (Independent Non Executive Director)
5
3. Fundamental Ratios
Calculation of Ratios
Sr.
No.
Particular Year 2017
$M
Year 2016
$M
1 Total Asset 117006.00
0
118953.00
0
2 Total Liability 54280.000 58882.000
3 Ordinary Equity 62726.000 60071.000
4 Net profit After Tax 6222.000 -6207.000
5 Total Current Assets 21056.000 17714.000
6 Total Current Liabilities 11366.000 12340.000
7 Inventories 3673.000 3411.000
8 Quick Asset 17383.000 14303.000
9 Debt 16321.000 26102.000
10 Net Sales 38285.000 30912.000
11 Fixed Asset 3131.000 3131.000
12 Gross profit 6222.000 -6207.000
13 EPS (Cents) 110.700 -120.000
Current Ratio = Current Asset/
Current Liability
1.85 1.44
Quick Ratio = Quick Asset/
Current Liability
1.53 1.16
Debt Equity ratio = Debt/
Equity
0.26 0.43
Inventory Turnover Ratio =
sales / Inventory
10.42 9.06
Fixed Asset Turnover Ratio =
sales / Fixed assets
12.23 9.87
Gross Profit Margin Ratio =
Gross profit / Sales
0.16 -0.20
Return On Assets = Net Income
/ Total Asset
0.33 0.26
Earnings per share 110.70 -120.00
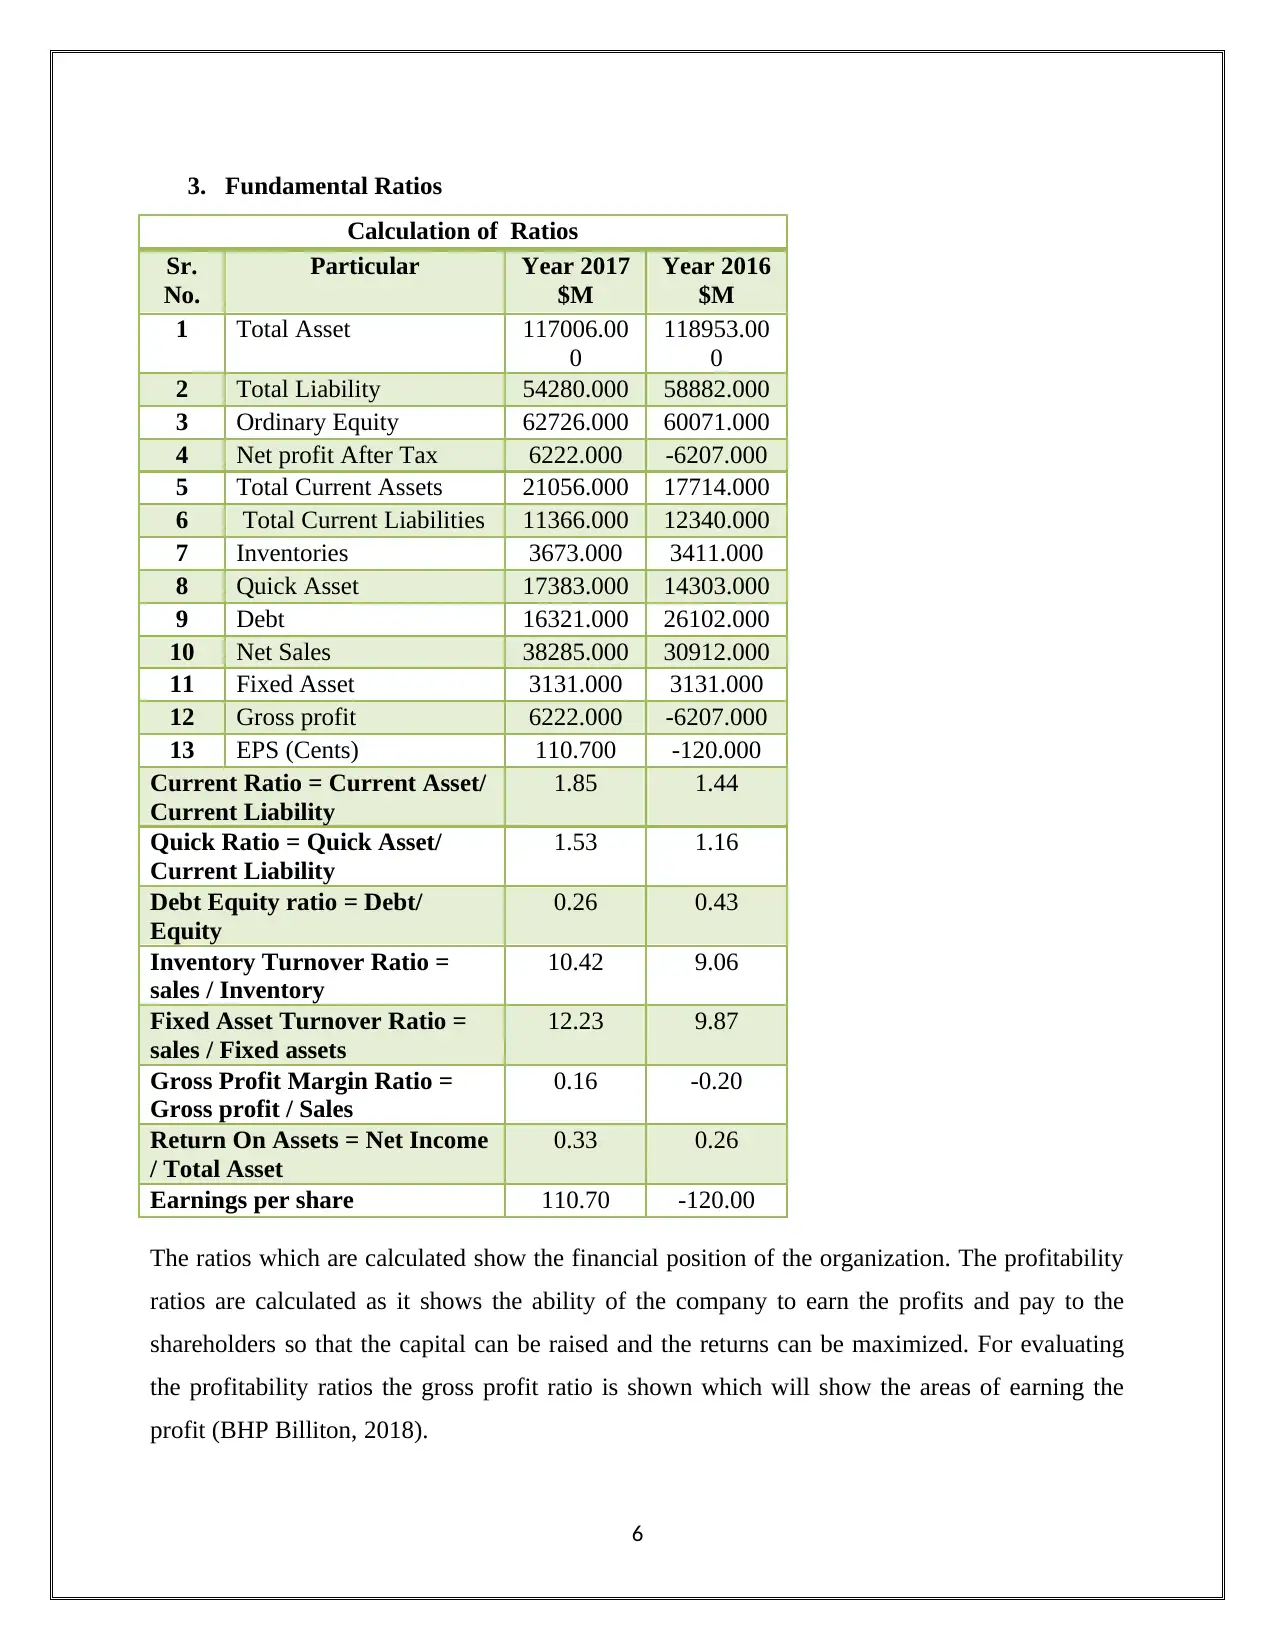
The ratios which are calculated show the financial position of the organization. The profitability
ratios are calculated as it shows the ability of the company to earn the profits and pay to the
shareholders so that the capital can be raised and the returns can be maximized. For evaluating
the profitability ratios the gross profit ratio is shown which will show the areas of earning the
profit (BHP Billiton, 2018).
6
Calculation of Ratios
Sr.
No.
Particular Year 2017
$M
Year 2016
$M
1 Total Asset 117006.00
0
118953.00
0
2 Total Liability 54280.000 58882.000
3 Ordinary Equity 62726.000 60071.000
4 Net profit After Tax 6222.000 -6207.000
5 Total Current Assets 21056.000 17714.000
6 Total Current Liabilities 11366.000 12340.000
7 Inventories 3673.000 3411.000
8 Quick Asset 17383.000 14303.000
9 Debt 16321.000 26102.000
10 Net Sales 38285.000 30912.000
11 Fixed Asset 3131.000 3131.000
12 Gross profit 6222.000 -6207.000
13 EPS (Cents) 110.700 -120.000
Current Ratio = Current Asset/
Current Liability
1.85 1.44
Quick Ratio = Quick Asset/
Current Liability
1.53 1.16
Debt Equity ratio = Debt/
Equity
0.26 0.43
Inventory Turnover Ratio =
sales / Inventory
10.42 9.06
Fixed Asset Turnover Ratio =
sales / Fixed assets
12.23 9.87
Gross Profit Margin Ratio =
Gross profit / Sales
0.16 -0.20
Return On Assets = Net Income
/ Total Asset
0.33 0.26
Earnings per share 110.70 -120.00
The ratios which are calculated show the financial position of the organization. The profitability
ratios are calculated as it shows the ability of the company to earn the profits and pay to the
shareholders so that the capital can be raised and the returns can be maximized. For evaluating
the profitability ratios the gross profit ratio is shown which will show the areas of earning the
profit (BHP Billiton, 2018).
6
⊘ This is a preview!⊘
Do you want full access?
Subscribe today to unlock all pages.
Trusted by 1+ million students worldwide
The liquidity ratios are also calculated which will show the liquidity position of the company that
how capable the organization is to pay back its debts from the liabilities so that the company
cannot be proved to be insolvent in case of the crisis (Nautiyal and Kavidayal, 2018). The current
ratio reveals the ability of the company to pay its current liabilities from the current assets and
the quick ratio shows the ability to pay the liabilities from the quick assets (BHP Billiton, 2018).
The current ratio is has been increased from 1.44 to 1.85 which shows the positive results so that
the liabilities can be paid with that of assets (Grüninger and Kind, 2013). Same is with that of the
quick assets which are also increasing to the company has the good liquidity position (Sharif, et.
al., 2015) .
The debt to equity ratio is also calculated which will reveal the amount of the equity to that of
the debt. There are only two ways through which the organization can raise the capital which is
debt and the equity but it is necessary to maintain the balance between the both as the excess of
debt will give the negative impact in the organization (BHP Billiton, 2018). The debt to equity
ratio has been decreased from 0.43 to 0.26 which shows that the more investment is done in
debts than that of the equity which shows the good condition for the organization (Grüninger and
Kind, 2013).
The assets utilization ratios are calculated so the returns for the inventory and the assets can be
evaluated. The assets turnover ratio is calculated so as to measure the value of the company’s
revenue which will be generated from the invested assets (Grüninger and Kind, 2013). The assets
turnover ratio also showed the positive results so this can be seen that the revenue generated is
maximum according to the evaluation (BHP Billiton, 2018).
So, it can be seen that the financial health of the organization is in good condition so the
shareholders can take the decisions related to investment as the assets turnover ratio is positive
so the returns which will provided by the organization will be maximum (Grüninger and Kind,
2013).
7
Paraphrase This Document
Need a fresh take? Get an instant paraphrase of this document with our AI Paraphraser
4. Two graphs with description of result
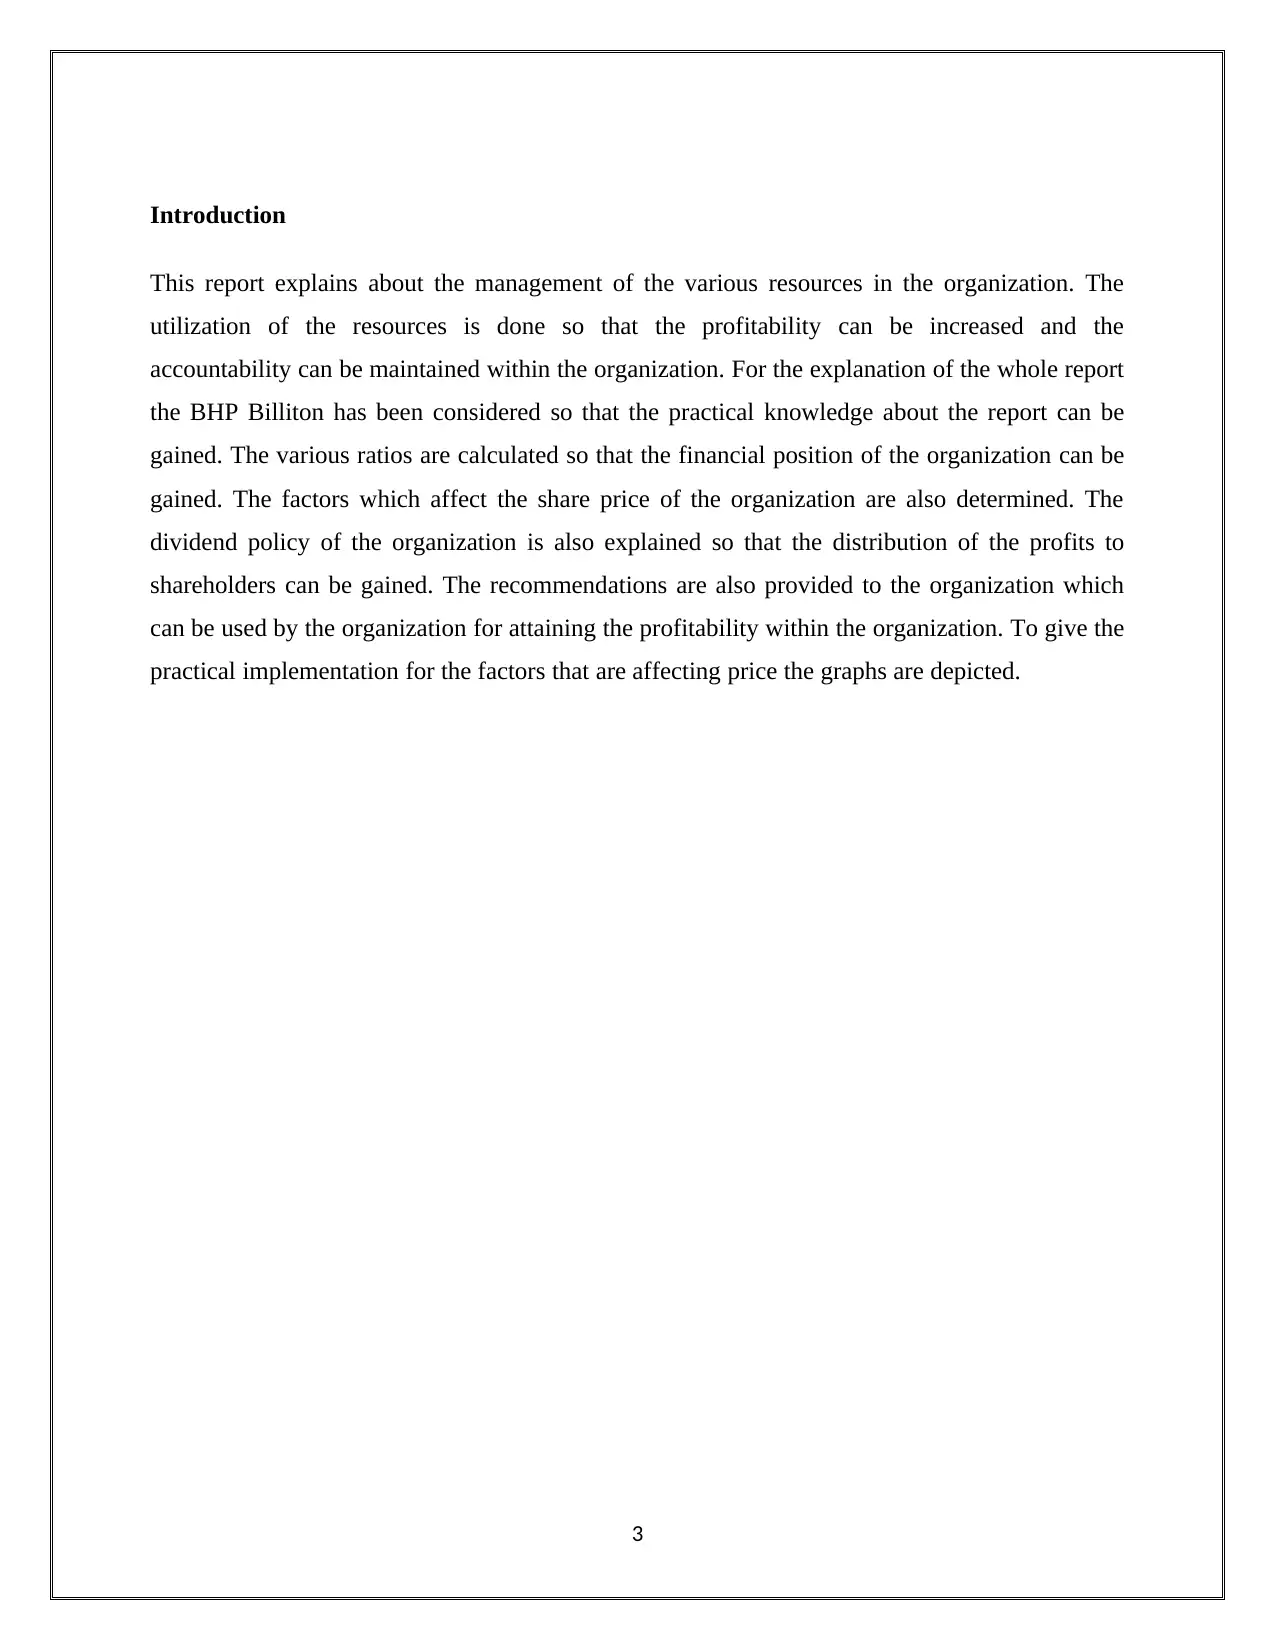
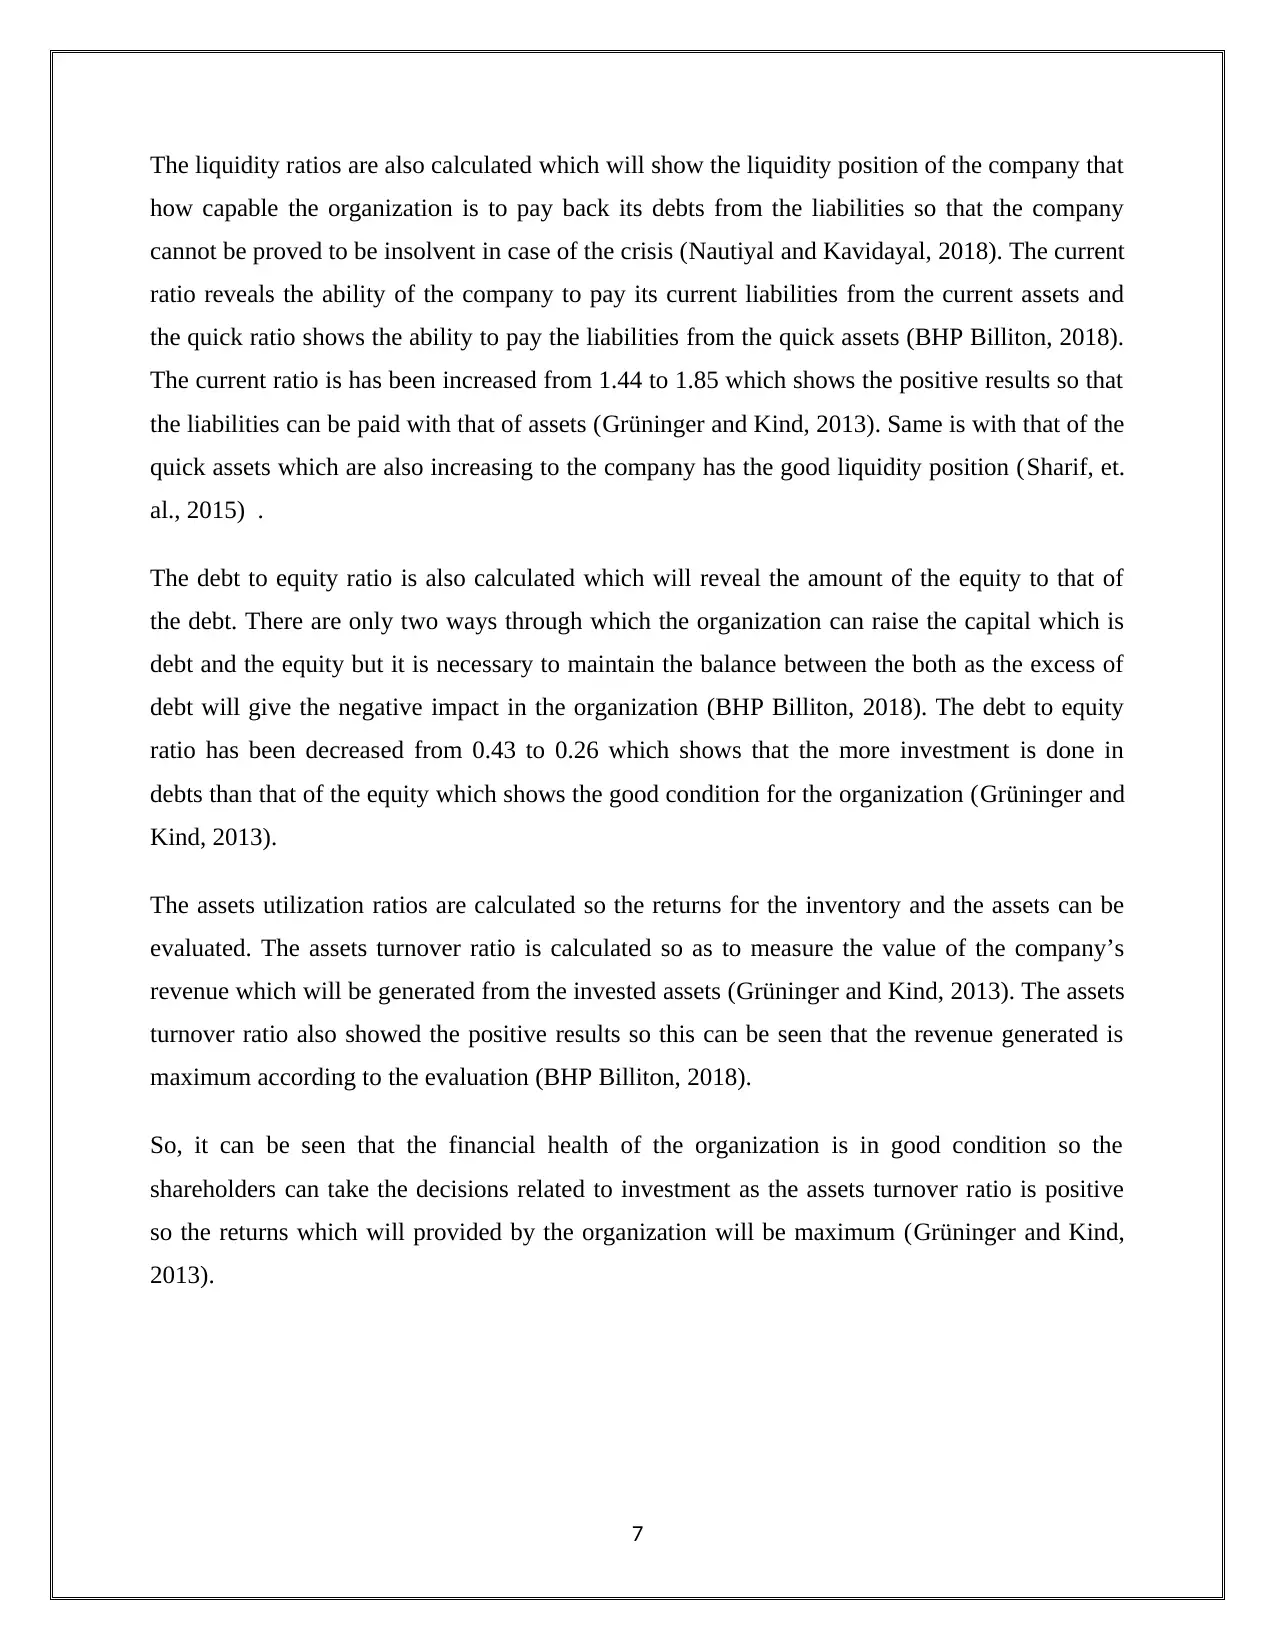
I) Share Price of Company for 2 Years
Image: Share Price for 2 Years
Source: Market Index, 2018
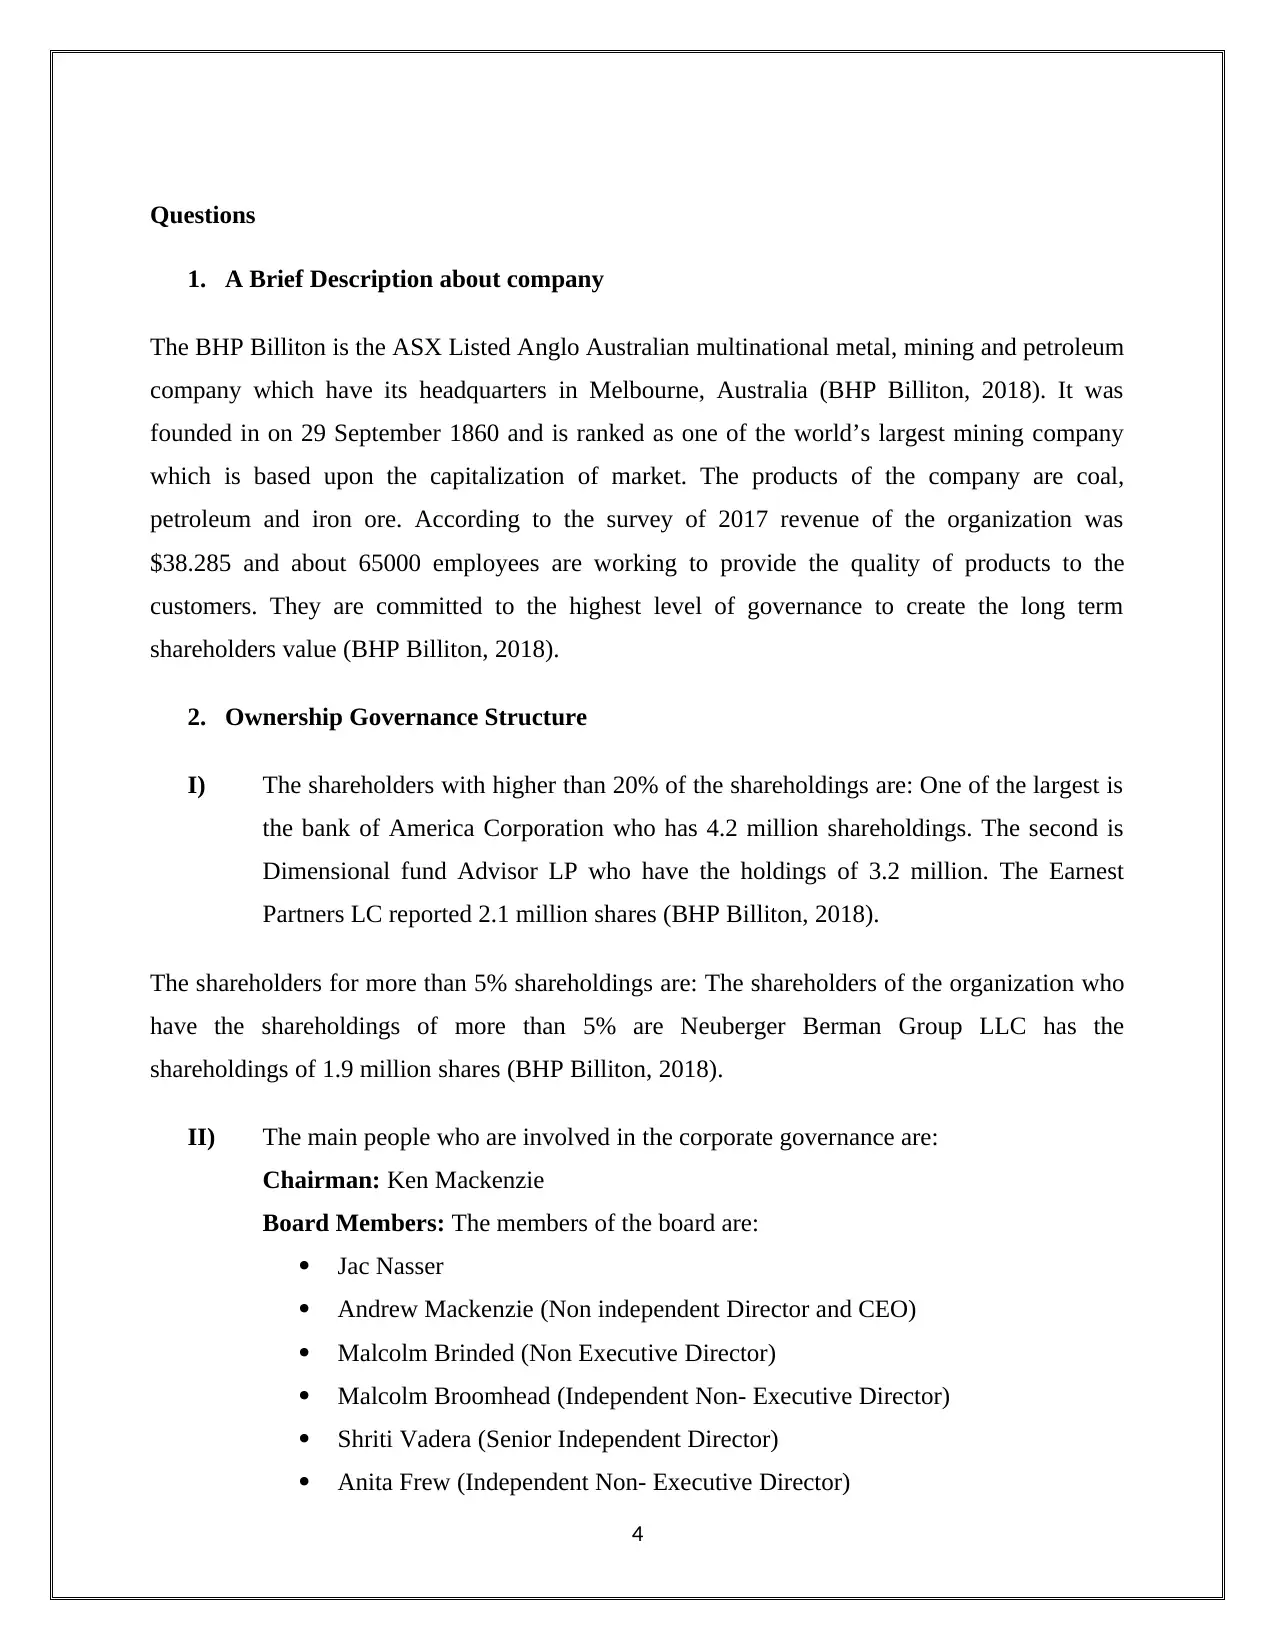
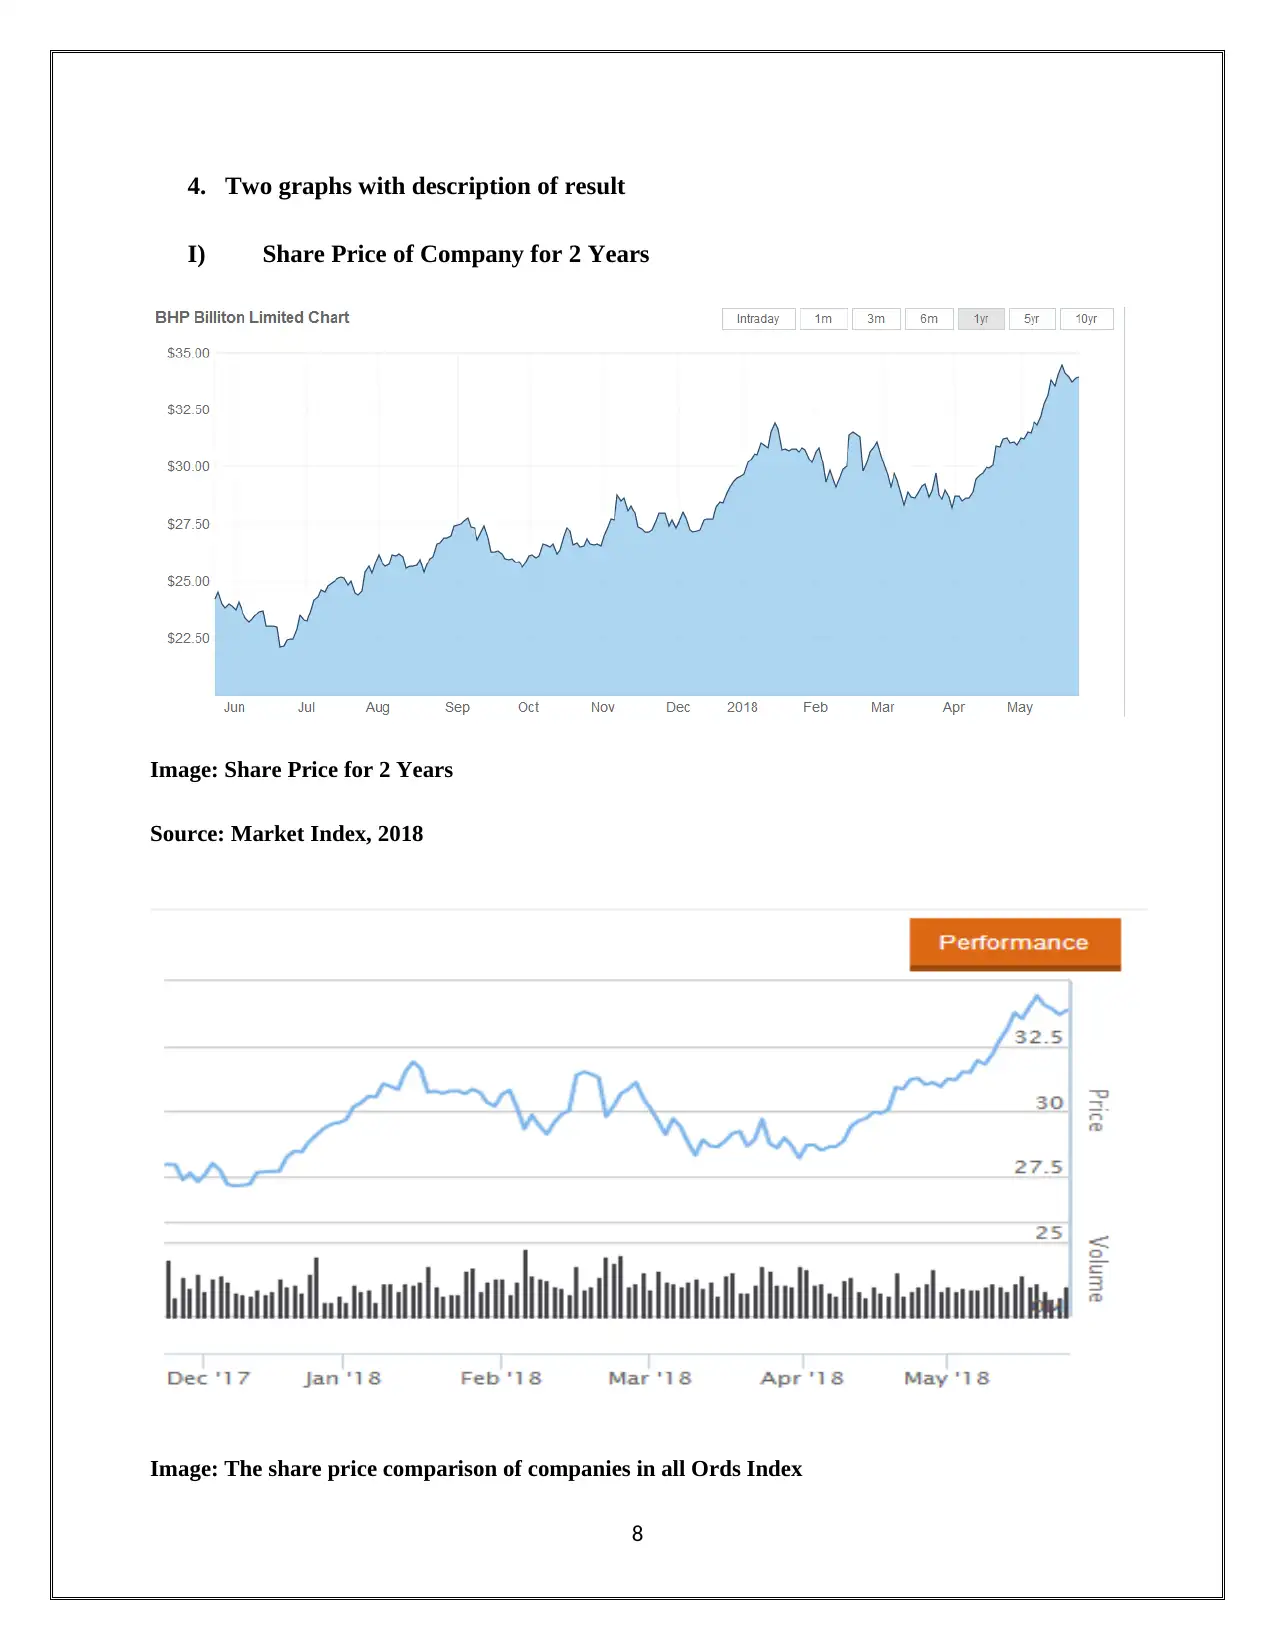
Image: The share price comparison of companies in all Ords Index
8
I) Share Price of Company for 2 Years
Image: Share Price for 2 Years
Source: Market Index, 2018
Image: The share price comparison of companies in all Ords Index
8
Source: ASX, 2018
Introduction
The report explains about the share prices of the BHP Billiton Limited and the movement which
has been seen in the share prices over the years. With this the report also deals with the All Ords
Index so as to determine the correlation between all the factors of the movement in the share
prices of the organization.
Content
It can be seen from the above graphs that the share prices of the organization is fluctuating over
the years. Earlier the graph showed the negative results but during the years the prices of the
shares has been increasing in the competitive market (Grüninger and Kind, 2013). When these
Scenarios are compared with that of the All Ords Index the company showed the same results
(Frank and Shen, 2016). So, it can be stated that their exists the positive relation between the All
Ords Index and the share price of the organization as with the decrease in the All Ords Index the
share prices will also decrease and vice versa (Market Index, 2018). The change which has been
occurred in the share prices showed the positive relation between both the factors (Frank and
Shen, 2016).
Conclusion
It can be said that the share prices of the organization have the strong relation with that of the All
Ords Index and the share prices of the organization are high. But the same aspect cannot be
considered in the long run as there are various fluctuations in the share price of the organization
during the years.
9
⊘ This is a preview!⊘
Do you want full access?
Subscribe today to unlock all pages.
Trusted by 1+ million students worldwide
5. Factors influencing the share price
There are many factors which may impact the share price of the BHP Billiton are:
Macro Factors: The macros factors include the political, social, economical and the
technological factors that may impact the share price of the organization (Frank and Shen, 2016).
Like the change in the government policies the overall policy of the organization will be changed
which in turn will impact the share price of the organization (Frank and Shen, 2016). With that if
the inflation rate of the organization changes so the prices of the shares may increase (Nautiyal
and Kavidayal, 2018).
Impact of the Competitors: The industry wide factors means when the new supply enters into
the market with the same product so it impacts the share price of the organization (Frank and
Shen, 2016). The large new supplier of the iron ore will hit the markets and the opportunities of
the investment of the last few years. With the less demand and the more supply the prices of the
iron ore will fall which in turn will impact the share prices of the miners (Frank and Shen, 2016).
Significant Factor Changes: The significant changes in the organization may also impact the
share price of the organization (Frank and Shen, 2016). If the prices of the iron ore falls
drastically so the materials which are made of the iron ore will also fall this in turn will impact
the Australian shareholders. This fall will impact negatively the profits of the miners and will
adversely affect the share prices of BHP Billiton.
10
Paraphrase This Document
Need a fresh take? Get an instant paraphrase of this document with our AI Paraphraser
6. Calculation of beta values and expected rate of return using the CAPM
I) The beta value of BHP Billiton is 1.34 (Reuters, 2018).
II) As per the CAPM the rate of return can be determined as =Rf + (β) (Risk Premium of
Market)
Here, The Rf= The rate of risk free
β = Beta Value
So, the rate of return = 4% + 1.34*6%
= 4% + 8.04%
= 12.04%
III) Yes, the company can be chosen as the conservative investment as the rate of return
of the organization is low (Reuters, 2018). This indicates that the low rate of return in
accordance with that above the risk free rates indicates that the share price of the
organizational is minimal (Nautiyal and Kavidayal, 2018). This can be seen that the
shareholders can easily take the investment decision as there are fewer chances to the
shareholders for bearing the losses. The company which have the less risk involved
can be chosen as a conservative investment as it will provide maximum returns
(Reuters, 2018). In the short run there will be higher returns that will be provided to
the shareholders but in the long run there may be the chances that the company may
not get the possible satisfactory returns which may increase the profitability of the
organization (Nautiyal and Kavidayal, 2018).
11
7. Weighted Average Cost of Capital (WACC)
I) WACC = E x Re + D x Rd (1 – T)
V V
Here,
E = Equity
Re = Rate of Return
D = Debt
Rd= Cost of Debt
T= Rates of taxes
V= Debt + Equity
WACC= 62726x 0.1204 + 16321 (237/16321) (1-0.34)
79047
WACC= 7527.12 + 156.42
WACC=7683.54
WACC=76.83%
II) In order to satisfy the needs of the shareholders the weighted average Cost of Capital
must be recovered by the organization so that the shareholders can make the
investment decision (Finance Management, 2018). The main aim of the organization
is to provide the maximum rate of return to the shareholders. Those projects which
will provide maximum returns in the long run must be selected so that the financial
performance of the organization must be increased by rejecting the areas of the debts
12
⊘ This is a preview!⊘
Do you want full access?
Subscribe today to unlock all pages.
Trusted by 1+ million students worldwide
1 out of 20
Related Documents


Your All-in-One AI-Powered Toolkit for Academic Success.
+13062052269
info@desklib.com
Available 24*7 on WhatsApp / Email
![[object Object]](/_next/static/media/star-bottom.7253800d.svg)
Unlock your academic potential
Copyright © 2020–2026 A2Z Services. All Rights Reserved. Developed and managed by ZUCOL.