University Finance Report: Introduction to Accounting and Finance
VerifiedAdded on 2020/05/04
|11
|1978
|59
Report
AI Summary
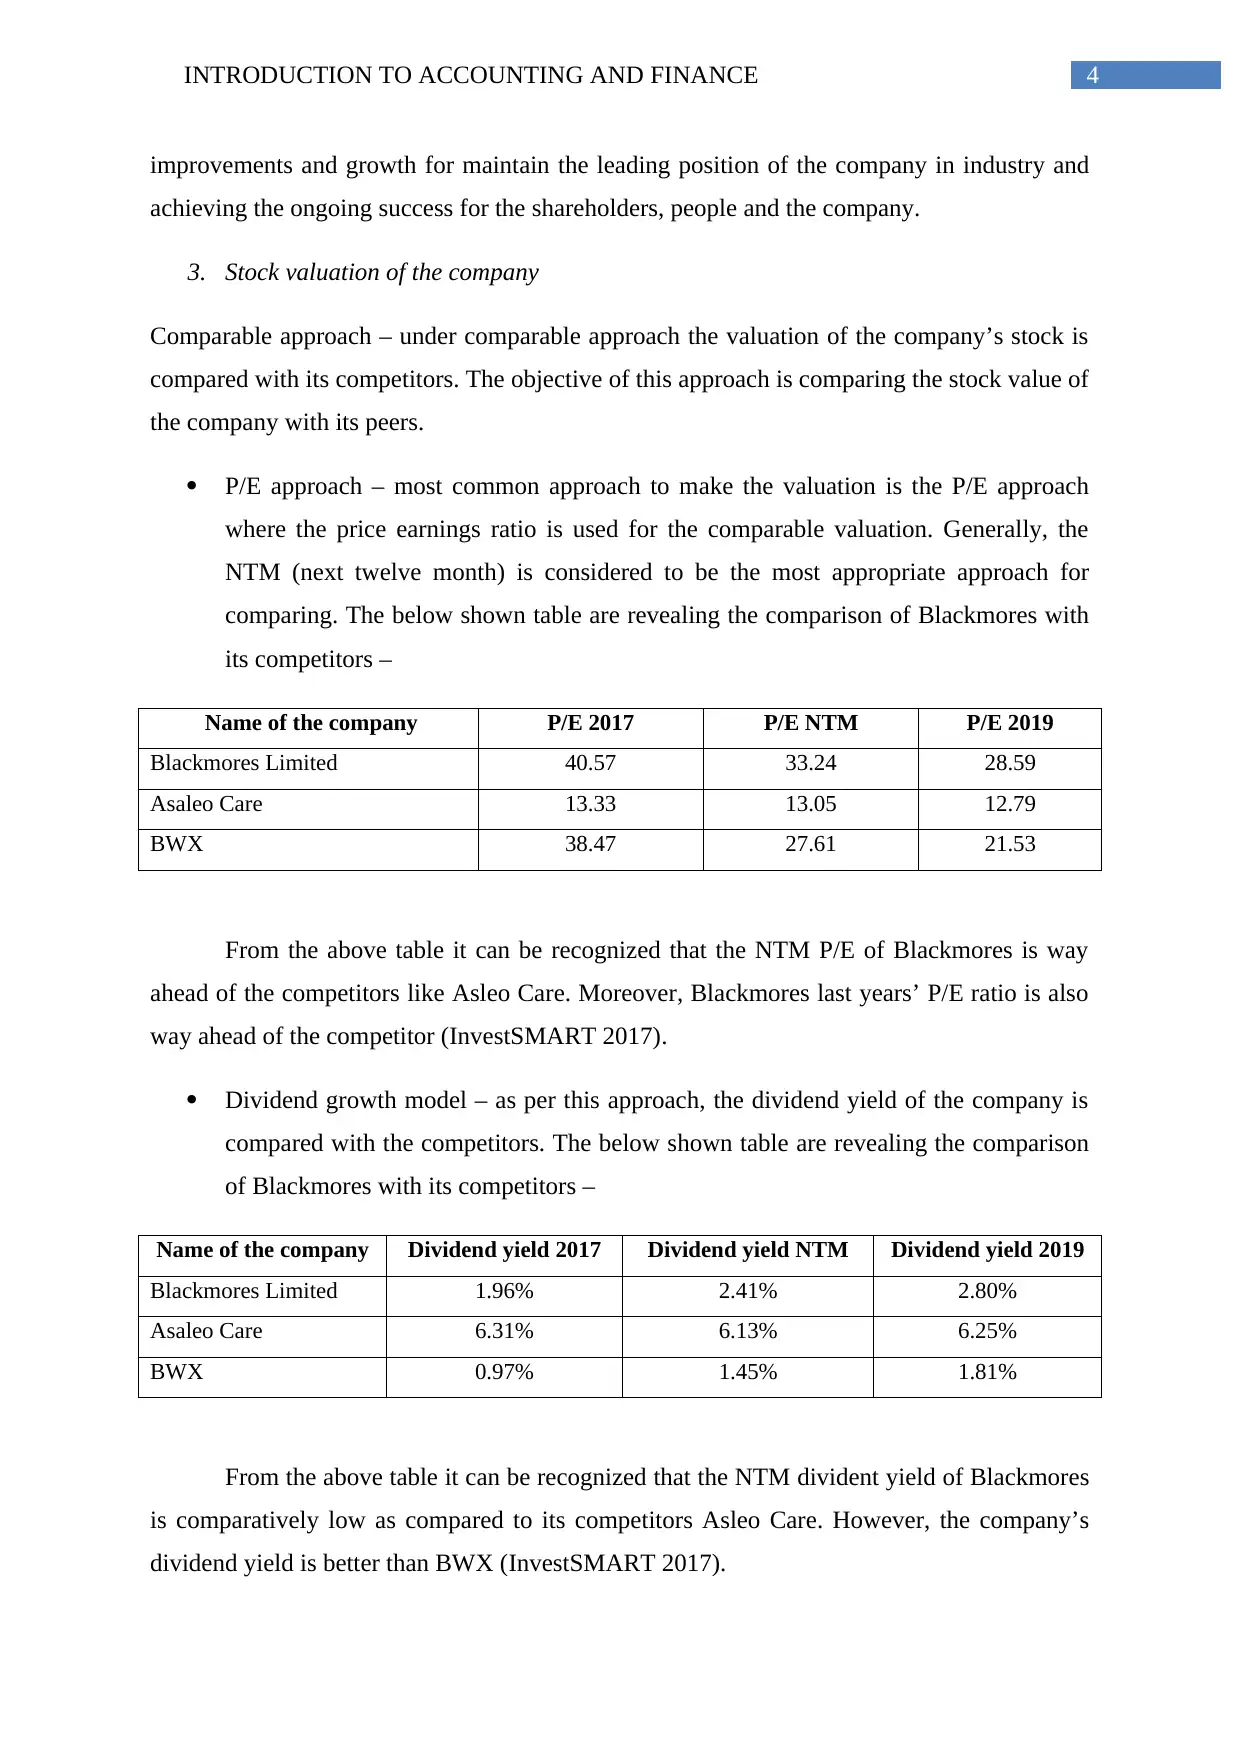
This report provides an introduction to accounting and finance, focusing on the valuation of debt and shares, cost of capital, and market analysis, using Blackmores as a case study. The report begins with an overview of debt valuation, differentiating between long-term and short-term debt, and assessing industry influence and the cost of debt. It then moves on to share valuation, calculating the cost of equity and analyzing Blackmores' performance, including revenue, earnings, EPS, and dividend trends. The report employs both the P/E approach and dividend growth models to evaluate the company's stock. Furthermore, it calculates the Weighted Average Cost of Capital (WACC), explores the difference between the cost of debt and equity, and analyzes Blackmores' capital structure, including debt-equity ratio. Finally, the report provides a market analysis, discussing the company's financial performance, analyst reports, and cash conversion ratio. The report uses data from Blackmores' annual reports and industry benchmarks to support its analysis.

Running head: INTRODUCTION TO ACCOUNTING AND FINANCE
Introduction to accounting and finance
Name of the student
Name of the university
Author note
Introduction to accounting and finance
Name of the student
Name of the university
Author note
Paraphrase This Document
Need a fresh take? Get an instant paraphrase of this document with our AI Paraphraser

1INTRODUCTION TO ACCOUNTING AND FINANCE
Table of Contents
Part I – Valuation of debt...........................................................................................................2
Part II – Share valuation.............................................................................................................3
Part III – Cost of capital.............................................................................................................6
Part IV – Market analysis...........................................................................................................8
Reference....................................................................................................................................9

2INTRODUCTION TO ACCOUNTING AND FINANCE
Part I – Valuation of debt
1. Long term and short term debt
Long term debt – Blackmores raise the long term borrowing under common term deed
through the unsecured debt facility from 3 banks and the amount of debt for the closing of the
year dated 30th June 2017 amounted to $ 236,901 thousands, out of which amount of $ 78,968
being used for the businesses and $ 157,933 remained unused on the balance sheet date
(Blackmores.com.au 2017).
Short term debt – the company generally raise the short-term debt through bank overdraft
facility and the amount is payable at the call and are reviewed annually. For the closing of the
year dated 30th June 2017 amounted to $ 5,000 thousands and the entire amount remained
unused on the balance sheet date
2. Debt structure
Total debt of the company for the year closed on 30th June 2017 amounted to $
241,901, out of which only $ 5,000 is raised through short-term borrowing and the remaining
$ 236,901 raised through long-term borrowings.
3. Industry influence
Generally the industries with high growth rate raise finance through long-term debt as
they are quite sure that in future years also they will be able to generate profits and repay the
loan. As Blackmores fall under the Australian retail industry that is rapidly growing since
past few years, it is easier for the company to obtain long-term debt and use that for the long
term purpose of the business. Therefore, the maximum portion of the debt of the company is
of long term nature (Della Seta, Morellec and Zucchi 2015).
4. Cost of debt
For the financial year closed on 30th June 2017, the debt cost for the company was
2.82%
⊘ This is a preview!⊘
Do you want full access?
Subscribe today to unlock all pages.

Trusted by 1+ million students worldwide

3INTRODUCTION TO ACCOUNTING AND FINANCE
Part II – Share valuation
1. Cost of equity of the company
Cost of equity (ke) = Rf + β (Rm – Rf)
Where,
Β = Beta = 0.35
Rf = Risk free rate = 2.82%
Rm = Market risk premium = 4.35%
Thus, ke = 2.82 + 0.35 (4.35 – 2.82) = 3.36%
2. Analysis of the performance of Blackmores
Revenue – from the annual report of the company for the year ended 2016 as well as 2015, it
is recognized that the revenue of the company on 30th June 2017 was amounted to $ 692,790
thousand as compared to $ 717,211 thousand. Therefore, there is a 3.4% decrease in the
revenue as compared to the previous year (Blackmores.com.au 2017).
Earning – looking at the earning figures of the company, it is recognized that the earning of
the company is decreasing trend and it reduced by 42% over the year from 2016 to 2017. The
exact figure of earning for the year closed on 30th June 2017 was $ 58,028 thousands whereas
the earning figure for 30th June 2016 was $ 100,020 thousand.
EPS – as the earning of the company was in the decreasing trend, it is obvious that the EPS
too of the company is in decreasing trend and it decreased by 41% over the year from 2016 to
2017. The EPS for the year closed on 30th June 2017 was 342.6 cents whereas the EPS for
30th June 2016 was 580.6 cents (Blackmores.com.au 2017).
Dividend – the dividend payment of the company reduced by 34.1% during the year ended
2017 as compared to 2016. The dividend paid by the company for the year closed on 30th
June 2017 was 270 cents per share whereas the same for the year ended on 30th June 2016
was 410 cents.
Growth expectation – the company is committed towards the superior performance of the
business. The strategic direction of the company is focussed on providing continuous
Paraphrase This Document
Need a fresh take? Get an instant paraphrase of this document with our AI Paraphraser

4INTRODUCTION TO ACCOUNTING AND FINANCE
improvements and growth for maintain the leading position of the company in industry and
achieving the ongoing success for the shareholders, people and the company.
3. Stock valuation of the company
Comparable approach – under comparable approach the valuation of the company’s stock is
compared with its competitors. The objective of this approach is comparing the stock value of
the company with its peers.
P/E approach – most common approach to make the valuation is the P/E approach
where the price earnings ratio is used for the comparable valuation. Generally, the
NTM (next twelve month) is considered to be the most appropriate approach for
comparing. The below shown table are revealing the comparison of Blackmores with
its competitors –
Name of the company P/E 2017 P/E NTM P/E 2019
Blackmores Limited 40.57 33.24 28.59
Asaleo Care 13.33 13.05 12.79
BWX 38.47 27.61 21.53
From the above table it can be recognized that the NTM P/E of Blackmores is way
ahead of the competitors like Asleo Care. Moreover, Blackmores last years’ P/E ratio is also
way ahead of the competitor (InvestSMART 2017).
Dividend growth model – as per this approach, the dividend yield of the company is
compared with the competitors. The below shown table are revealing the comparison
of Blackmores with its competitors –
Name of the company Dividend yield 2017 Dividend yield NTM Dividend yield 2019
Blackmores Limited 1.96% 2.41% 2.80%
Asaleo Care 6.31% 6.13% 6.25%
BWX 0.97% 1.45% 1.81%
From the above table it can be recognized that the NTM divident yield of Blackmores
is comparatively low as compared to its competitors Asleo Care. However, the company’s
dividend yield is better than BWX (InvestSMART 2017).

5INTRODUCTION TO ACCOUNTING AND FINANCE
4. From the comparison through P/E approach and dividend growth model, the P/E
approach is more suitable s it represents the profitability position of the company. on
the other hand payment of the dividend is on the sole discretion of the company. it
does not reveal the profitability position of the company.
5. Along with the dividend growth and P/E ratio, the net profit, market capital, growth
rate, EPS, DPS can also be considered as crucial information for the purpose of stock
valuation.
⊘ This is a preview!⊘
Do you want full access?
Subscribe today to unlock all pages.

Trusted by 1+ million students worldwide

6INTRODUCTION TO ACCOUNTING AND FINANCE
Part III – Cost of capital
1. Calculation of WACC
Net debt = 44,717
Shareholder’s equity = 177,541
Weight of debt = 20%
Weight of equity = 80%
WACC after tax –
WACC = wd (cost of debt after tax) + we (cost of equity)
= [(1-0.293)*(0.2*2.82)] + (0.8*3.36)
= 3.09%
2. Effective tax rate of Blackmores for the purpose of calculation of weighted average
cost of capital is 29.3%
3. Difference among the cost of debt and equity
Equity capital is raised from investors through issuing the shares of the company. The
investors are known as the shareholders of the company. Based on the performance and
profitability of the company, the shareholders get their payment on the shares. On the other
hand, the debts can be borrowed from various sources like banks and financial institutions in
exchange of interest which is to paid periodically along with the original amount (Valta
2016). The interest rate is called as the cost of capital and it is deductible expenses for the
purpose of tax. Therefore, the cost of debt and equity is different.
4. Current liabilities are the deductible expenses for the purpose of tax and therefore, are
included for the computation of capital cost. However, the current liabilities carry risk
element and therefore, including the current liabilities in the capital structure will
enhance the level of risk.
5. Major element in the WACC computation of Blackmores is the equity component as
it includes 80% of the total capital structure of the company. Lower component of
debt represents that the company is lower leveraged and the business of the company
Paraphrase This Document
Need a fresh take? Get an instant paraphrase of this document with our AI Paraphraser

7INTRODUCTION TO ACCOUNTING AND FINANCE
is stable and strong. The higher debt component is treated as more risky by the
investors. Thus, the capital structure of the company will attract the investors to invest
in Blackmores.
6. Two major investment decision taken by the company recently are – (i) undertaken
new campaign for the market and (ii) increased the company’s plant capacity
7. The proportion of 1:2 is considered as the ideal debt – equity proportion for any
company. Blackmores capital structure includes 80% equity and 20% debt and the net
amount of debt is $ 44,717 thousand whereas, the amount of equity is $ 177,541
thousands. Therefore, the company still has the scope of raising capital through debt
instead of equity (De Fiore and Uhlig 2015).
8. The debt – equity ratio at which the any company can maximise its return and
minimise its payment burden is regarded as the optimal capital structure. The optimal
structure creates a balance among the debt and equity component under the capital
structure. More debt will make the company highly leveraged and will expose to more
risk.

8INTRODUCTION TO ACCOUNTING AND FINANCE
Part IV – Market analysis
1. Financial performance of the company
As published by The Wall Street Journal in Australia, the return on assets of the
company is 2o.2%, basic EPS is 3.42 and the P/E ratio is 39. As per their view, the company
is stable and a good consideration for the purpose of investment.
2. Report of the financial analyst
As stated by the financial analyst regarding the financial performance of the company,
Blackmores has the strong financial background with the lower level of leverage and good
aspect of visibility, growth and profitability. Further, it has higher return margin that creates
value for the shareholders. However, the short term investment strategies of the company are
considered as having poor fundamentals. Moreover, the Blackmores is not so generous with
the shareholder’s compensation aspect like payment of dividend.
Yes, I am agree with the report of the financial analyst as all the facts can be
supported and analysed by going through and analysing the annual report of the company.
3. Any other item that must be mentioned here in the report is that the cash conversion
ratio of the company is 100.7% that is regarded as significantly good.
⊘ This is a preview!⊘
Do you want full access?
Subscribe today to unlock all pages.

Trusted by 1+ million students worldwide

9INTRODUCTION TO ACCOUNTING AND FINANCE
Reference
Blackmores.com.au. 2017. Blackmores vitamins and supplements- Australia's most trusted.
[online] Available at: https://www.blackmores.com.au/ [Accessed 19 Oct. 2017].
De Fiore, F. and Uhlig, H., 2015. Corporate debt structure and the financial crisis. Journal of
Money, credit and Banking, 47(8), pp.1571-1598.
Della Seta, M., Morellec, E. and Zucchi, F., 2015. Debt structure, rollover traps, and default
risk. Working Paper.
InvestSMART. 2017. Blackmores Limited. [online] Available at:
https://www.investsmart.com.au/shares/asx-bkl/blackmores-limited [Accessed 19 Oct. 2017].
Valta, P., 2016. Strategic default, debt structure, and stock returns. Journal of Financial and
Quantitative Analysis, 51(1), pp.197-229.
Paraphrase This Document
Need a fresh take? Get an instant paraphrase of this document with our AI Paraphraser

10INTRODUCTION TO ACCOUNTING AND FINANCE
1 out of 11
Related Documents
Your All-in-One AI-Powered Toolkit for Academic Success.
+13062052269
info@desklib.com
Available 24*7 on WhatsApp / Email
Unlock your academic potential
Copyright © 2020–2025 A2Z Services. All Rights Reserved. Developed and managed by ZUCOL.


