HI5002 Finance for Business: Comparative Analysis of GWA and Downer
VerifiedAdded on 2023/06/03
|18
|4453
|311
Report
AI Summary
This report presents a comprehensive financial analysis of two ASX-listed companies, GWA Limited and Downer Group Limited, with the aim of providing investment advice to a wealthy investor. The analysis includes a description of the operations and comparative advantages of both companies, calculation and comparison of performance ratios (liquidity, efficiency, profitability, leverage, and investor ratios) over a three-year period (2015-2017), analysis of monthly share price movements, identification of significant factors influencing share prices, and calculation of Beta values and expected rates of return using the CAPM. The report concludes with a recommendation based on the comparative financial performance of the two companies, focusing on their financial stability, market efficiency, and potential for profitability.
HI5002: FINANCE FOR BUSINESS
Paraphrase This Document
Need a fresh take? Get an instant paraphrase of this document with our AI Paraphraser
Table of contents
Introduction......................................................................................................................................3
Description of operation and comparative advantages of the two chosen companies.....................3
Description of the companies..........................................................................................................4
Calculation and comparison of performance ratios of the two companies......................................5
Analysis of monthly share prices movements of the two companies within 3 years....................12
Identify any significant factors which may have influenced the share price of your chosen
companies during the time frame..................................................................................................14
Calculation of Beta values and expected Rates of Return using the CAPM of the two chosen
companies......................................................................................................................................14
Letter Recommendation.................................................................................................................16
Conclusion.....................................................................................................................................17
References......................................................................................................................................18
Page 2 of 18
Introduction
In the modern way financial decision, making process evaluation of invest in securities market is
very important. It can be stated that the evaluation of company is financial and market position
is very important to check the viability of the investment that is to be made in the company for
future operational activities. It can be said that investing in capital markets is full of uncertainty
and risk hence proper evaluation of the marketing standards of the company is very important to
look out for effective measure that can be taken before investing into a firm. The liquidity,
efficiency and stability of the company have to be analyzed before making a decision regarding
investment of the monetary funds into the company. Historical movement of share price
regarding the firm has also to be shared and analyzed in order to make an affect business invent
decision. As analyst, it is the responsibility to assets both the financial and marketing standards
of the company compare two options and make a better investment decision. In this project there
will be evaluation over two firm namely GWA Limited and Downer Group Limited which are
listed on the ASX in order choose a better company for further investment. Both financial and
marketing aspect of the company will be analyzed to generate an effective understanding on
whether the investor should invest in either of these companies and which is the better company
to invest in which will increase the profitability of the investor through the investment process.
Description of operation and comparative advantages of the two chosen
companies
The study is conducted in the aspects and factors of the two selected companies form the ASX
listings which are part of materials industry. In this context, it can be said that the research has
been conducted on the GWA group and the Downer group in order to get the requirements of the
study according to the needs. In order to get the accurate and suitable information for the study it
can be said that the research must be conducted on the information knowledge gathered from the
websites and reports of the companies during the year. Not only that the several statements and
reports published by the companies also to be identified and observed for the conduction of the
study. Hence the discussion is as follows
Description of the companies
GWA Group
Page 3 of 18
⊘ This is a preview!⊘
Do you want full access?
Subscribe today to unlock all pages.
Trusted by 1+ million students worldwide
The GWA group is considered as the Australia's largest company that supplies the required
building fixtures and fittings during the year. Over the years the company has been providing
several solutions regarding the building and household matters. In the recent surveys and
statements provided by the company it can be said that the company is focusing on the aspects of
the Bathrooms and kitchen business along with stable concentration of the supreme solutions to
the water problems during the year. Not only that the company also owns and distributes an
extensive range of market leading brands such as Caroma, Dorf, Clark, Fowler and Stylus. Thus
it can be stated that the GWA group is one of the greatest and versatile company in the
Australian market that provides several solutions to the household and building problems over
the years. The Australian market and the customers have developed a strong believe in the
services if the company and thus the market valuations of the company has been increasing over
the years (Vogel, 2014). The sustainability and the market preferences of the company has also
been enhanced over the years along with several supports from the Australian Government.
Downer group
Downer group is one of the most oldest companies that are operating in the Australian market as
well as the overseas market over the years. In this context it is also to be added that the Downer
group has the reputation of a company that provides various designs for household accessories
along with the requirements for buildings and fixtures and infrastructure for several economical
solutions over the years. The Downer group has been operating in the Australian market as well
as the New Zealand market over more than 150 years and is listed in the stock exchange of both
of the countries. The Downer group is ASX 100 listed company that owns over 88 percent of
shares in the Spotless Group Holdings Limited. Not the Downer group establishes firm market
profitability but also the company has focused on developing the relationships between the
marketing outlets and the customers over the years. In this manner the Downer group also
employs approximately 56000 people in over 300 sites between Australia and New Zealand
market (Kallala et al. 2015).
Calculation and comparison of performance ratios of the two companies
Ratio Formulas GWA Downer Group
Page 4 of 18
Paraphrase This Document
Need a fresh take? Get an instant paraphrase of this document with our AI Paraphraser
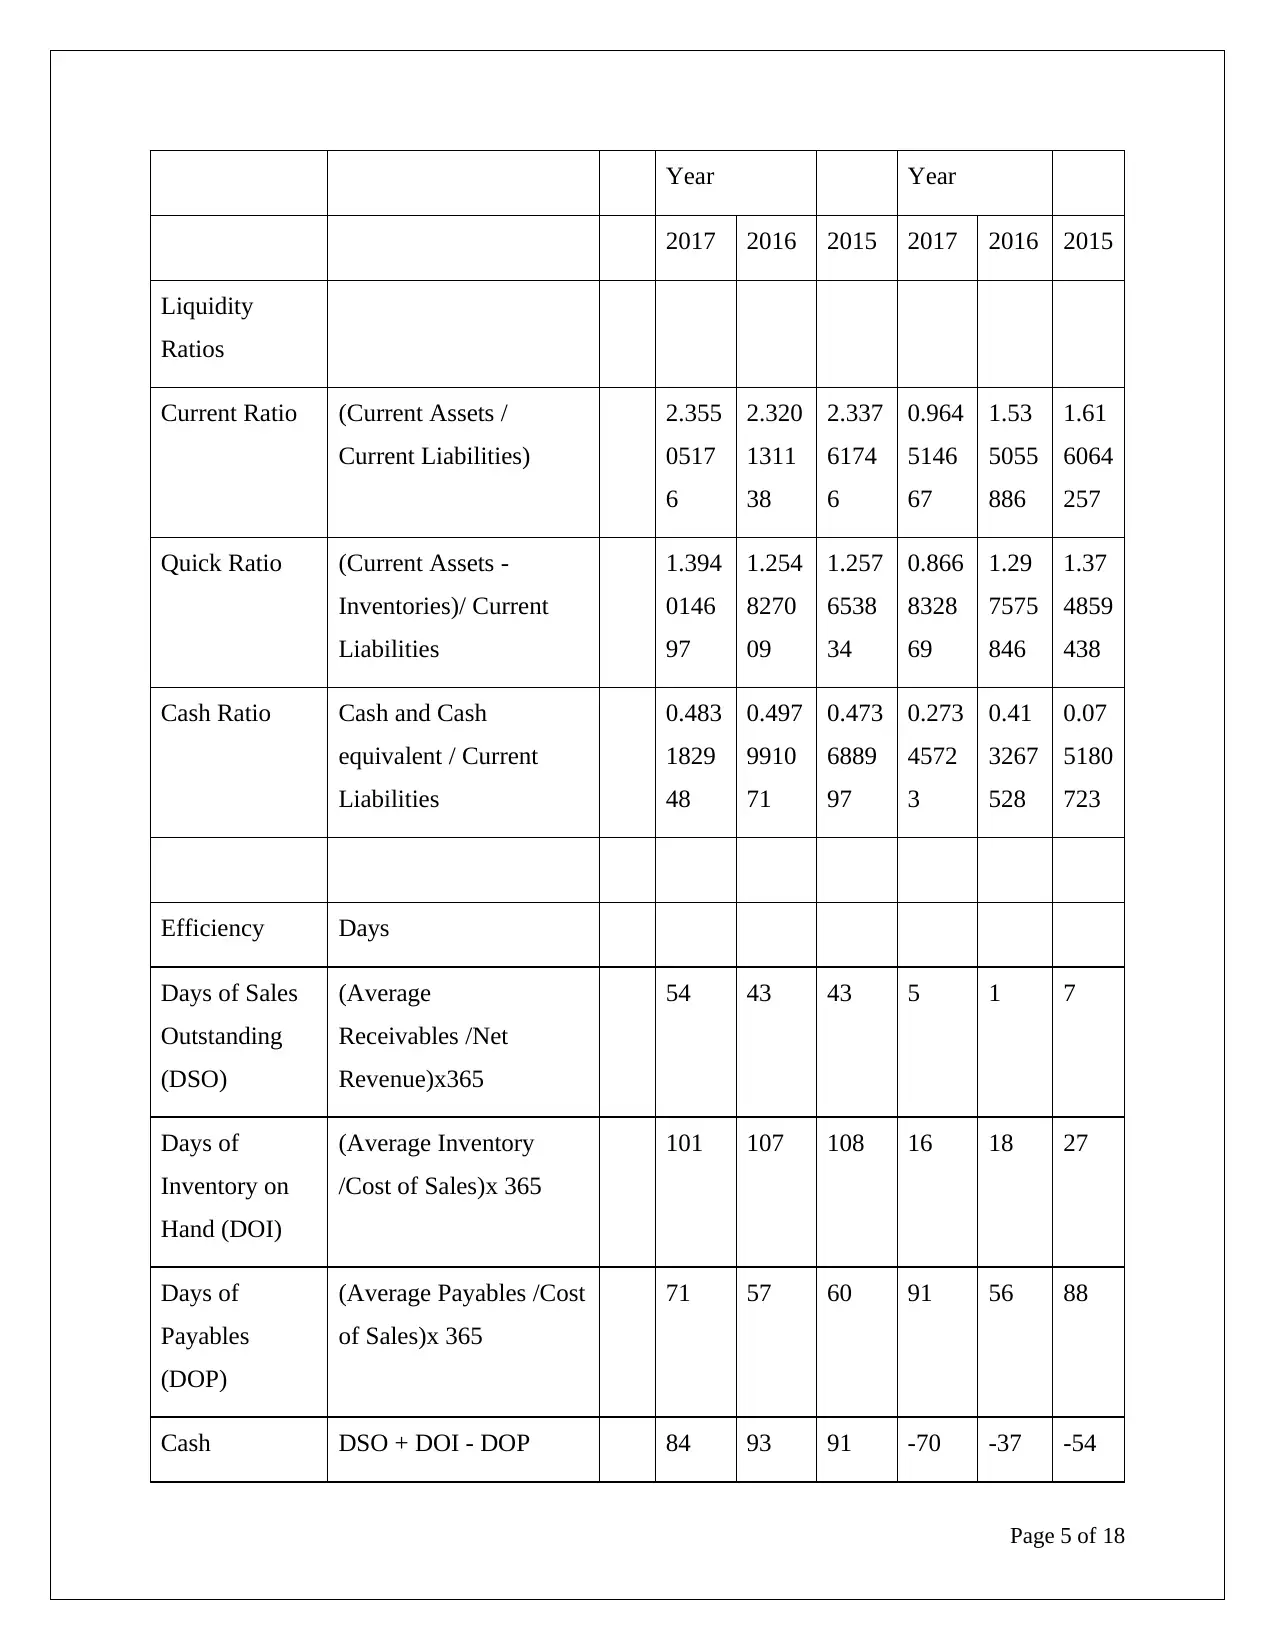
Year Year
2017 2016 2015 2017 2016 2015
Liquidity
Ratios
Current Ratio (Current Assets /
Current Liabilities)
2.355
0517
6
2.320
1311
38
2.337
6174
6
0.964
5146
67
1.53
5055
886
1.61
6064
257
Quick Ratio (Current Assets -
Inventories)/ Current
Liabilities
1.394
0146
97
1.254
8270
09
1.257
6538
34
0.866
8328
69
1.29
7575
846
1.37
4859
438
Cash Ratio Cash and Cash
equivalent / Current
Liabilities
0.483
1829
48
0.497
9910
71
0.473
6889
97
0.273
4572
3
0.41
3267
528
0.07
5180
723
Efficiency Days
Days of Sales
Outstanding
(DSO)
(Average
Receivables /Net
Revenue)x365
54 43 43 5 1 7
Days of
Inventory on
Hand (DOI)
(Average Inventory
/Cost of Sales)x 365
101 107 108 16 18 27
Days of
Payables
(DOP)
(Average Payables /Cost
of Sales)x 365
71 57 60 91 56 88
Cash DSO + DOI - DOP 84 93 91 -70 -37 -54
Page 5 of 18
Conversion
Cycle (CCC)
Profitability
Ratios
%
Gross Profit
Margin (GPM)
(Gross Profit / Revenue) 42% 41% 40% 9% 4% 5%
Operating
Profit Margin
(OPM)
(Operating Profit /
Revenue)
42% 41% 40% 9% 4% 5%
Net Profit
Margin (NPM)
(Net Income / Revenue) 12% 12% 12% 2% 3% 4%
Return on
Capital
Employed
(ROCE)
(operating profit/
Average Total Capital
employed)
42% 41% 39% 16% 10% 8%
Return on
Equity (ROE)
(Net Income / Average
Equity)
17% 17% 18% 5% 9% 9%
Return on
Assets
(Net profit / Total
Assets)
10% 11% 10% 2% 4% 4%
Leverage
Ratios
Debt-to-Equity
Ratio (D/E)
(Total Debt / Total
Equity)
0.35 0.39 0.37 0.16 0.29 0.30
Page 6 of 18
⊘ This is a preview!⊘
Do you want full access?
Subscribe today to unlock all pages.
Trusted by 1+ million students worldwide
Debt-to-Assets
Ratio
(Total Debt / Total
Assets)
0.22 0.23 0.22 0.08 0.14 0.15
Gearing (Total debt / (Total
debt+Total Equity)
0.26 0.28 0.27 0.14 0.22 0.23
Interest
Coverage
(EBIT / Interest) 31.45 25.65 81.26 16.45 6.89 7.17
Investor Ratios
EPS Net profit attributable to
ordinary shareholders /
WANS
2749.
43
2589.
47
2723.
59
4.96 4.94 4.54
Dividend Yield Dividend per share /
share price
20.22 19.58 18.13 35.00 35.9
0
34.0
0
Dividend
Payout
Dividend per share /
EPS
0.01 0.01 0.01 7.06 7.27 7.49
Price-Earnings Share price / EPS 0.00 0.00 0.00 0.20 0.20 0.22
Notes Current Assets $
177,2
20.00
$
166,3
07.00
$
154,2
36.00
$
2,979
.00
$
2,11
5.00
$
2,01
2.00
Current Liabilities $ $ $ $ $ $
Page 7 of 18
Paraphrase This Document
Need a fresh take? Get an instant paraphrase of this document with our AI Paraphraser
75,25
1.00
71,68
0.00
65,98
0.00
3,088
.60
1,37
7.80
1,24
5.00
Inventories $
72,31
9.00
$
76,36
1.00
$
71,25
6.00
$
301.7
0
$
327.
20
$
300.
30
Cash $
36,36
0.00
$
35,69
6.00
$
31,25
4.00
$
844.6
0
$
569.
40
$
93.6
0
Accounts Receivables $
65,86
2.00
$
51,98
3.00
$
51,23
4.00
$
105.6
0
$
17.3
0
$
93.6
0
Net Revenue $
446,3
32.00
$
439,6
66.00
$
430,2
55.00
$
7,287
.40
$
6,85
0.00
$
5,01
2.00
Cost of Sales $
260,3
61.00
$
259,9
24.00
$
241,5
69.00
$
7,032
.00
$
6,59
0.00
$
4,10
0.00
Accounts Payables $
50,78
3.00
$
40,51
0.00
$
39,56
4.00
$
1,761
.00
$
1,01
0.90
$
983.
60
Page 8 of 18
1.00
71,68
0.00
65,98
0.00
3,088
.60
1,37
7.80
1,24
5.00
Inventories $
72,31
9.00
$
76,36
1.00
$
71,25
6.00
$
301.7
0
$
327.
20
$
300.
30
Cash $
36,36
0.00
$
35,69
6.00
$
31,25
4.00
$
844.6
0
$
569.
40
$
93.6
0
Accounts Receivables $
65,86
2.00
$
51,98
3.00
$
51,23
4.00
$
105.6
0
$
17.3
0
$
93.6
0
Net Revenue $
446,3
32.00
$
439,6
66.00
$
430,2
55.00
$
7,287
.40
$
6,85
0.00
$
5,01
2.00
Cost of Sales $
260,3
61.00
$
259,9
24.00
$
241,5
69.00
$
7,032
.00
$
6,59
0.00
$
4,10
0.00
Accounts Payables $
50,78
3.00
$
40,51
0.00
$
39,56
4.00
$
1,761
.00
$
1,01
0.90
$
983.
60
Page 8 of 18
Gross Profit $
185,9
71.00
$
179,7
42.00
$
173,5
64.00
$
677.8
0
$
276.
90
$
233.
60
Net Profit $
53,67
1.00
$
53,68
1.00
$
53,21
6.00
$
181.5
0
$
180.
60
$
176.
35
Capital Employed(Total
Assets - Current
Liabilities)
$
443,0
13.00
$
439,1
79.00
$
443,2
56.00
$
4,366
.80
$
2,82
2.50
$
2,86
1.50
Equity $
320,6
03.00
$
307,6
98.00
$
302,5
64.00
$
3,586
.50
$
2,08
8.50
$
1,98
5.30
Debt $
112,0
00.00
$
120,0
00.00
$
112,4
57.00
$
581.8
0
$
604.
50
$
601.
20
Total Assets $
518,2
64.00
$
510,8
59.00
$
509,2
36.00
$
7,455
.40
$
4,20
0.30
$
4,10
6.50
Page 9 of 18
⊘ This is a preview!⊘
Do you want full access?
Subscribe today to unlock all pages.
Trusted by 1+ million students worldwide
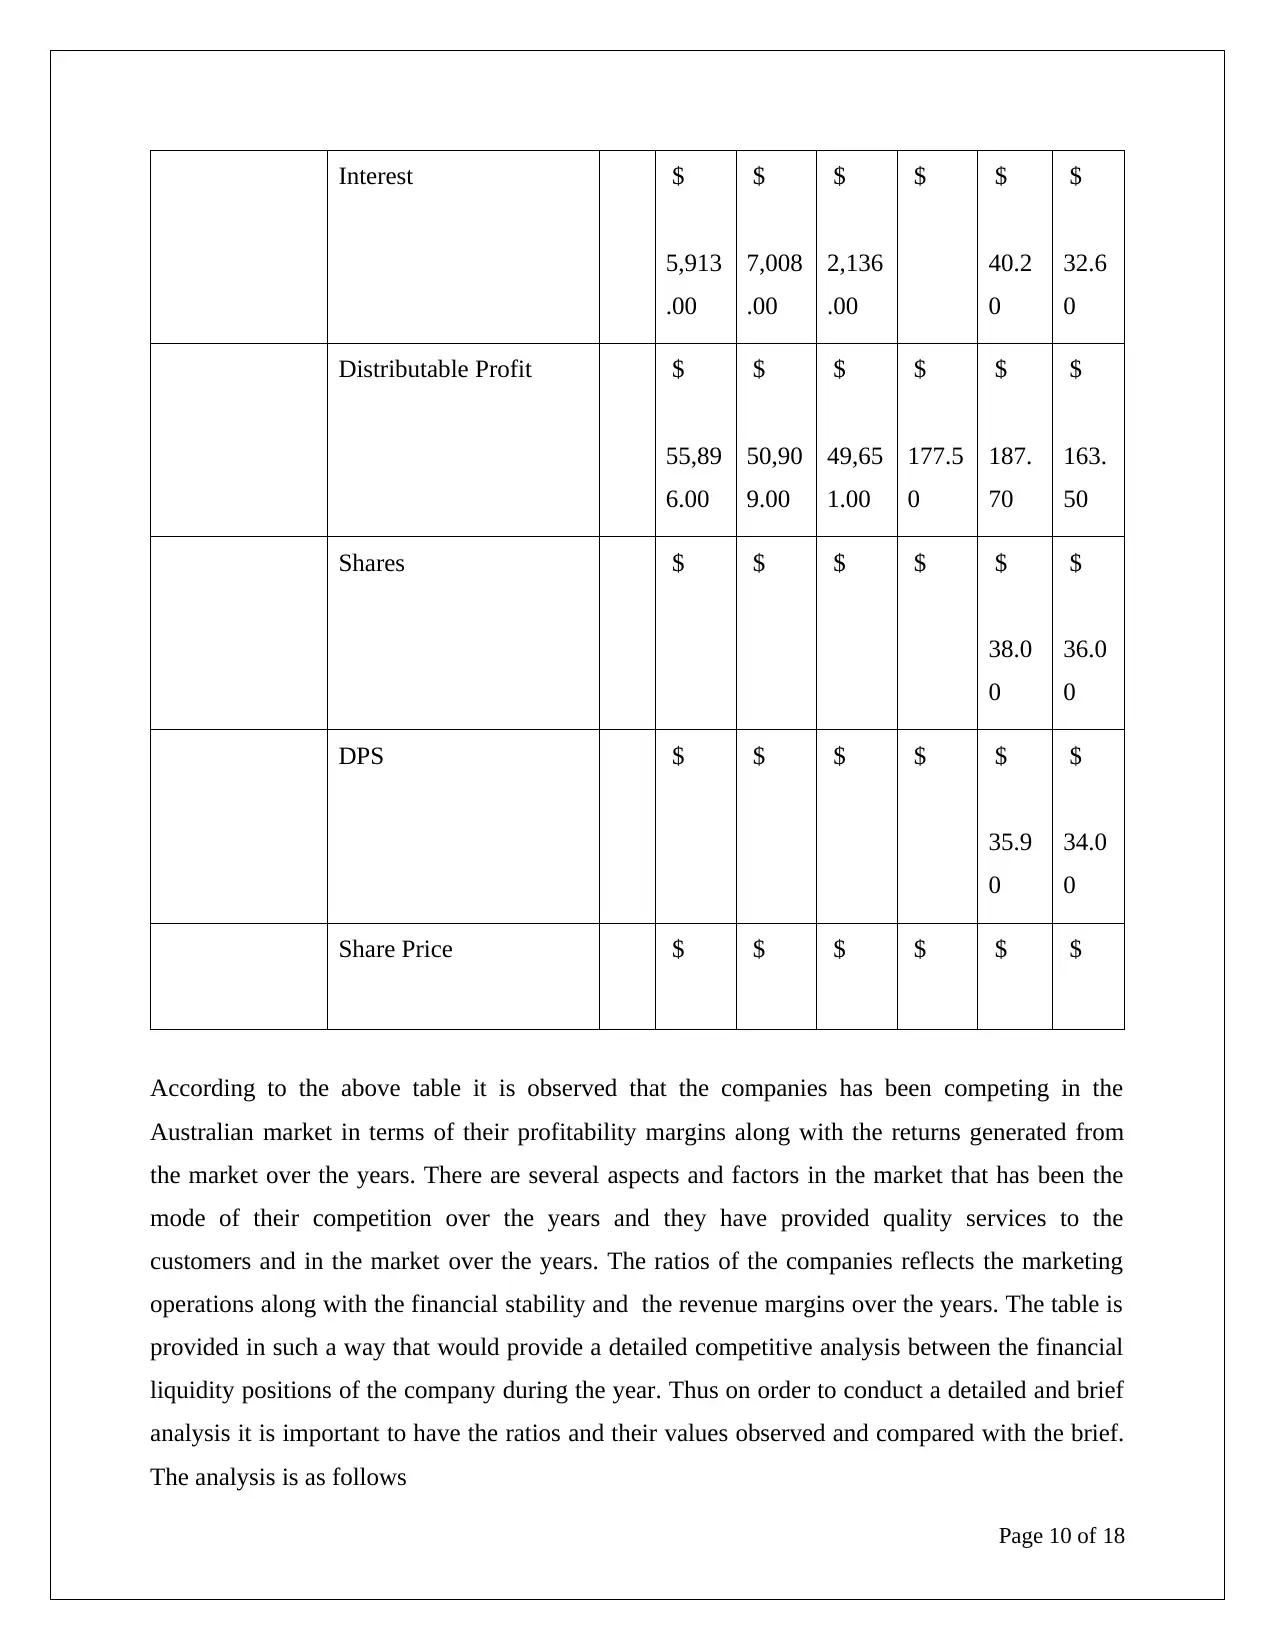
Interest $
5,913
.00
$
7,008
.00
$
2,136
.00
$ $
40.2
0
$
32.6
0
Distributable Profit $
55,89
6.00
$
50,90
9.00
$
49,65
1.00
$
177.5
0
$
187.
70
$
163.
50
Shares $ $ $ $ $
38.0
0
$
36.0
0
DPS $ $ $ $ $
35.9
0
$
34.0
0
Share Price $ $ $ $ $ $
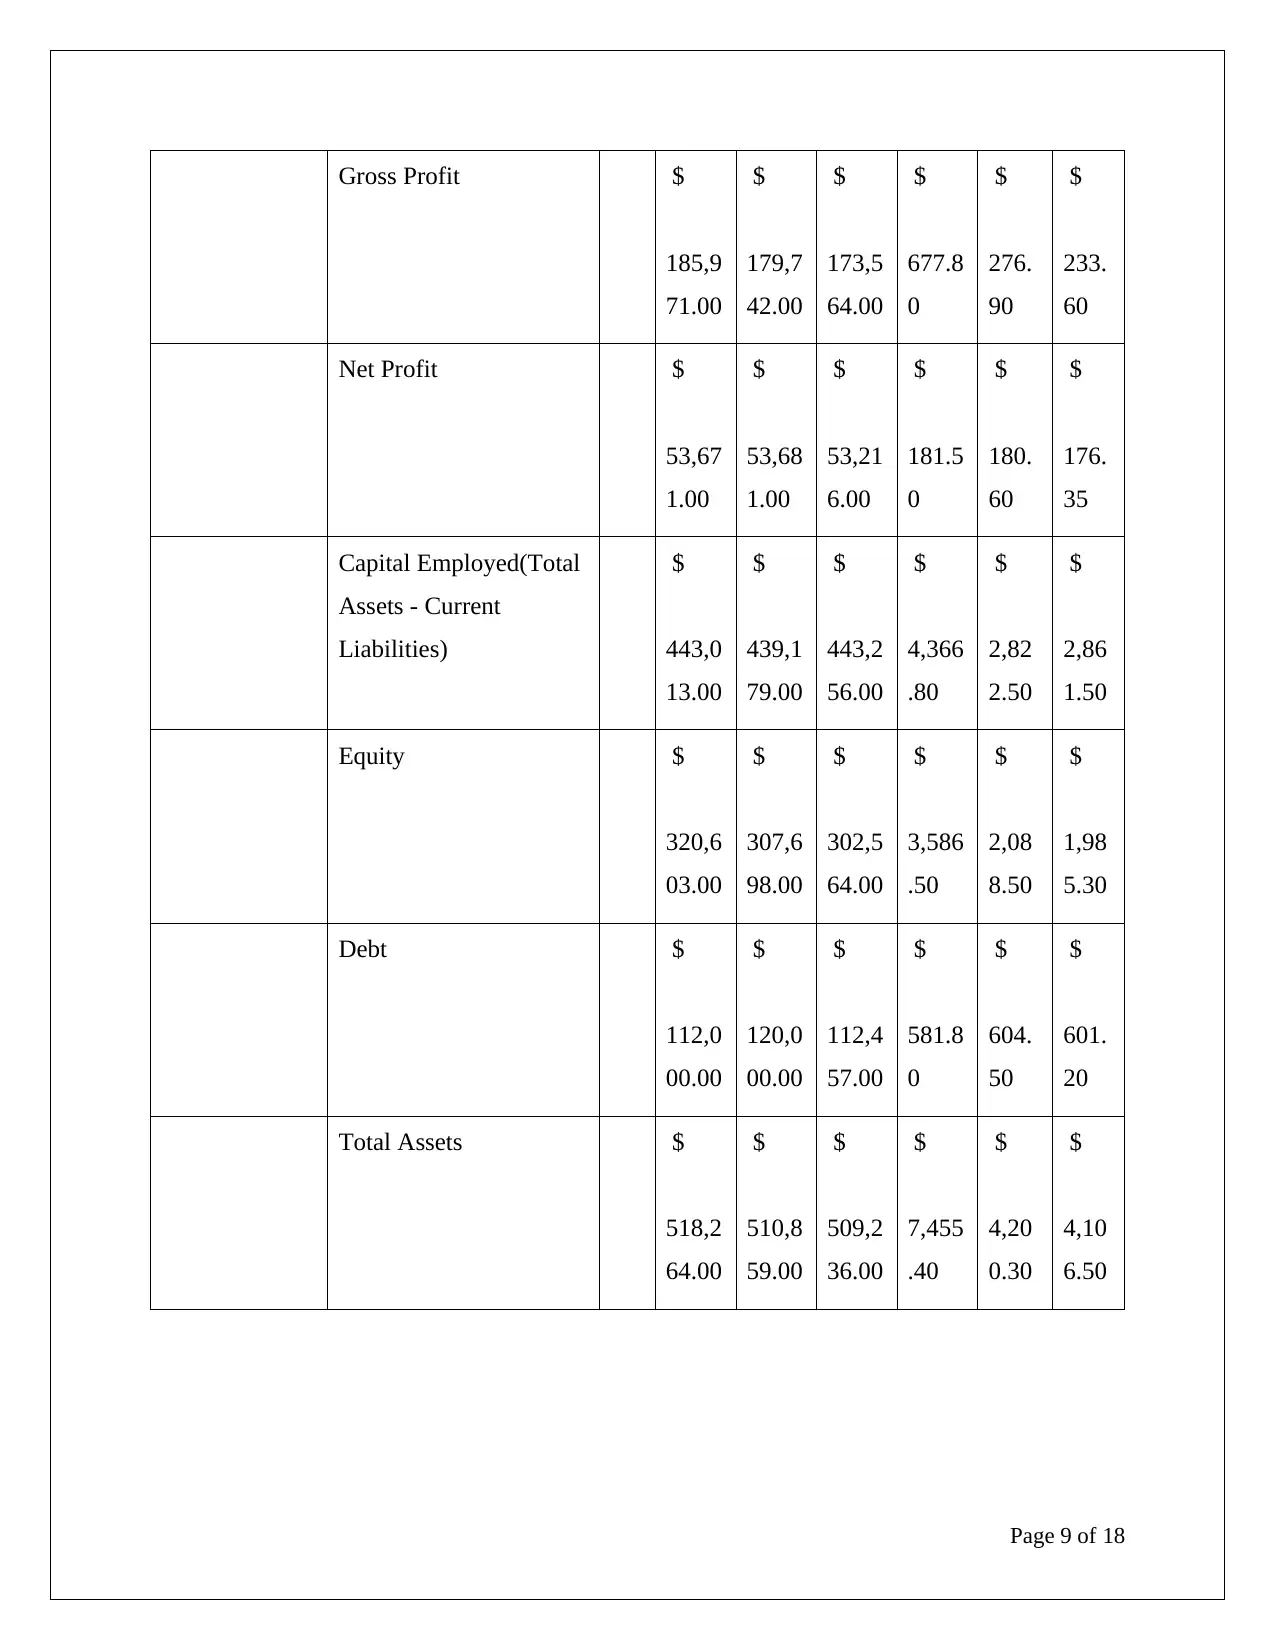
According to the above table it is observed that the companies has been competing in the
Australian market in terms of their profitability margins along with the returns generated from
the market over the years. There are several aspects and factors in the market that has been the
mode of their competition over the years and they have provided quality services to the
customers and in the market over the years. The ratios of the companies reflects the marketing
operations along with the financial stability and the revenue margins over the years. The table is
provided in such a way that would provide a detailed competitive analysis between the financial
liquidity positions of the company during the year. Thus on order to conduct a detailed and brief
analysis it is important to have the ratios and their values observed and compared with the brief.
The analysis is as follows
Page 10 of 18
5,913
.00
$
7,008
.00
$
2,136
.00
$ $
40.2
0
$
32.6
0
Distributable Profit $
55,89
6.00
$
50,90
9.00
$
49,65
1.00
$
177.5
0
$
187.
70
$
163.
50
Shares $ $ $ $ $
38.0
0
$
36.0
0
DPS $ $ $ $ $
35.9
0
$
34.0
0
Share Price $ $ $ $ $ $
According to the above table it is observed that the companies has been competing in the
Australian market in terms of their profitability margins along with the returns generated from
the market over the years. There are several aspects and factors in the market that has been the
mode of their competition over the years and they have provided quality services to the
customers and in the market over the years. The ratios of the companies reflects the marketing
operations along with the financial stability and the revenue margins over the years. The table is
provided in such a way that would provide a detailed competitive analysis between the financial
liquidity positions of the company during the year. Thus on order to conduct a detailed and brief
analysis it is important to have the ratios and their values observed and compared with the brief.
The analysis is as follows
Page 10 of 18
Paraphrase This Document
Need a fresh take? Get an instant paraphrase of this document with our AI Paraphraser
Efficiency ratios
The efficiency ratios has been the sole indicators of the company's financial efficiency in
generating market profits and returns over the years with the accurate utilisation of their assets.
The efficiency ratios has a positive relations with the company as the increase in the ratios values
indicates positive efficiency margins for the companies in the year (Nesticò and Pipolo, 2015).
According to the table it can observed that the GWA has efficiencies ratios that are well passed
in comparison with the Downer group. This shows that the GWA has been the dominators in
regards with market efficiencies during the current financial years, as they are able to generate
accurate figures positive valuations in their market payables and cash cycles during the period.
Liquidity ratios
The liquidity ratios are considered as ratios that indicates the company's financial liquidity and
the ability to minimize their market debt in short term period along with their liabilities with the
usage of the company assets and resources during the year. In this context it is to be added that
the liquidity ratios in postive figure indicates the higher liquidity abilities of the firm during the
year (Blum and Dacorogna, 2014). In this context it can be added that the GWA groups has the
upper hand in respect of the liquidity ratios as the company has higher liquidity margins and
valuations in comparison with the Downer Group for the past three years. Hence this proves that
the GWA has been able to generate higher margins of market profitability along with their
revenues with slight increase in marketing expenses which are compensated against the extra
revenues. Thus, the company has better and higher net profitability that helped them to minimize
their short term liabilities and market debt better than the Downer group during the year.
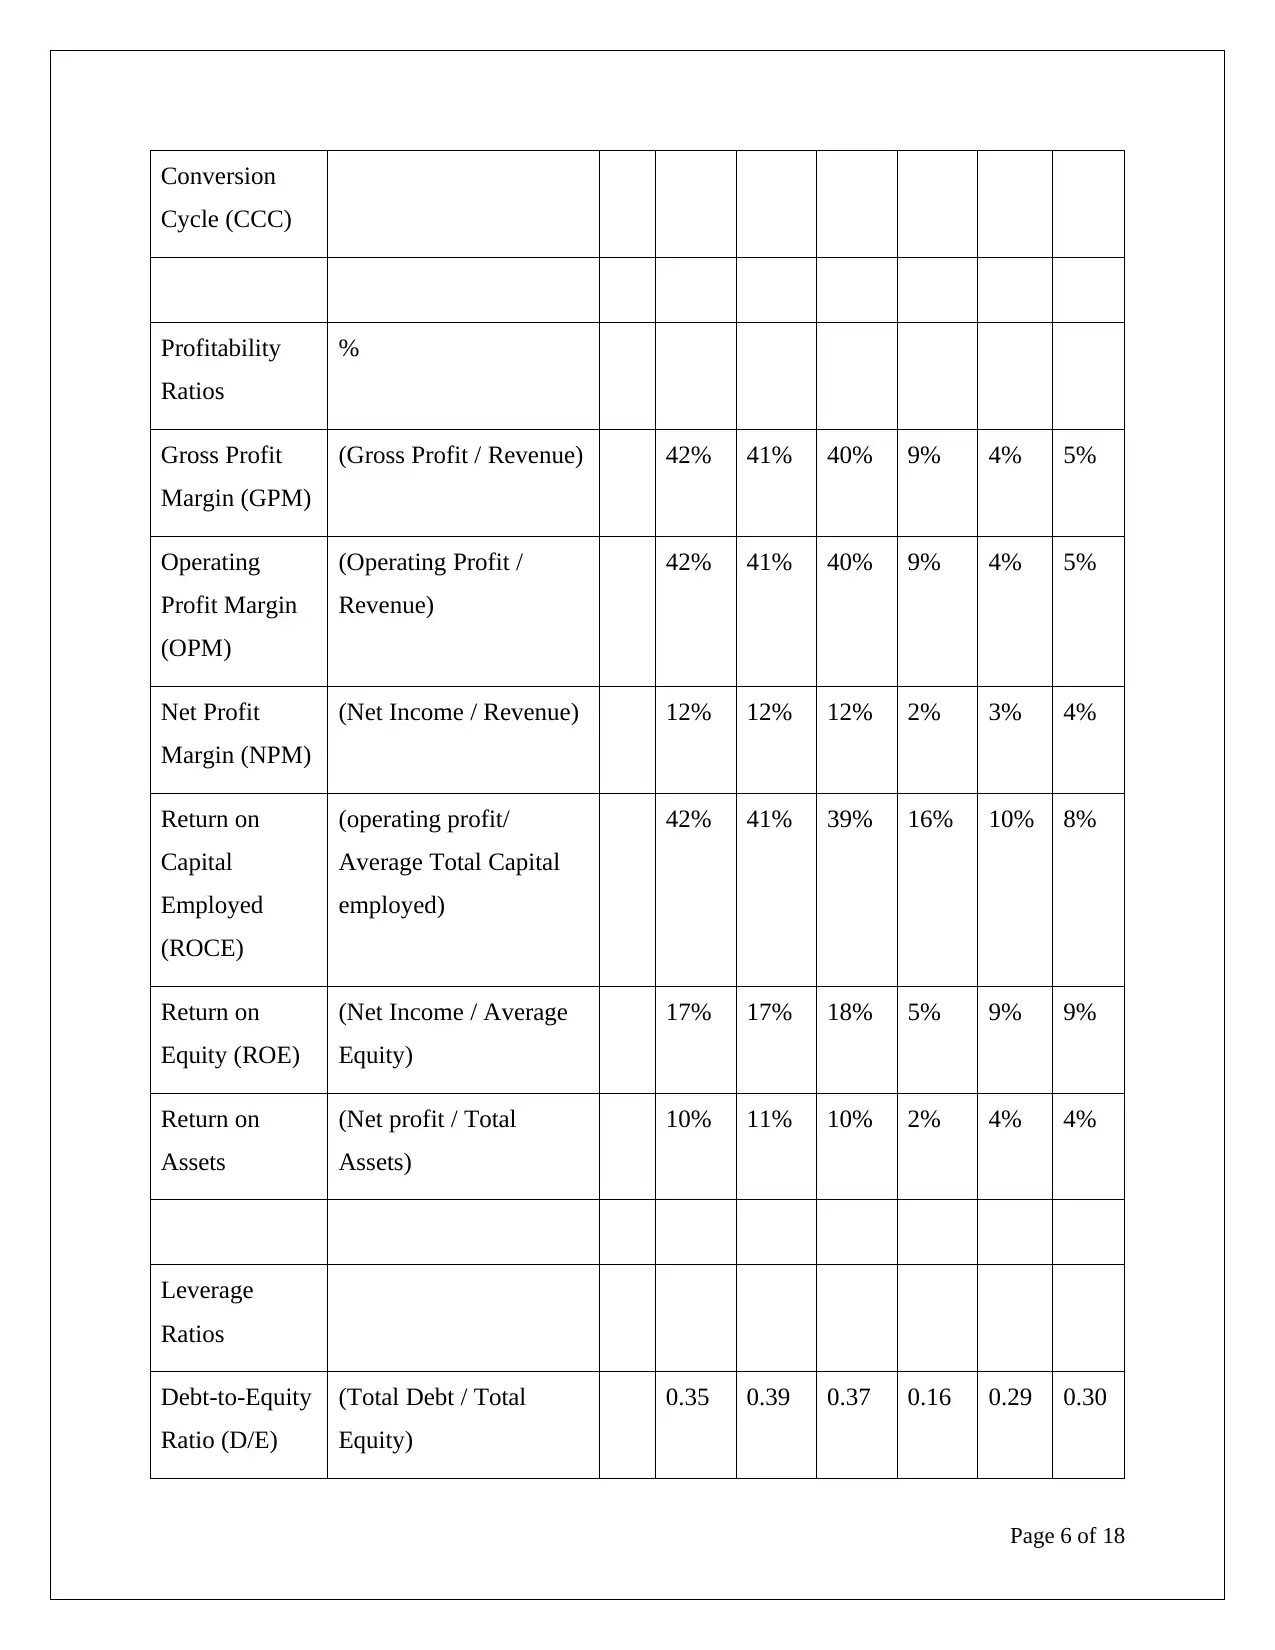
Profitability ratios
The profitability ratios has been the sole indicators of the company's profitability margins along
with the core financial strengths in generating market profits and returns over the years with the
accurate utilization of their marketing strategies and operating plans. The profitability ratios has
a positive relations with the company as the increase in the ratios values indicates positive profit
margins for the companies in the year. According to the table it can observed that the GWA has
profitability ratios that are well passed in comparison with the Downer group. This shows that
the GWA has been the dominators in regards with market efficiencies during the current
financial years, as they are able to generate accurate figures positive valuations in their market
payables and cash cycles during the period
Page 11 of 18
The efficiency ratios has been the sole indicators of the company's financial efficiency in
generating market profits and returns over the years with the accurate utilisation of their assets.
The efficiency ratios has a positive relations with the company as the increase in the ratios values
indicates positive efficiency margins for the companies in the year (Nesticò and Pipolo, 2015).
According to the table it can observed that the GWA has efficiencies ratios that are well passed
in comparison with the Downer group. This shows that the GWA has been the dominators in
regards with market efficiencies during the current financial years, as they are able to generate
accurate figures positive valuations in their market payables and cash cycles during the period.
Liquidity ratios
The liquidity ratios are considered as ratios that indicates the company's financial liquidity and
the ability to minimize their market debt in short term period along with their liabilities with the
usage of the company assets and resources during the year. In this context it is to be added that
the liquidity ratios in postive figure indicates the higher liquidity abilities of the firm during the
year (Blum and Dacorogna, 2014). In this context it can be added that the GWA groups has the
upper hand in respect of the liquidity ratios as the company has higher liquidity margins and
valuations in comparison with the Downer Group for the past three years. Hence this proves that
the GWA has been able to generate higher margins of market profitability along with their
revenues with slight increase in marketing expenses which are compensated against the extra
revenues. Thus, the company has better and higher net profitability that helped them to minimize
their short term liabilities and market debt better than the Downer group during the year.
Profitability ratios
The profitability ratios has been the sole indicators of the company's profitability margins along
with the core financial strengths in generating market profits and returns over the years with the
accurate utilization of their marketing strategies and operating plans. The profitability ratios has
a positive relations with the company as the increase in the ratios values indicates positive profit
margins for the companies in the year. According to the table it can observed that the GWA has
profitability ratios that are well passed in comparison with the Downer group. This shows that
the GWA has been the dominators in regards with market efficiencies during the current
financial years, as they are able to generate accurate figures positive valuations in their market
payables and cash cycles during the period
Page 11 of 18
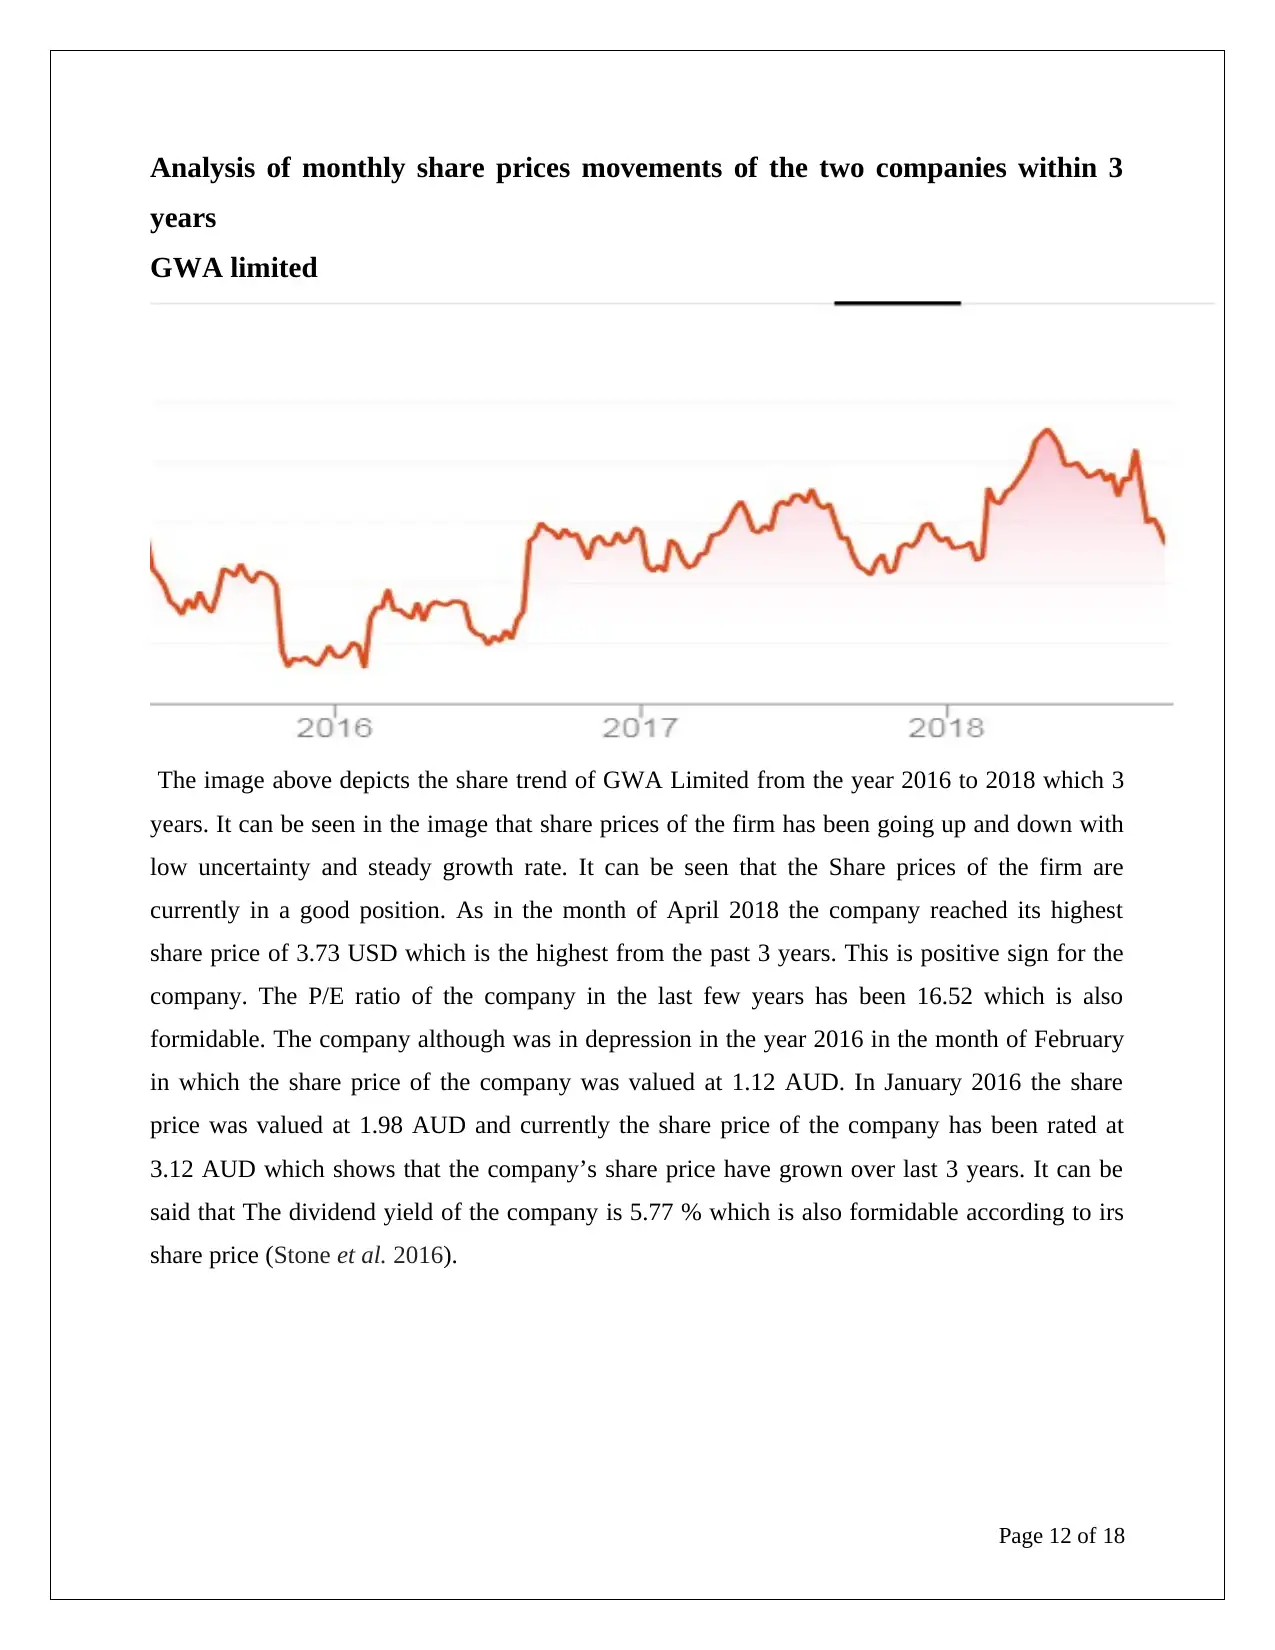
Analysis of monthly share prices movements of the two companies within 3
years
GWA limited
The image above depicts the share trend of GWA Limited from the year 2016 to 2018 which 3
years. It can be seen in the image that share prices of the firm has been going up and down with
low uncertainty and steady growth rate. It can be seen that the Share prices of the firm are
currently in a good position. As in the month of April 2018 the company reached its highest
share price of 3.73 USD which is the highest from the past 3 years. This is positive sign for the
company. The P/E ratio of the company in the last few years has been 16.52 which is also
formidable. The company although was in depression in the year 2016 in the month of February
in which the share price of the company was valued at 1.12 AUD. In January 2016 the share
price was valued at 1.98 AUD and currently the share price of the company has been rated at
3.12 AUD which shows that the company’s share price have grown over last 3 years. It can be
said that The dividend yield of the company is 5.77 % which is also formidable according to irs
share price (Stone et al. 2016).
Page 12 of 18
⊘ This is a preview!⊘
Do you want full access?
Subscribe today to unlock all pages.
Trusted by 1+ million students worldwide
1 out of 18
Related Documents


Your All-in-One AI-Powered Toolkit for Academic Success.
+13062052269
info@desklib.com
Available 24*7 on WhatsApp / Email
![[object Object]](/_next/static/media/star-bottom.7253800d.svg)
Unlock your academic potential
Copyright © 2020–2026 A2Z Services. All Rights Reserved. Developed and managed by ZUCOL.