Finance for Managers Unit 703: Huawei Financial Performance Report
VerifiedAdded on 2023/02/07
|25
|4729
|24
Report
AI Summary
This report provides a comprehensive financial analysis of Huawei, examining its financial performance through various financial statements, including the income statement, balance sheet, and cash flow statement. It delves into key financial ratios such as profitability, liquidity, and efficiency ratios, comparing Huawei's performance with competitors like Apple and Samsung. The report also explores the process of budget creation, considering financial constraints and organizational objectives, as well as assessing budget effectiveness. Furthermore, it identifies criteria for evaluating financial proposals and analyzes the viability of expenditure proposals, offering insights into Huawei's financial health and strategic decision-making. The report utilizes data from Huawei's annual reports and other financial sources to support its analysis and conclusions.
Finance for managers
Unit 703
St Name:
QN:
Dr.:
Date 2022
Unit 703
St Name:
QN:
Dr.:
Date 2022
Paraphrase This Document
Need a fresh take? Get an instant paraphrase of this document with our AI Paraphraser
Table of Contents
Executive Summary.........................................................................................................................3
Introduction......................................................................................................................................4
Task 1...............................................................................................................................................5
1.1: Determine what financial information is needed and assess its validity..............................5
1.2: Analyze different financial documents and information and formulate conclusions about
financial performance levels and needs of stakeholders..............................................................6
1.3: Conduct comparative analysis of financial information and data........................................8
Task 2.............................................................................................................................................12
2.1: Identify how a budget can be produced taking into account financial constraints and
achievement of targets and accounting conventions.................................................................12
2.2: Be able to assess a budget...................................................................................................13
2.3: Identify how a budget for a complex organization can support organizational objectives
and targets whilst taking into account financial constraints and accounting conventions.........15
Task 3.............................................................................................................................................17
3.1: Identify criteria by which proposals can be judged............................................................17
3.2: Critically analyse the viability of a proposal for expenditure............................................18
3.3: Identify the strengths and weaknesses of a proposal and give feedback on the financial
proposal......................................................................................................................................19
3.4: Analyse the viability of a proposal for expenditure...........................................................20
References......................................................................................................................................22
Appendix........................................................................................................................................23
Executive Summary
I selected Huawei as the company to identify what financial data was necessary and to evaluate
its validity. Financial statement creation is a systematic and structured data collection that
adheres to logically consistent accounting practices. The primary objective is to provide a
comprehensive understanding of key financial aspects of a business. It might characterize a
situation at a certain point in time, as in an accounting system, or it can represent a series of
changes throughout a particular time period, as in a financial report. We will examine some
accounting information from Huawei Corporation to obtain a better understanding of the account
names and income statement line items. Typically, a statement of financial condition begins with
the income statement.
⊘ This is a preview!⊘
Do you want full access?
Subscribe today to unlock all pages.
Trusted by 1+ million students worldwide
Introduction
Founded by REN ZHENGFEI in the southern Chinese city of SHENZHEN in 1987, Huawei is a
global provider of ICT infrastructure and smart devices. Starting out, Huawei was an agent for a
HONGKONG firm that made Private Branch Exchanges (PBX). Since the rapid growth of
technology and strategy, Huawei has branched out into three main business groups: the Carrier
Network Business Group, the Enterprise Business Group, and the Consumer Business Group, all
of which are striving to be the best in the world. With operations in over 170 countries and
regions and a workforce of over 194000 people, Huawei is able to provide services to over three
billion people around the world. The company has also set up 36 Joint Innovation Centers and 14
research and development organizations in various locations. In 2019, Huawei's global sales
reached CNY 858.8 billion, an increase of 19.1 percent from the previous year. The company's
net profit was CNY 62.7 billion, an increase of 5.6% over 2018. Operating cash flow increased
to CNY 91.4 Billion, a 22.4% year-on-year increase. Huawei is adamant about devoting 10
percent of its annual revenue to R&D and technological advancement. It invested about CNY
600 billion in R&D over the past decade, or CNY 131.7 billion in 2019. With over 96,000 people
on staff, R&D makes up over half of Huawei's total workforce. Over 90% of Huawei's 85,000+
active patents were issued for inventions as of December 31, 2019.
Paraphrase This Document
Need a fresh take? Get an instant paraphrase of this document with our AI Paraphraser
Task 1
1.1: Determine what financial information is needed and assess its validity.
Financial data help assess a company's financial health. Financial data analysis helps manage and
track finances. A company collects financial data from internal and external sources. Internal
resources are company records; external resources come from outside. Apple, like any other
company, can access this data.
Internal financial data is gathered through the company's accounting system, control functions
such as the sales department, and department managers, suppliers, customers, and workers.
These reports examine the department's finances, giving the accounting and finance division with
spending and earning data. The financial department may easily gather and comprehend data
from these extensive reports to establish the company's financial status.
External sources of financial data include Companies House, the company's website, financial
databases, libraries, and research studies. Internal and external financial data sources often
increase each other's accuracy. It's important to acquire financial data from both sources to
analyze the business's genuine financial situation.
A financial statement is a scientific, chronological compilation of accounting-produced financial
information. It shows a company's stability, financial situation, and other traits. Financial
information is available. The income statement data show a company's annual revenue. It shows
a period's net profit or loss. The balance sheet shows accounting activities, assets, and liabilities
at a given time. It shows owners' stock and debt commitments. The statement of retained
earnings comprises cumulative profits and dividends. We're verifying each fact. These
statements are crucial. Through the aforementioned, users can determine the business's
profitability, liquidity, efficiency, and investment ratios. Profitability ratio measures a company's
efficiency.
The liquidity ratio shows if a corporation has enough cash to cover daily expenses. The
efficiency ratio shows if a corporation can meet its long-term financial needs and create enough
money to pay down its long-term debt plus interest.
1.2: Analyze different financial documents and information and formulate conclusions
about financial performance levels and needs of stakeholders.
So, here are a few key financial papers for a company that serve as the foundation for corporate
finance. These documents are scrutinized by management, shareholders, and creditors in order to
assess a company's financial status. Data from the balance sheet, income statement, and cash
flow statement are used to construct certain important financial ratios.
These ratios are important for both internal and external stakeholders. Insiders are individuals in
administration who are the face of the industry and are directly liable for all of the company's
actions. These statistics also give information to management on the company's earnings,
operations, and efficacy. Financial statements convey all information about a company to other
parties such as banks, creditors, and investors. The income statement details the money earned
and the expenses incurred during a given time period. The statement of cash flow provides
information about the company's financial situation by reporting cash purchase activities.
Profitability ratios are one of the most used approaches for analyzing financial ratios. They have
been used to compute top management profit margins and earnings per share for shareholders.
The liquidity ratio measures a person's capacity to repay debt until it is due. The efficiency ratio
is widely used to evaluate how successfully a corporation firm uses its assets internally.
Last year, the industry recognized Huawei's competitiveness. Best Mobile Innovation for the
Connected Economy, Best Mobile Innovation for the Connected Human, Best Mobile Innovation
for Climate Action, and 5G Industry Partnership Award. Huawei scored 9th on Brand Finance's
list of the world's most valuable brands in 2022, a tribute to our brand's global significance.
⊘ This is a preview!⊘
Do you want full access?
Subscribe today to unlock all pages.
Trusted by 1+ million students worldwide
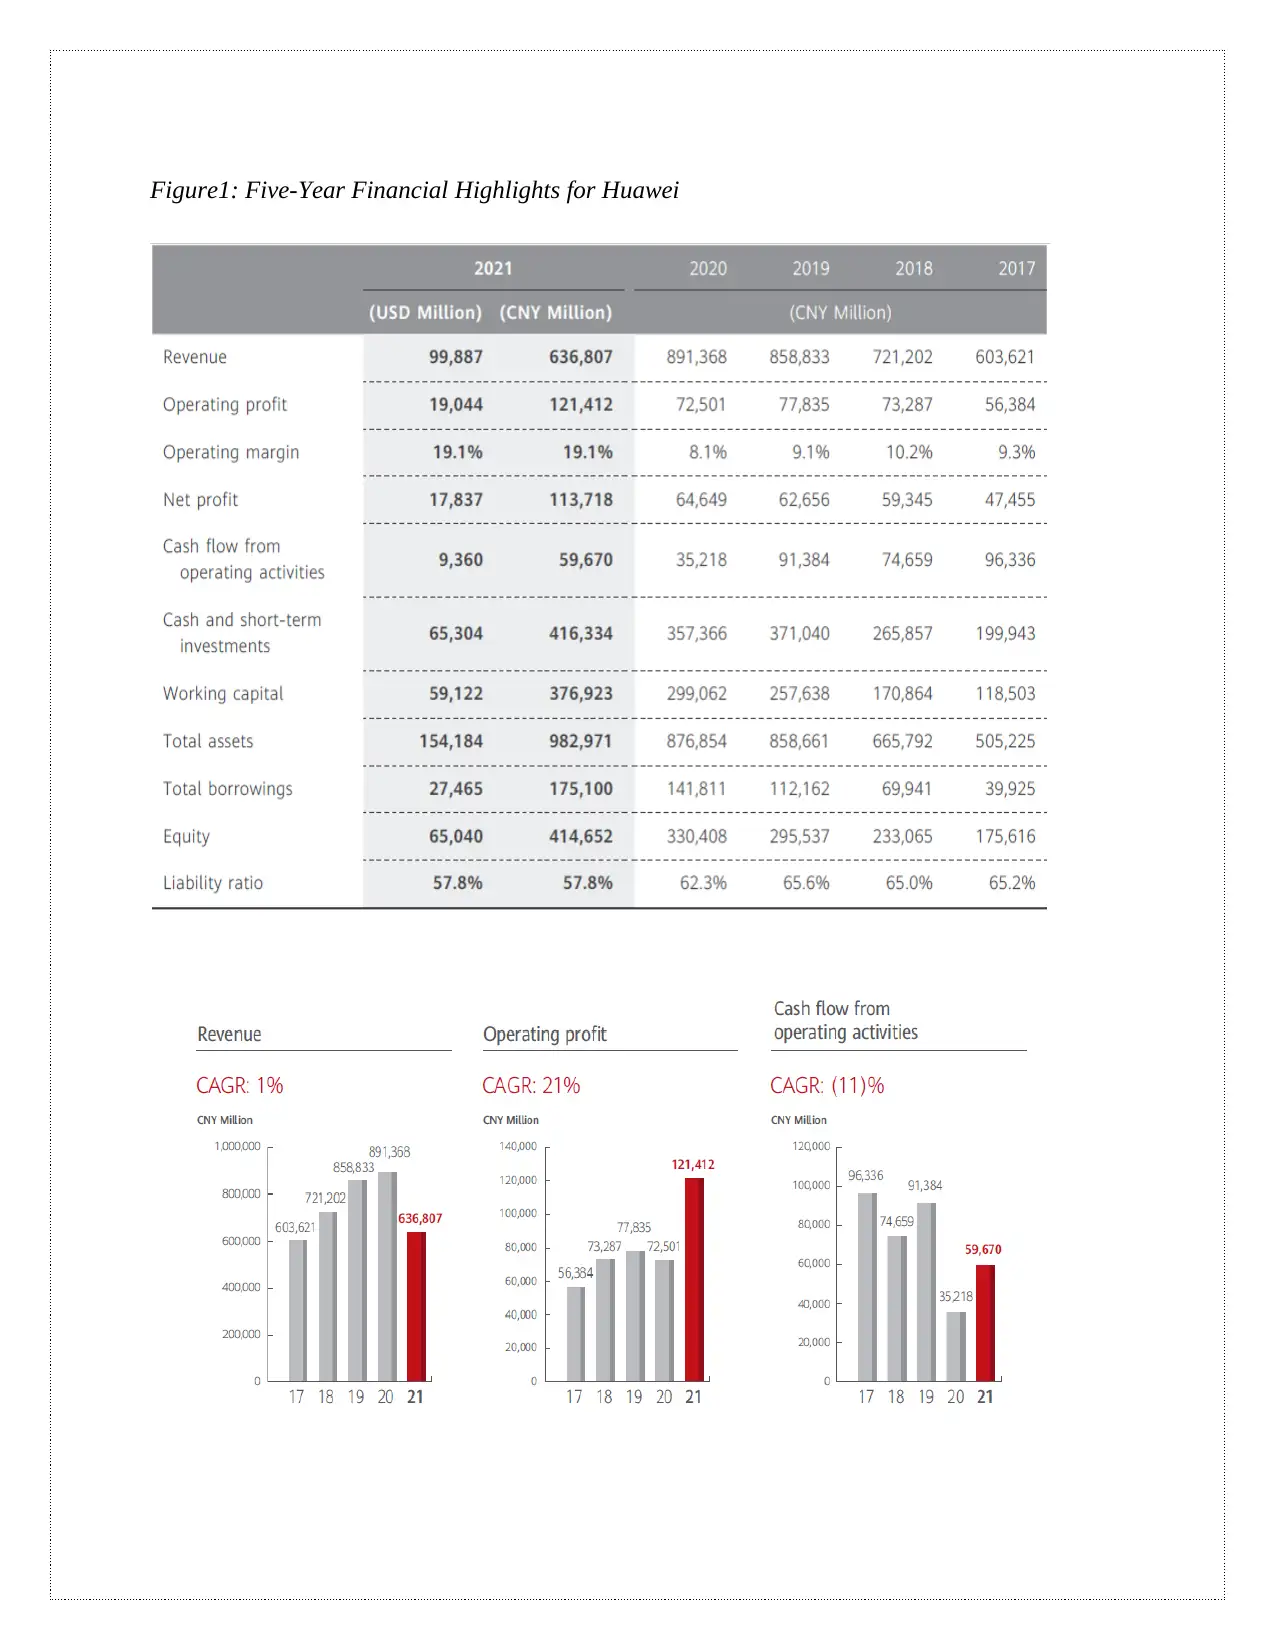
Figure1: Five-Year Financial Highlights for Huawei
Paraphrase This Document
Need a fresh take? Get an instant paraphrase of this document with our AI Paraphraser

Source: Huawei annual report 2021.
1.3: Conduct comparative analysis of financial information and data.
Financial analysis uses financial statements to predict future financial performance and assess a
company's finances (Wild, Subramanyam & Halsey 2007.) This section analyzes the smartphone
industry's finances. First, we'll discuss smartphone profitabilit.
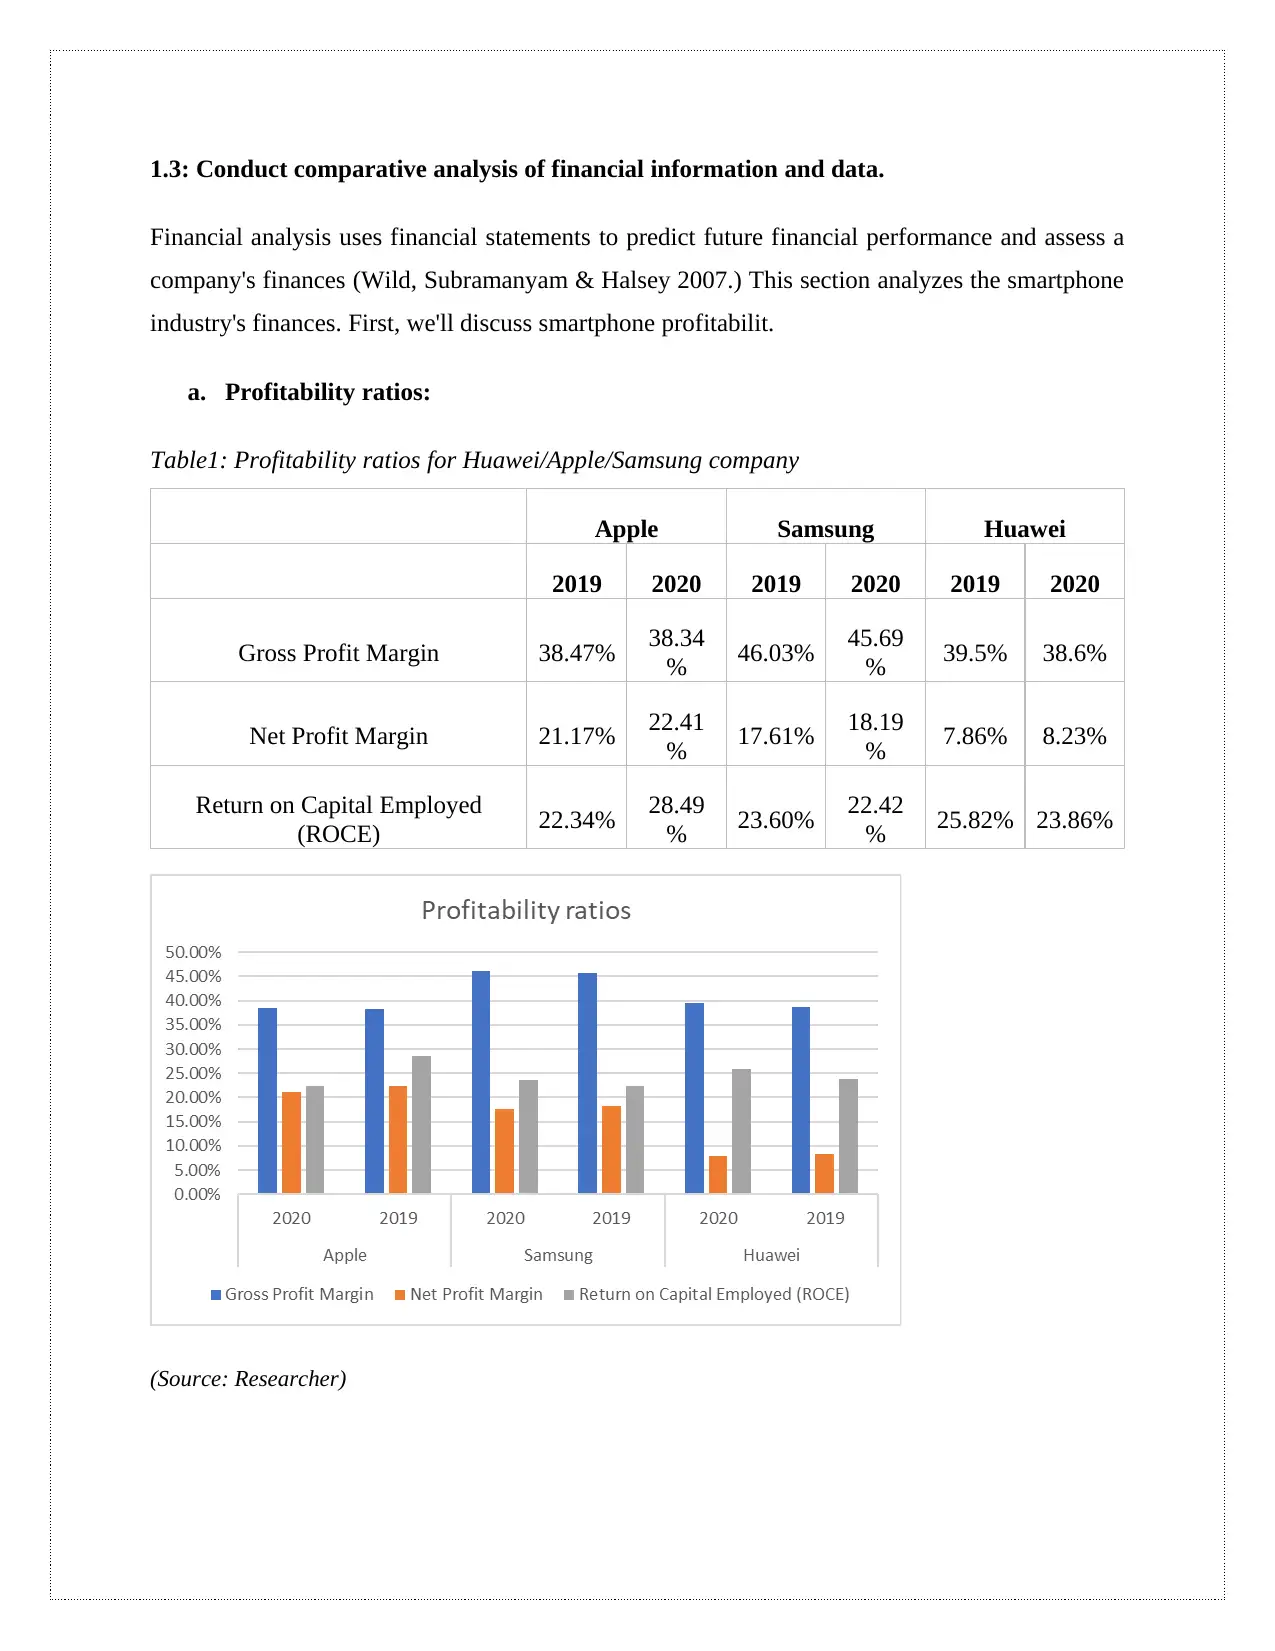
a. Profitability ratios:
Table1: Profitability ratios for Huawei/Apple/Samsung company
Apple Samsung Huawei
2019 2020 2019 2020 2019 2020
Gross Profit Margin 38.47% 38.34
% 46.03% 45.69
% 39.5% 38.6%
Net Profit Margin 21.17% 22.41
% 17.61% 18.19
% 7.86% 8.23%
Return on Capital Employed
(ROCE) 22.34% 28.49
% 23.60% 22.42
% 25.82% 23.86%
(Source: Researcher)
Financial analysis uses financial statements to predict future financial performance and assess a
company's finances (Wild, Subramanyam & Halsey 2007.) This section analyzes the smartphone
industry's finances. First, we'll discuss smartphone profitabilit.
a. Profitability ratios:
Table1: Profitability ratios for Huawei/Apple/Samsung company
Apple Samsung Huawei
2019 2020 2019 2020 2019 2020
Gross Profit Margin 38.47% 38.34
% 46.03% 45.69
% 39.5% 38.6%
Net Profit Margin 21.17% 22.41
% 17.61% 18.19
% 7.86% 8.23%
Return on Capital Employed
(ROCE) 22.34% 28.49
% 23.60% 22.42
% 25.82% 23.86%
(Source: Researcher)
⊘ This is a preview!⊘
Do you want full access?
Subscribe today to unlock all pages.
Trusted by 1+ million students worldwide
Samsung has the best GPM in 2020 and 2019 (45.69%) 46.3% Samsung spends more on
promotion, marketing, and celebrity endorsements despite increased product volume.
Apple and Huawei are pricey. Profitable, but not at full capacity. Both firms are 10% below
Samsung.
Apple's 2017 and 2018 net profit margins are better than rivals'. IDC says Apple sold 77.3
million iPhones in December. Huawei and Samsung each shipped 74.1 million phones.
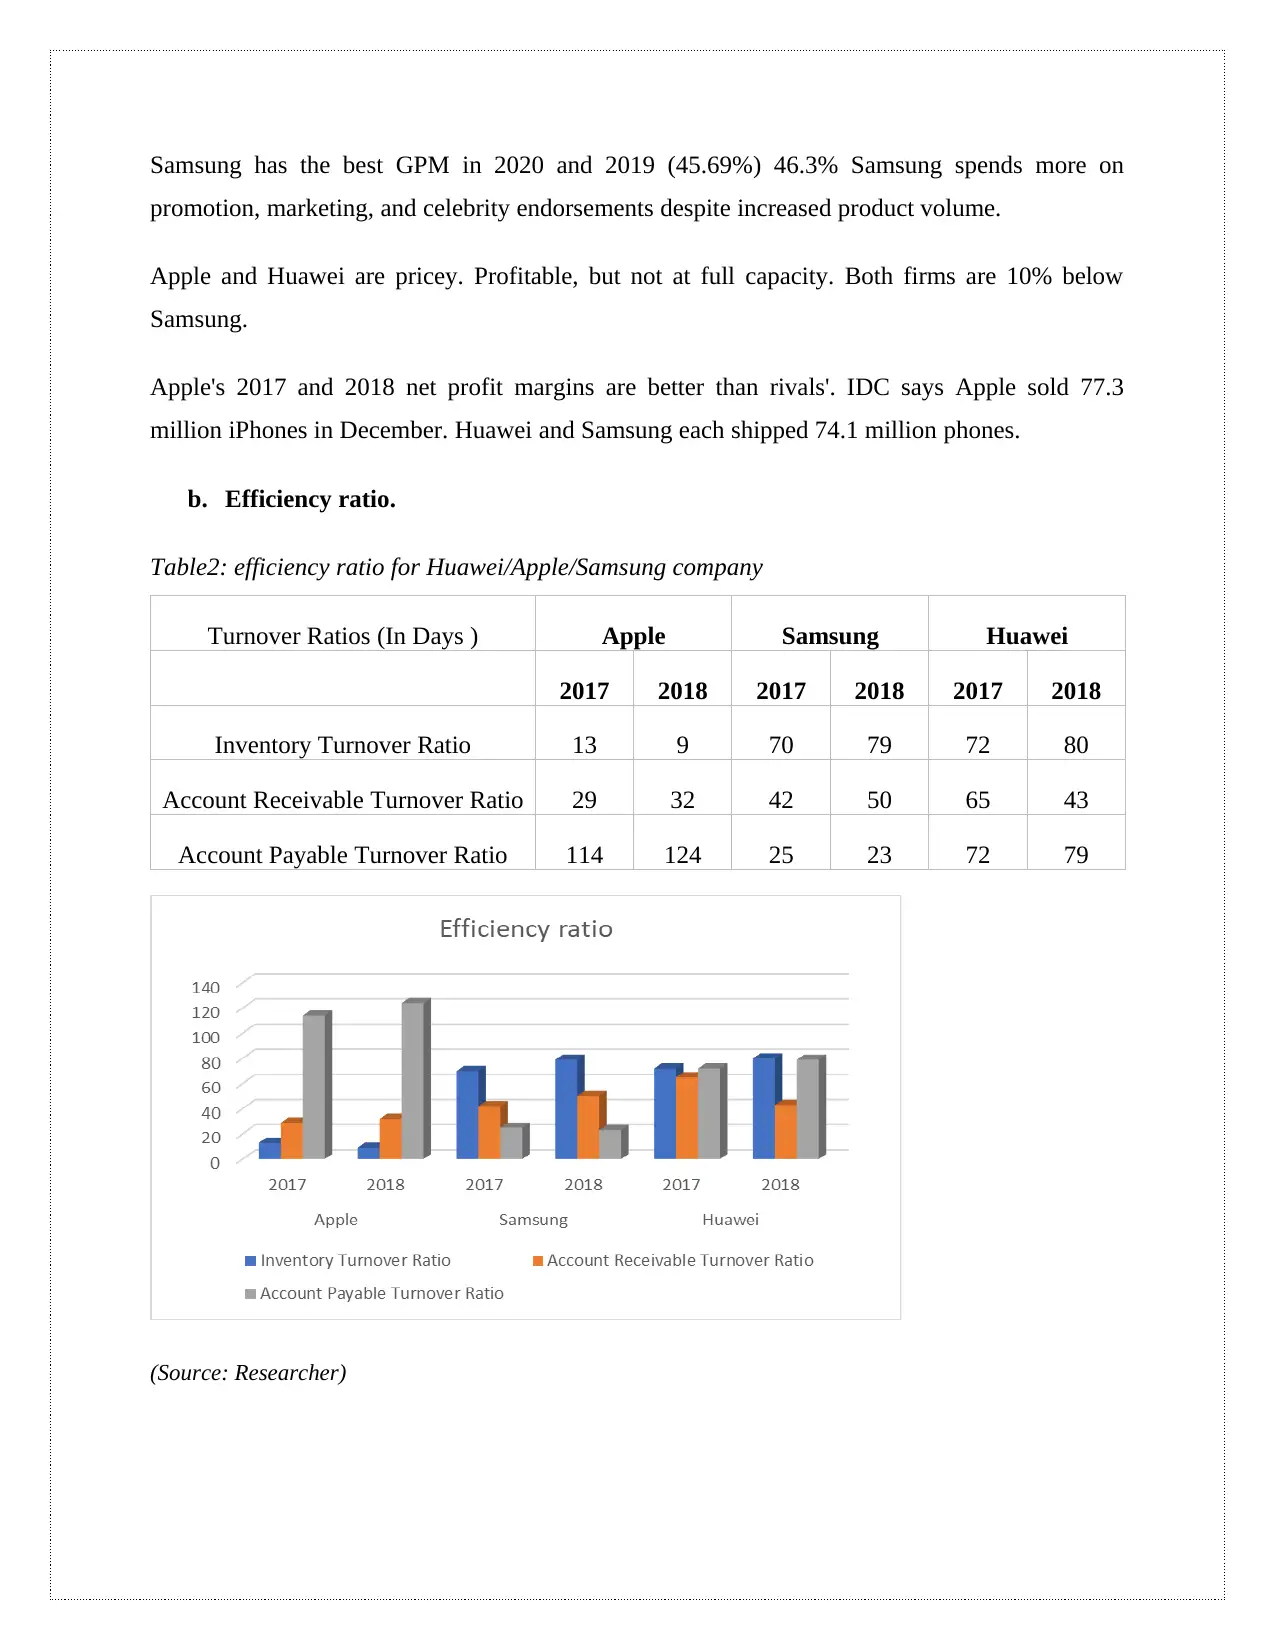
b. Efficiency ratio.
Table2: efficiency ratio for Huawei/Apple/Samsung company
Turnover Ratios (In Days ) Apple Samsung Huawei
2017 2018 2017 2018 2017 2018
Inventory Turnover Ratio 13 9 70 79 72 80
Account Receivable Turnover Ratio 29 32 42 50 65 43
Account Payable Turnover Ratio 114 124 25 23 72 79
(Source: Researcher)
promotion, marketing, and celebrity endorsements despite increased product volume.
Apple and Huawei are pricey. Profitable, but not at full capacity. Both firms are 10% below
Samsung.
Apple's 2017 and 2018 net profit margins are better than rivals'. IDC says Apple sold 77.3
million iPhones in December. Huawei and Samsung each shipped 74.1 million phones.
b. Efficiency ratio.
Table2: efficiency ratio for Huawei/Apple/Samsung company
Turnover Ratios (In Days ) Apple Samsung Huawei
2017 2018 2017 2018 2017 2018
Inventory Turnover Ratio 13 9 70 79 72 80
Account Receivable Turnover Ratio 29 32 42 50 65 43
Account Payable Turnover Ratio 114 124 25 23 72 79
(Source: Researcher)
Paraphrase This Document
Need a fresh take? Get an instant paraphrase of this document with our AI Paraphraser
Customers enjoy Samsung phones. Apple's ratio is lower. Samsung sells 500 phones every
minute. Samsung has more inventory than Apple. If a batch doesn't sell, Samsung will have
surplus inventory and waste production.
Huawei's ratio mirrors Samsung's. This overburdens productivity. Threatening company output.
Huawei's P20, P20 Pro, and P30 smartphones show progress in recent years. Long-term
overproduction can ruin a company.
Samsung (50 days) and Huawei (43 days) have greater AR turnover ratios than Apple (32 days).
We evaluated Apple, Samsung, and Huawei. Apple's ability to give credits and collect cash from
customers may be to blame. Apple is more efficient than Samsung and Huawei.
Apple's accounts payable turnover ratio in 2018 was 124 days, while Samsung's was 23 and
Huawei's was 79. Apple takes longer to pay suppliers, fees, etc. Slow payment may signal poor
finances. Samsung and Huawei were quicker. Samsung eliminated payables in less than a month,
per the table. Huawei paid suppliers faster.
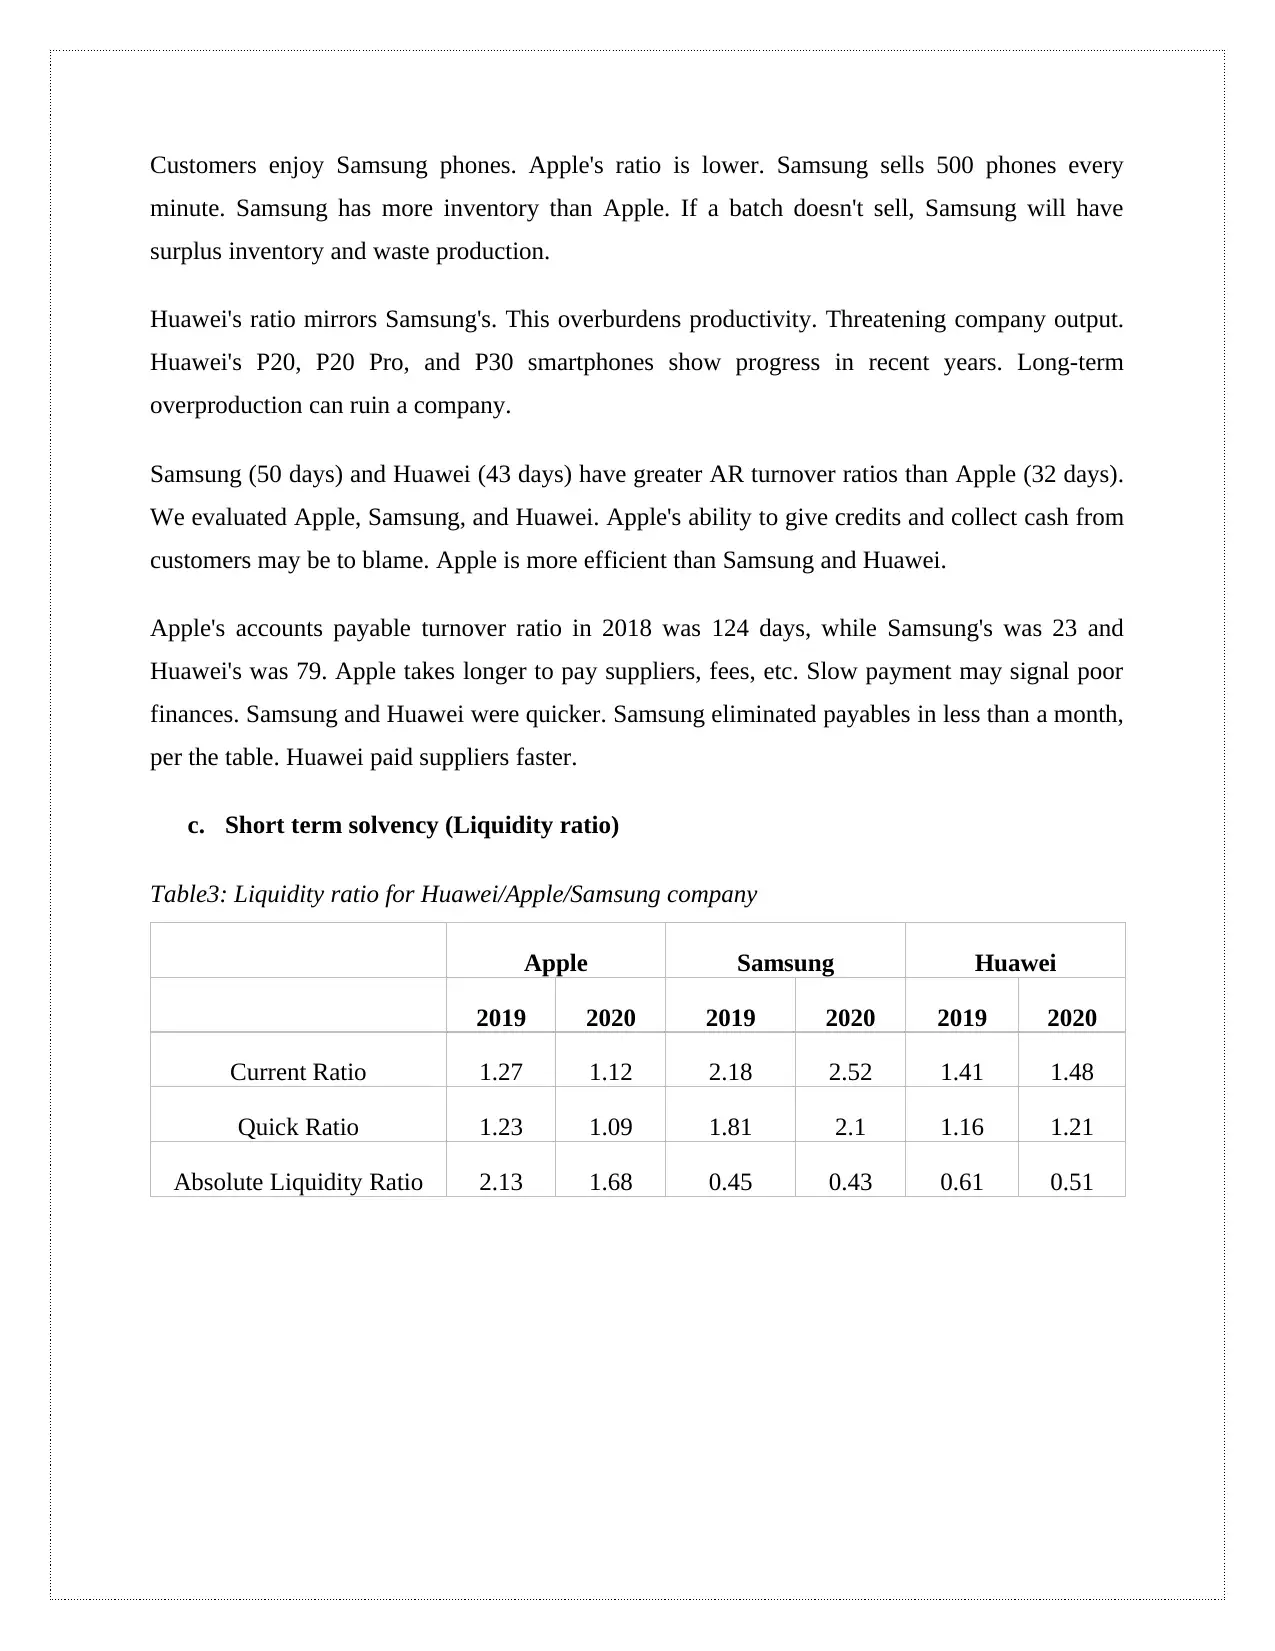
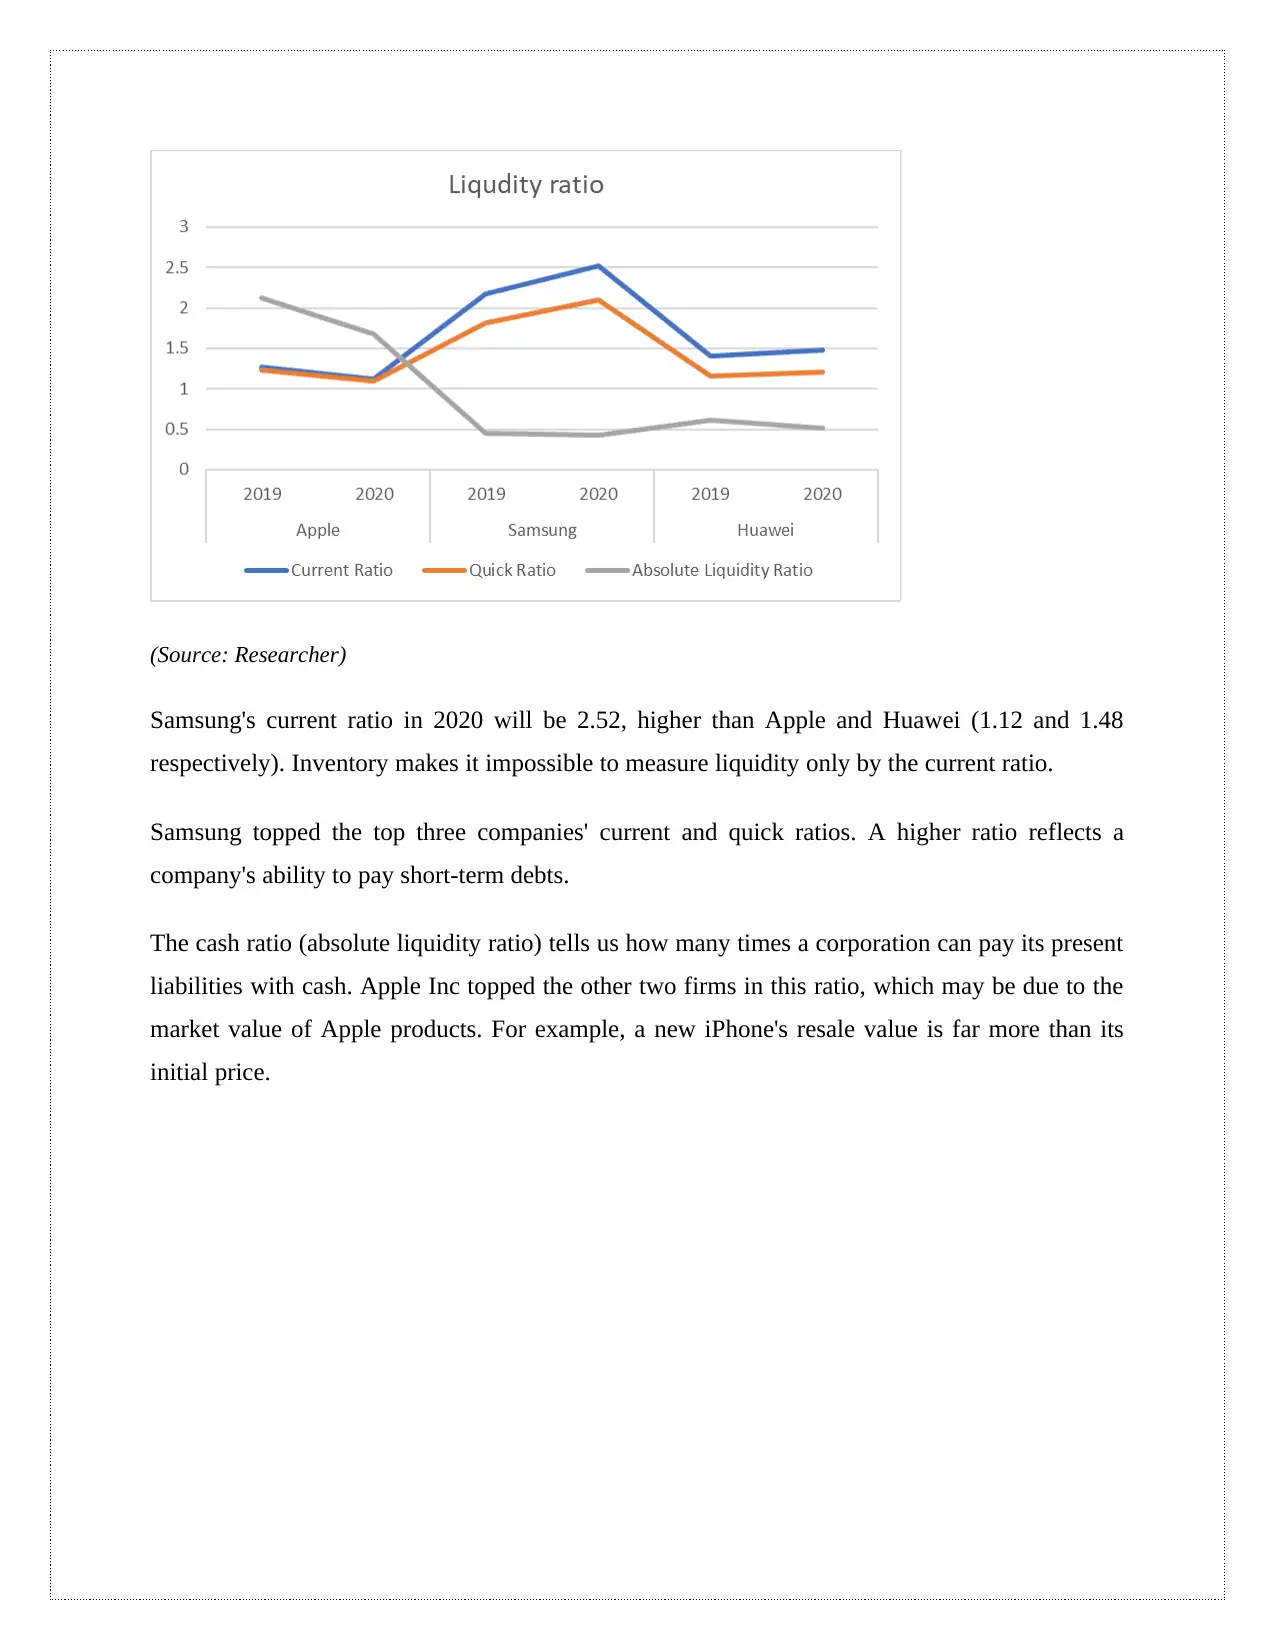
c. Short term solvency (Liquidity ratio)
Table3: Liquidity ratio for Huawei/Apple/Samsung company
Apple Samsung Huawei
2019 2020 2019 2020 2019 2020
Current Ratio 1.27 1.12 2.18 2.52 1.41 1.48
Quick Ratio 1.23 1.09 1.81 2.1 1.16 1.21
Absolute Liquidity Ratio 2.13 1.68 0.45 0.43 0.61 0.51
minute. Samsung has more inventory than Apple. If a batch doesn't sell, Samsung will have
surplus inventory and waste production.
Huawei's ratio mirrors Samsung's. This overburdens productivity. Threatening company output.
Huawei's P20, P20 Pro, and P30 smartphones show progress in recent years. Long-term
overproduction can ruin a company.
Samsung (50 days) and Huawei (43 days) have greater AR turnover ratios than Apple (32 days).
We evaluated Apple, Samsung, and Huawei. Apple's ability to give credits and collect cash from
customers may be to blame. Apple is more efficient than Samsung and Huawei.
Apple's accounts payable turnover ratio in 2018 was 124 days, while Samsung's was 23 and
Huawei's was 79. Apple takes longer to pay suppliers, fees, etc. Slow payment may signal poor
finances. Samsung and Huawei were quicker. Samsung eliminated payables in less than a month,
per the table. Huawei paid suppliers faster.
c. Short term solvency (Liquidity ratio)
Table3: Liquidity ratio for Huawei/Apple/Samsung company
Apple Samsung Huawei
2019 2020 2019 2020 2019 2020
Current Ratio 1.27 1.12 2.18 2.52 1.41 1.48
Quick Ratio 1.23 1.09 1.81 2.1 1.16 1.21
Absolute Liquidity Ratio 2.13 1.68 0.45 0.43 0.61 0.51
(Source: Researcher)
Samsung's current ratio in 2020 will be 2.52, higher than Apple and Huawei (1.12 and 1.48
respectively). Inventory makes it impossible to measure liquidity only by the current ratio.
Samsung topped the top three companies' current and quick ratios. A higher ratio reflects a
company's ability to pay short-term debts.
The cash ratio (absolute liquidity ratio) tells us how many times a corporation can pay its present
liabilities with cash. Apple Inc topped the other two firms in this ratio, which may be due to the
market value of Apple products. For example, a new iPhone's resale value is far more than its
initial price.
⊘ This is a preview!⊘
Do you want full access?
Subscribe today to unlock all pages.
Trusted by 1+ million students worldwide
1 out of 25
Related Documents


Your All-in-One AI-Powered Toolkit for Academic Success.
+13062052269
info@desklib.com
Available 24*7 on WhatsApp / Email
![[object Object]](/_next/static/media/star-bottom.7253800d.svg)
Unlock your academic potential
Copyright © 2020–2026 A2Z Services. All Rights Reserved. Developed and managed by ZUCOL.