Managerial Finance: Financial Analysis of Tesco and Sainsbury, UK
VerifiedAdded on 2022/12/30
|17
|4017
|2
Report
AI Summary
This report presents a comprehensive analysis of managerial finance, focusing on the financial performance of Tesco and Sainsbury, two leading supermarket chains in the UK. The report is divided into two portfolios. Portfolio 1 delves into ratio analysis, comparing key financial ratios such as current ratio, quick ratio, gross profit margin, net profit margin, P/E ratio, gearing ratio, return on capital employed, inventory turnover, dividend payout ratio, and earnings per share for both companies over two years. It provides interpretations of these ratios, highlighting trends and comparative strengths and weaknesses, and offers recommendations for each company. Portfolio 2 explores investment appraisal techniques, specifically net present value (NPV), to evaluate potential projects, considering both financial projections and residual values. The report also discusses the limitations of both ratio analysis and investment appraisal techniques, acknowledging the constraints and potential biases inherent in financial analysis and decision-making.

Managerial Finance
Paraphrase This Document
Need a fresh take? Get an instant paraphrase of this document with our AI Paraphraser
Table of Contents
INTRODUCTION...........................................................................................................................3
PORTFOLIO 1................................................................................................................................3
Ratio analysis:..............................................................................................................................4
Interpretation:..............................................................................................................................5
Recommendations:....................................................................................................................11
Limitations for using ratio analysis for knowing firms financial position:...............................11
PORTFOLIO 2..............................................................................................................................12
Investment appraisal techniques for project A and project B:...................................................12
Limitations of using investment appraisal techniques for long term decision-making:............14
CONCLUSION..............................................................................................................................17
REFERENCES..............................................................................................................................18
INTRODUCTION
Managerial Finance basically a mixture of economics/finance and accounting. Firstly, financial
managers used accounting records, free cash-flows etc. for preparing and utilisation of finance
wealth of the organisation. Furthermore, administrators using economic values as a framework
for financial decision-makings that serves interest of the enterprise. In simple terms, finance
is field of economics which is assisted by financial information (Roloff, 2017). As finance
represents what brings value to entire organisation, finance administrators are essential people
for majority of companies. Financial administrators assess the growth of the corporation,
recognise the financial implications, patterns and suggest how to leverage assets of the
corporation for well-being and long-term success of the corporation. The study-assessment
covers financial analysis of leading supermarket chains of UK namely Tesco and Sainsbury and
provides recommendations to corporations. Moreover, it contains investment appraisal-
techniques and key limitations of this such approaches.
PORTFOLIO 1
Overview of Companies:
Tesco Plc: Tesco is supermarket retailer chain. The Group is immersed in Retailing and Affiliate
Operations (Retail) including Retail Banking Insurance Services sector. The divisions of the
Business include United Kingdom as well as Republic of Ireland, regions of Central Europe, that
involves Czech Republic, the Hungary, Poland, the Slovakia but also Tesco Bank, that involves
retail banking insurance coverage across United Kingdom. The Corporation's market comprises
the United Kingdom, the Czech Empire, the United Kingdom, the United Kingdom, Czech
Republic, the United Kingdom (Dunn) and the United Kingdom. The Organization provides a
variety of personal financing items and services, including credit cards receivables, private
current accounts and loans.
Sainsbury Plc: Sainsbury is leading retailer of merchandise throughout United Kingdom. The
Corporation operates across the following sections: Retailing, Financial Products and Real Estate
investment. The retailing division is involved in the service of groceries and convenience
retailing outlets. The Financial Products section covers the activities of Sainsbury Bank plc.
Real estate Investments division comprises joint partnerships between the Corporation as well as
British Land Corporation PLC including the Land Securities Group. The Sainsbury's Bank offers
⊘ This is a preview!⊘
Do you want full access?
Subscribe today to unlock all pages.
Trusted by 1+ million students worldwide
a variety of services, namely insurance, personal loans, deposits and mortgages. Sainsbury Bank
provides car, house, pet including life insurance policies. Sainsbury's Energy provides gas and
power, as well as a variety of furnaces. Sainsbury's Entertainment sells films, songs, comics,
gaming as well as other entertainment items (Blanco-Oliver and Irimia-Diéguez, 2019).
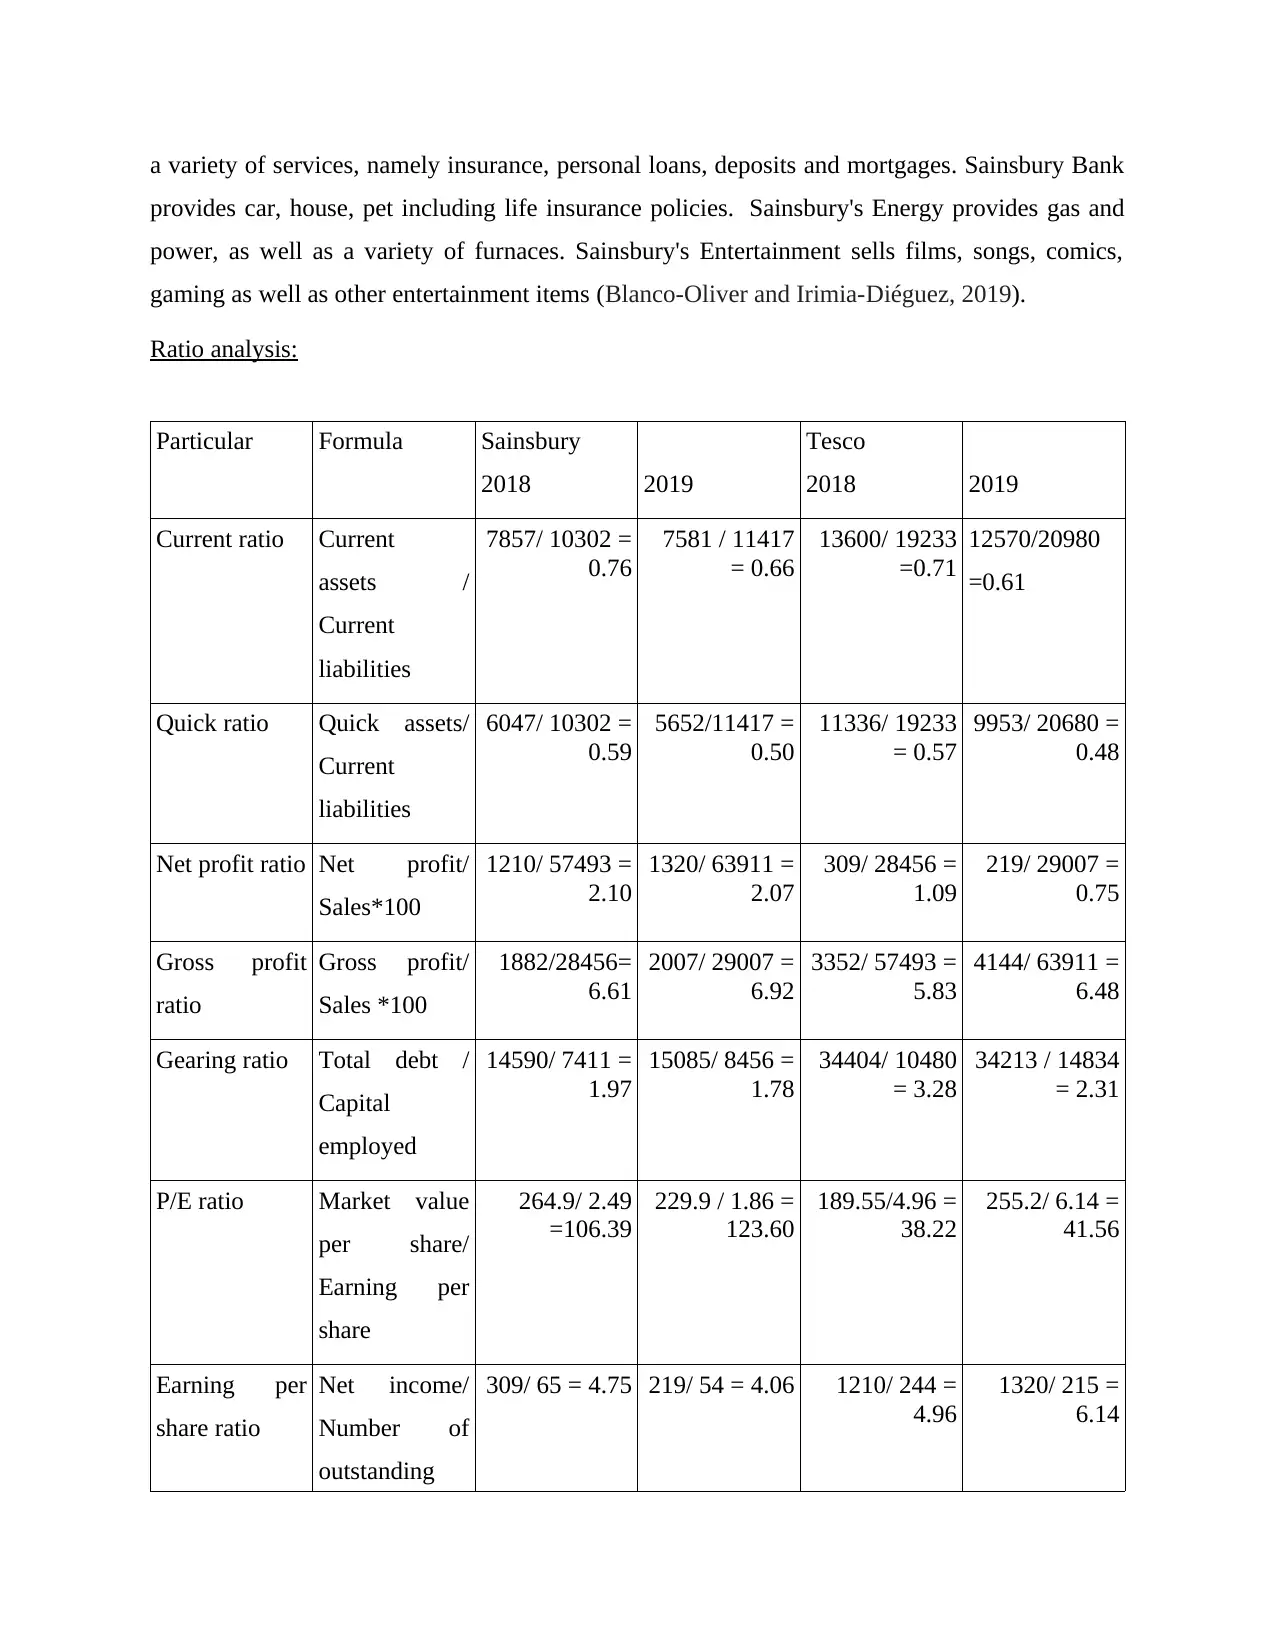
Ratio analysis:
Particular Formula Sainsbury
2018 2019
Tesco
2018 2019
Current ratio Current
assets /
Current
liabilities
7857/ 10302 =
0.76
7581 / 11417
= 0.66
13600/ 19233
=0.71
12570/20980
=0.61
Quick ratio Quick assets/
Current
liabilities
6047/ 10302 =
0.59
5652/11417 =
0.50
11336/ 19233
= 0.57
9953/ 20680 =
0.48
Net profit ratio Net profit/
Sales*100
1210/ 57493 =
2.10
1320/ 63911 =
2.07
309/ 28456 =
1.09
219/ 29007 =
0.75
Gross profit
ratio
Gross profit/
Sales *100
1882/28456=
6.61
2007/ 29007 =
6.92
3352/ 57493 =
5.83
4144/ 63911 =
6.48
Gearing ratio Total debt /
Capital
employed
14590/ 7411 =
1.97
15085/ 8456 =
1.78
34404/ 10480
= 3.28
34213 / 14834
= 2.31
P/E ratio Market value
per share/
Earning per
share
264.9/ 2.49
=106.39
229.9 / 1.86 =
123.60
189.55/4.96 =
38.22
255.2/ 6.14 =
41.56
Earning per
share ratio
Net income/
Number of
outstanding
309/ 65 = 4.75 219/ 54 = 4.06 1210/ 244 =
4.96
1320/ 215 =
6.14
provides car, house, pet including life insurance policies. Sainsbury's Energy provides gas and
power, as well as a variety of furnaces. Sainsbury's Entertainment sells films, songs, comics,
gaming as well as other entertainment items (Blanco-Oliver and Irimia-Diéguez, 2019).
Ratio analysis:
Particular Formula Sainsbury
2018 2019
Tesco
2018 2019
Current ratio Current
assets /
Current
liabilities
7857/ 10302 =
0.76
7581 / 11417
= 0.66
13600/ 19233
=0.71
12570/20980
=0.61
Quick ratio Quick assets/
Current
liabilities
6047/ 10302 =
0.59
5652/11417 =
0.50
11336/ 19233
= 0.57
9953/ 20680 =
0.48
Net profit ratio Net profit/
Sales*100
1210/ 57493 =
2.10
1320/ 63911 =
2.07
309/ 28456 =
1.09
219/ 29007 =
0.75
Gross profit
ratio
Gross profit/
Sales *100
1882/28456=
6.61
2007/ 29007 =
6.92
3352/ 57493 =
5.83
4144/ 63911 =
6.48
Gearing ratio Total debt /
Capital
employed
14590/ 7411 =
1.97
15085/ 8456 =
1.78
34404/ 10480
= 3.28
34213 / 14834
= 2.31
P/E ratio Market value
per share/
Earning per
share
264.9/ 2.49
=106.39
229.9 / 1.86 =
123.60
189.55/4.96 =
38.22
255.2/ 6.14 =
41.56
Earning per
share ratio
Net income/
Number of
outstanding
309/ 65 = 4.75 219/ 54 = 4.06 1210/ 244 =
4.96
1320/ 215 =
6.14
Paraphrase This Document
Need a fresh take? Get an instant paraphrase of this document with our AI Paraphraser
Tesco
Sainsbury
00.20.40.60.8 0.71 0.76
0.61 0.66
Current ratio
2018 2019
share
Return on
capital
employed
Operating
profit/ Capital
employed
518/ 11699 =
4.43
601/ 12097 =
4.97
1566 / 25502
= 6.14
2639 / 28269
= 9.34
Average stock
turnover
Cost of goods
sold/ Average
stock
26574/ 1792.5
= 14.83
27000/ 1869.5
= 14.44
54141/ 2282 =
23.73
59769/ 2440 =
24.50
Dividend
payout ratio
Dividend per
share/ Earning
per share
235 / 309 =
76.05
247/ 219 =
112.79
82/ 1210 =
6.78
357/ 1320 =
27.05
Capital employed = Total assets- Total current liabilities
Tesco
2018 2019
44735 – 19233 = 25502 48949 – 20680 = 28269
Sainsbury
2018 2019
22001 – 10302 = 11699 23514 – 11417 = 12097
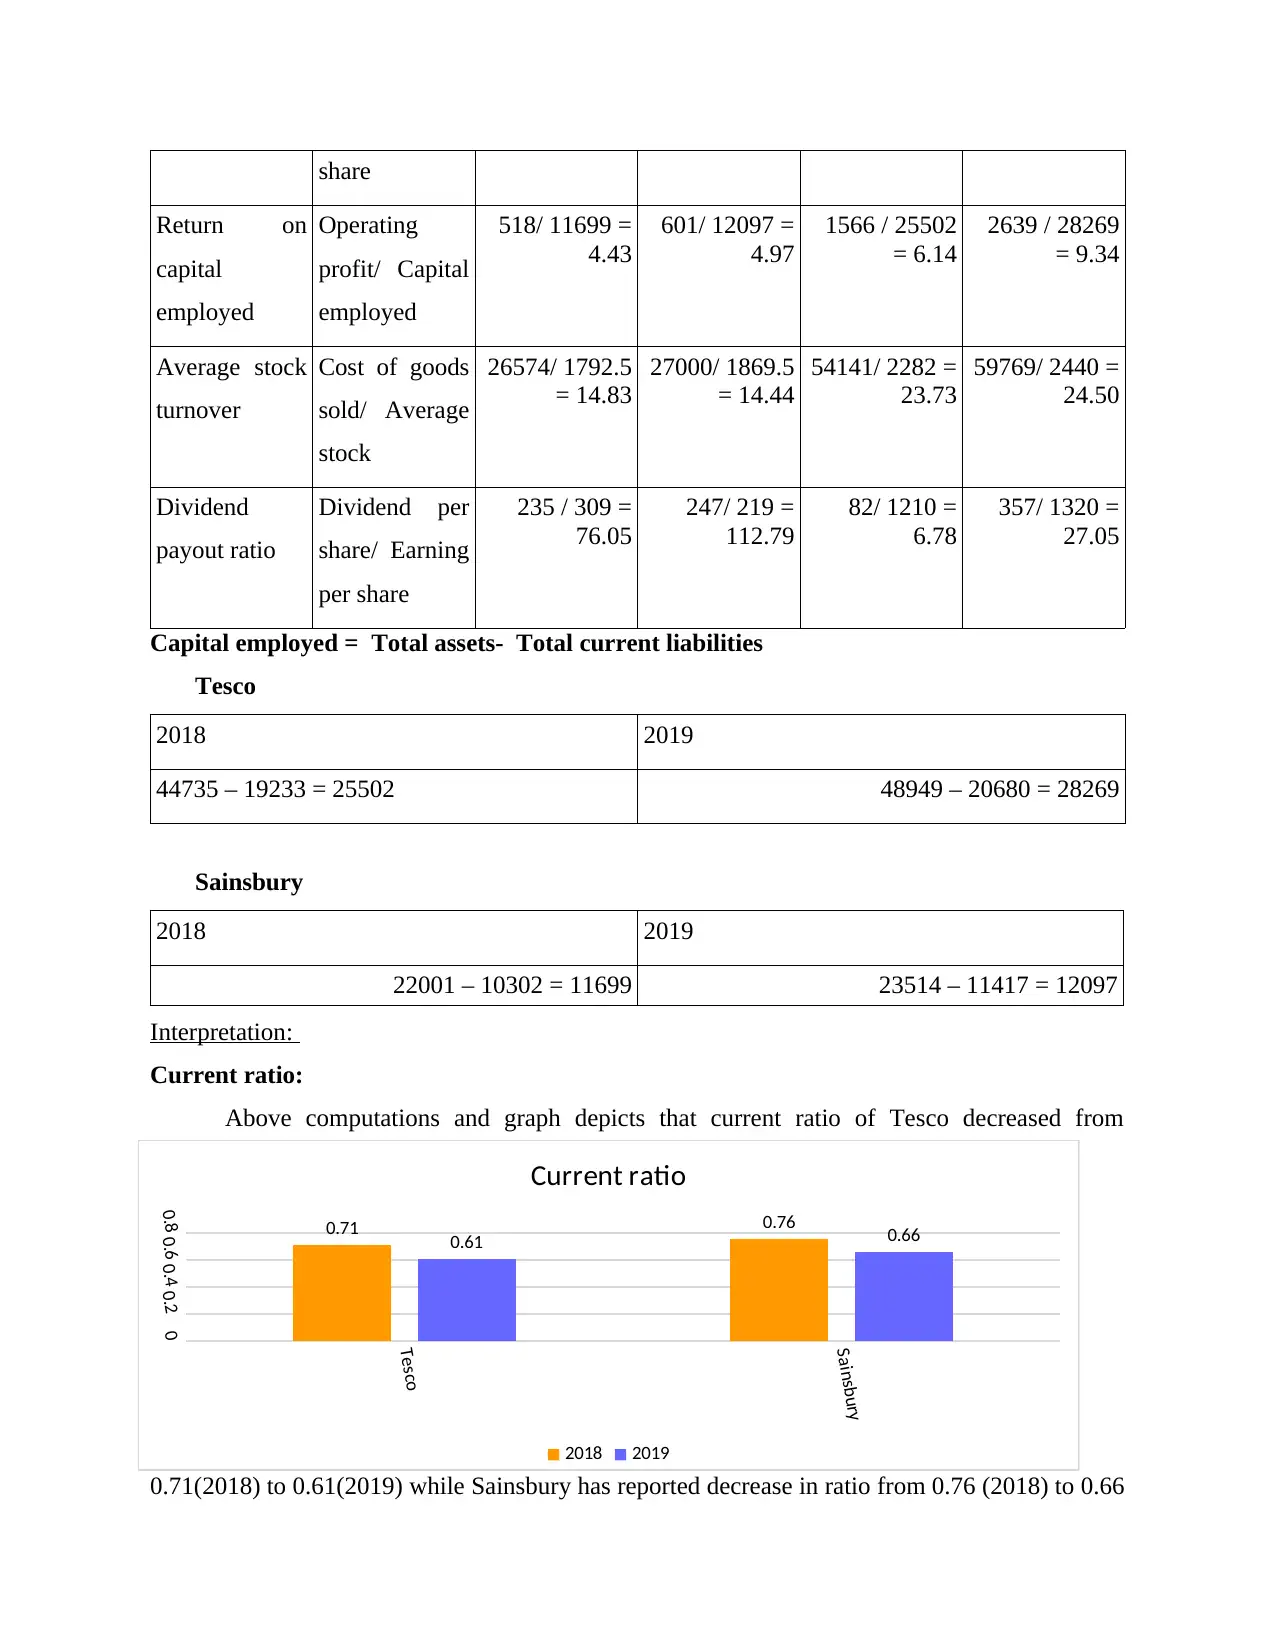
Interpretation:
Current ratio:
Above computations and graph depicts that current ratio of Tesco decreased from
0.71(2018) to 0.61(2019) while Sainsbury has reported decrease in ratio from 0.76 (2018) to 0.66
Sainsbury
00.20.40.60.8 0.71 0.76
0.61 0.66
Current ratio
2018 2019
share
Return on
capital
employed
Operating
profit/ Capital
employed
518/ 11699 =
4.43
601/ 12097 =
4.97
1566 / 25502
= 6.14
2639 / 28269
= 9.34
Average stock
turnover
Cost of goods
sold/ Average
stock
26574/ 1792.5
= 14.83
27000/ 1869.5
= 14.44
54141/ 2282 =
23.73
59769/ 2440 =
24.50
Dividend
payout ratio
Dividend per
share/ Earning
per share
235 / 309 =
76.05
247/ 219 =
112.79
82/ 1210 =
6.78
357/ 1320 =
27.05
Capital employed = Total assets- Total current liabilities
Tesco
2018 2019
44735 – 19233 = 25502 48949 – 20680 = 28269
Sainsbury
2018 2019
22001 – 10302 = 11699 23514 – 11417 = 12097
Interpretation:
Current ratio:
Above computations and graph depicts that current ratio of Tesco decreased from
0.71(2018) to 0.61(2019) while Sainsbury has reported decrease in ratio from 0.76 (2018) to 0.66
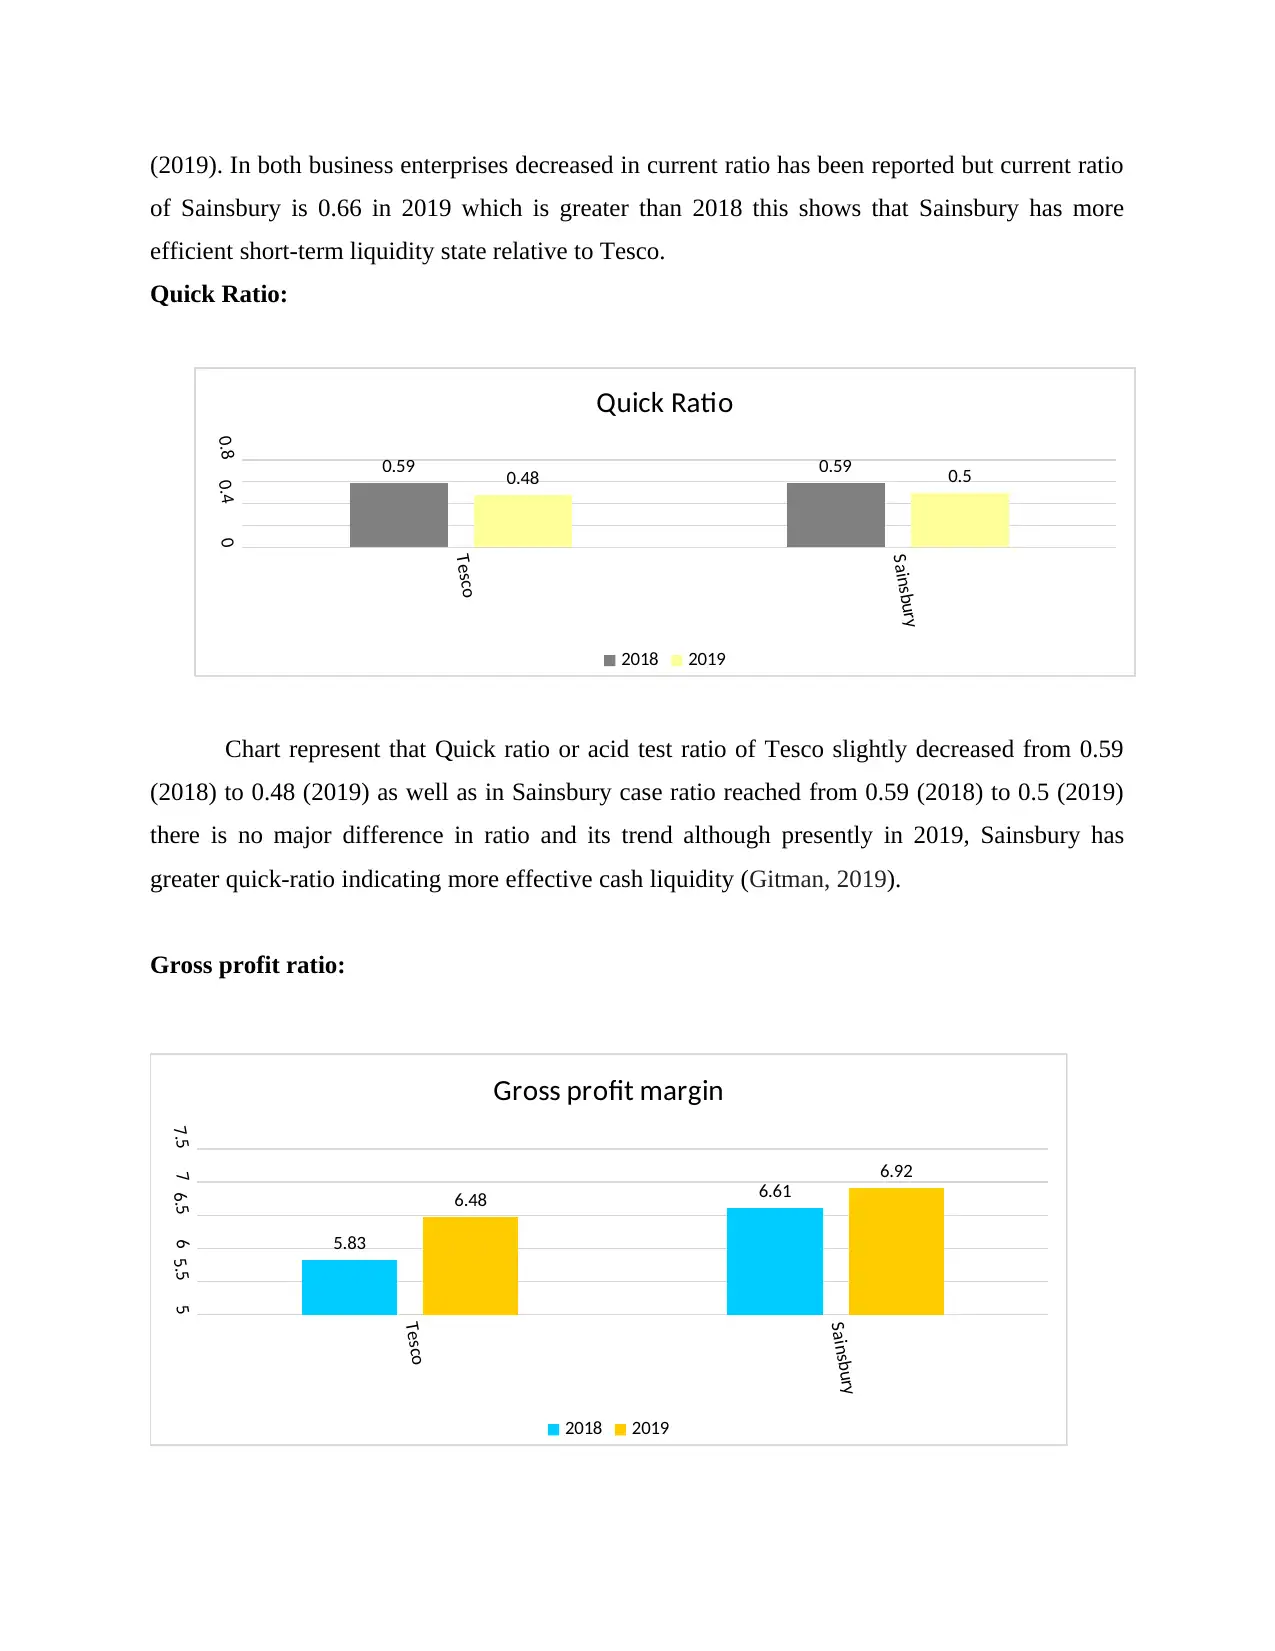
(2019). In both business enterprises decreased in current ratio has been reported but current ratio
of Sainsbury is 0.66 in 2019 which is greater than 2018 this shows that Sainsbury has more
efficient short-term liquidity state relative to Tesco.
Quick Ratio:
Chart represent that Quick ratio or acid test ratio of Tesco slightly decreased from 0.59
(2018) to 0.48 (2019) as well as in Sainsbury case ratio reached from 0.59 (2018) to 0.5 (2019)
there is no major difference in ratio and its trend although presently in 2019, Sainsbury has
greater quick-ratio indicating more effective cash liquidity (Gitman, 2019).
Gross profit ratio:
Tesco
Sainsbury
00.40.8 0.59 0.59
0.48 0.5
Quick Ratio
2018 2019
Tesco
Sainsbury
55.566.577.5
5.83
6.616.48
6.92
Gross profit margin
2018 2019
⊘ This is a preview!⊘
Do you want full access?
Subscribe today to unlock all pages.
Trusted by 1+ million students worldwide
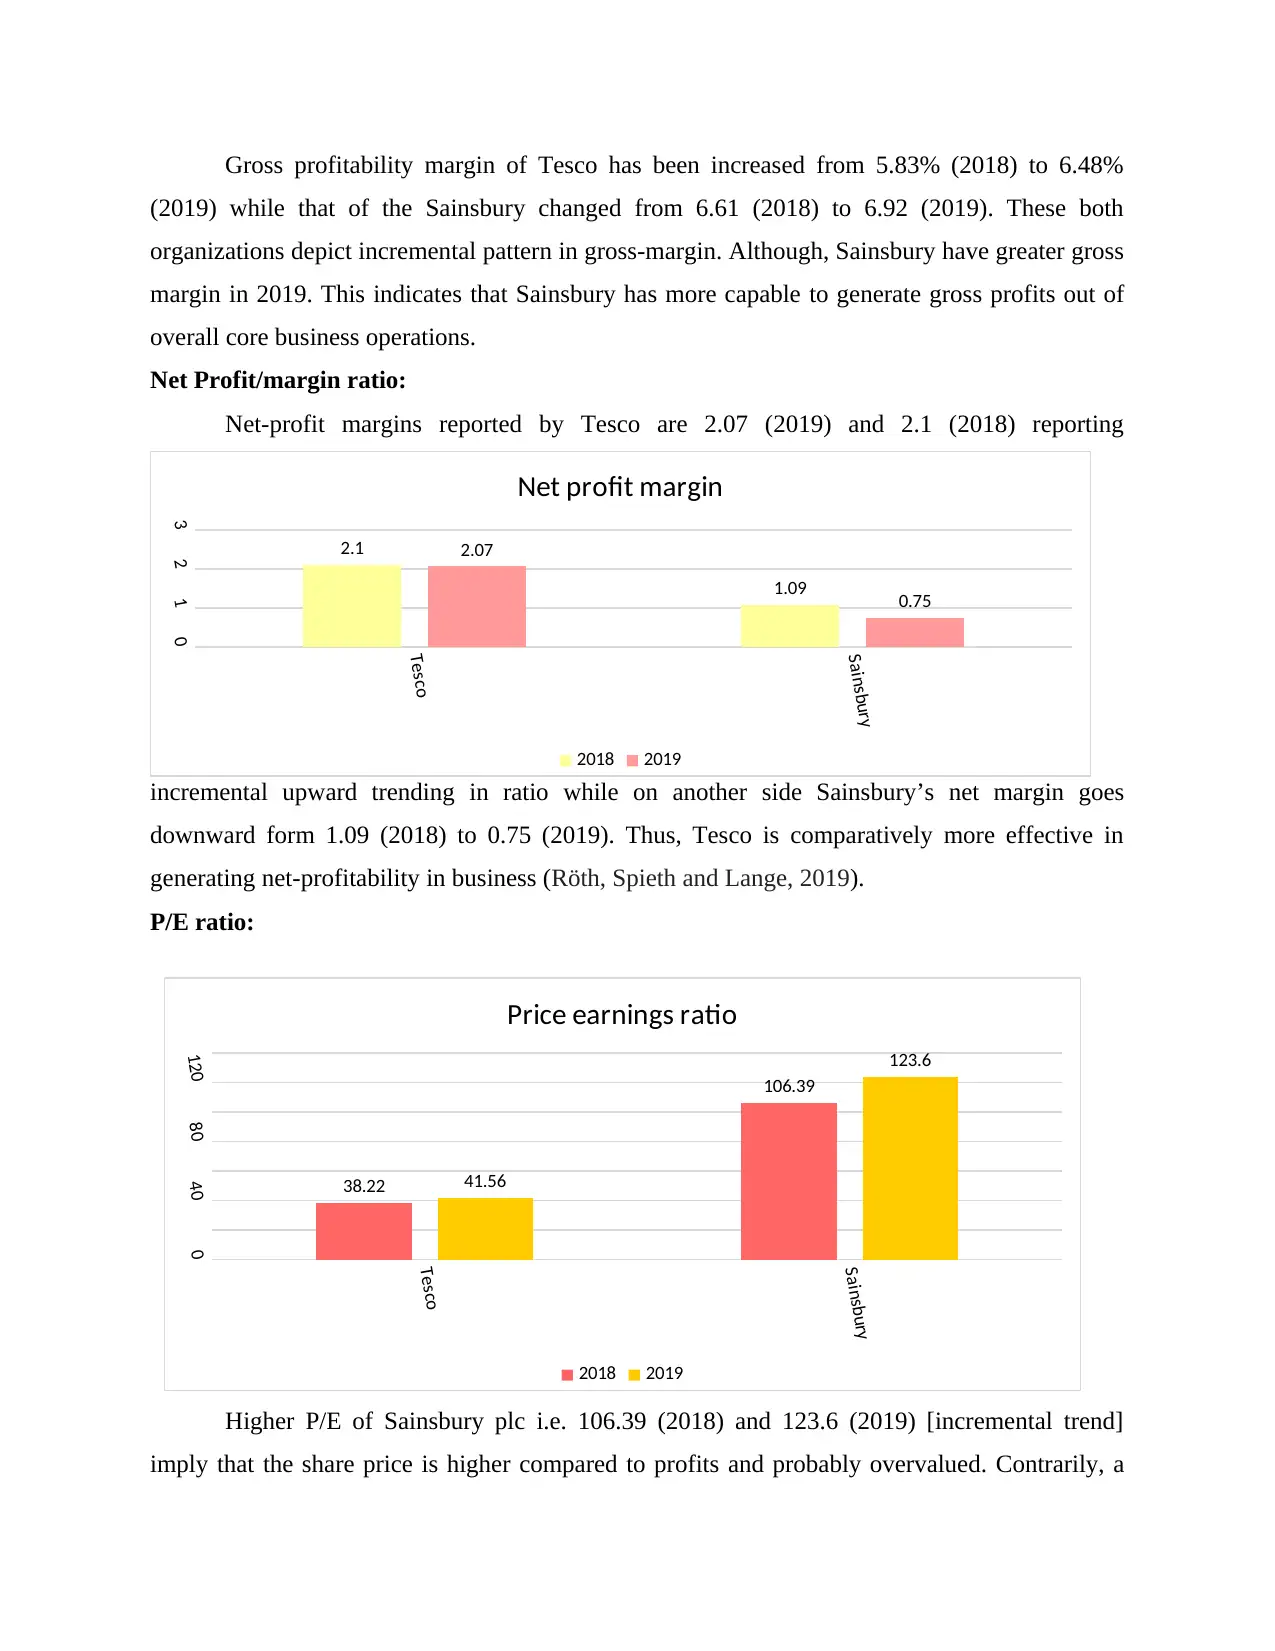
Gross profitability margin of Tesco has been increased from 5.83% (2018) to 6.48%
(2019) while that of the Sainsbury changed from 6.61 (2018) to 6.92 (2019). These both
organizations depict incremental pattern in gross-margin. Although, Sainsbury have greater gross
margin in 2019. This indicates that Sainsbury has more capable to generate gross profits out of
overall core business operations.
Net Profit/margin ratio:
Net-profit margins reported by Tesco are 2.07 (2019) and 2.1 (2018) reporting
incremental upward trending in ratio while on another side Sainsbury’s net margin goes
downward form 1.09 (2018) to 0.75 (2019). Thus, Tesco is comparatively more effective in
generating net-profitability in business (Röth, Spieth and Lange, 2019).
P/E ratio:
Higher P/E of Sainsbury plc i.e. 106.39 (2018) and 123.6 (2019) [incremental trend]
imply that the share price is higher compared to profits and probably overvalued. Contrarily, a
Tesco
Sainsbury
0123
2.1
1.09
2.07
0.75
Net profit margin
2018 2019
Tesco
Sainsbury
0
40
80
120
38.22
106.39
41.56
123.6
Price earnings ratio
2018 2019
Paraphrase This Document
Need a fresh take? Get an instant paraphrase of this document with our AI Paraphraser
reduced/lower PE of Tesco Plc i.e. 38.22 (2018) and 41.56 (2019) [incremental trend] mean
that current share price is poor compared to profits.
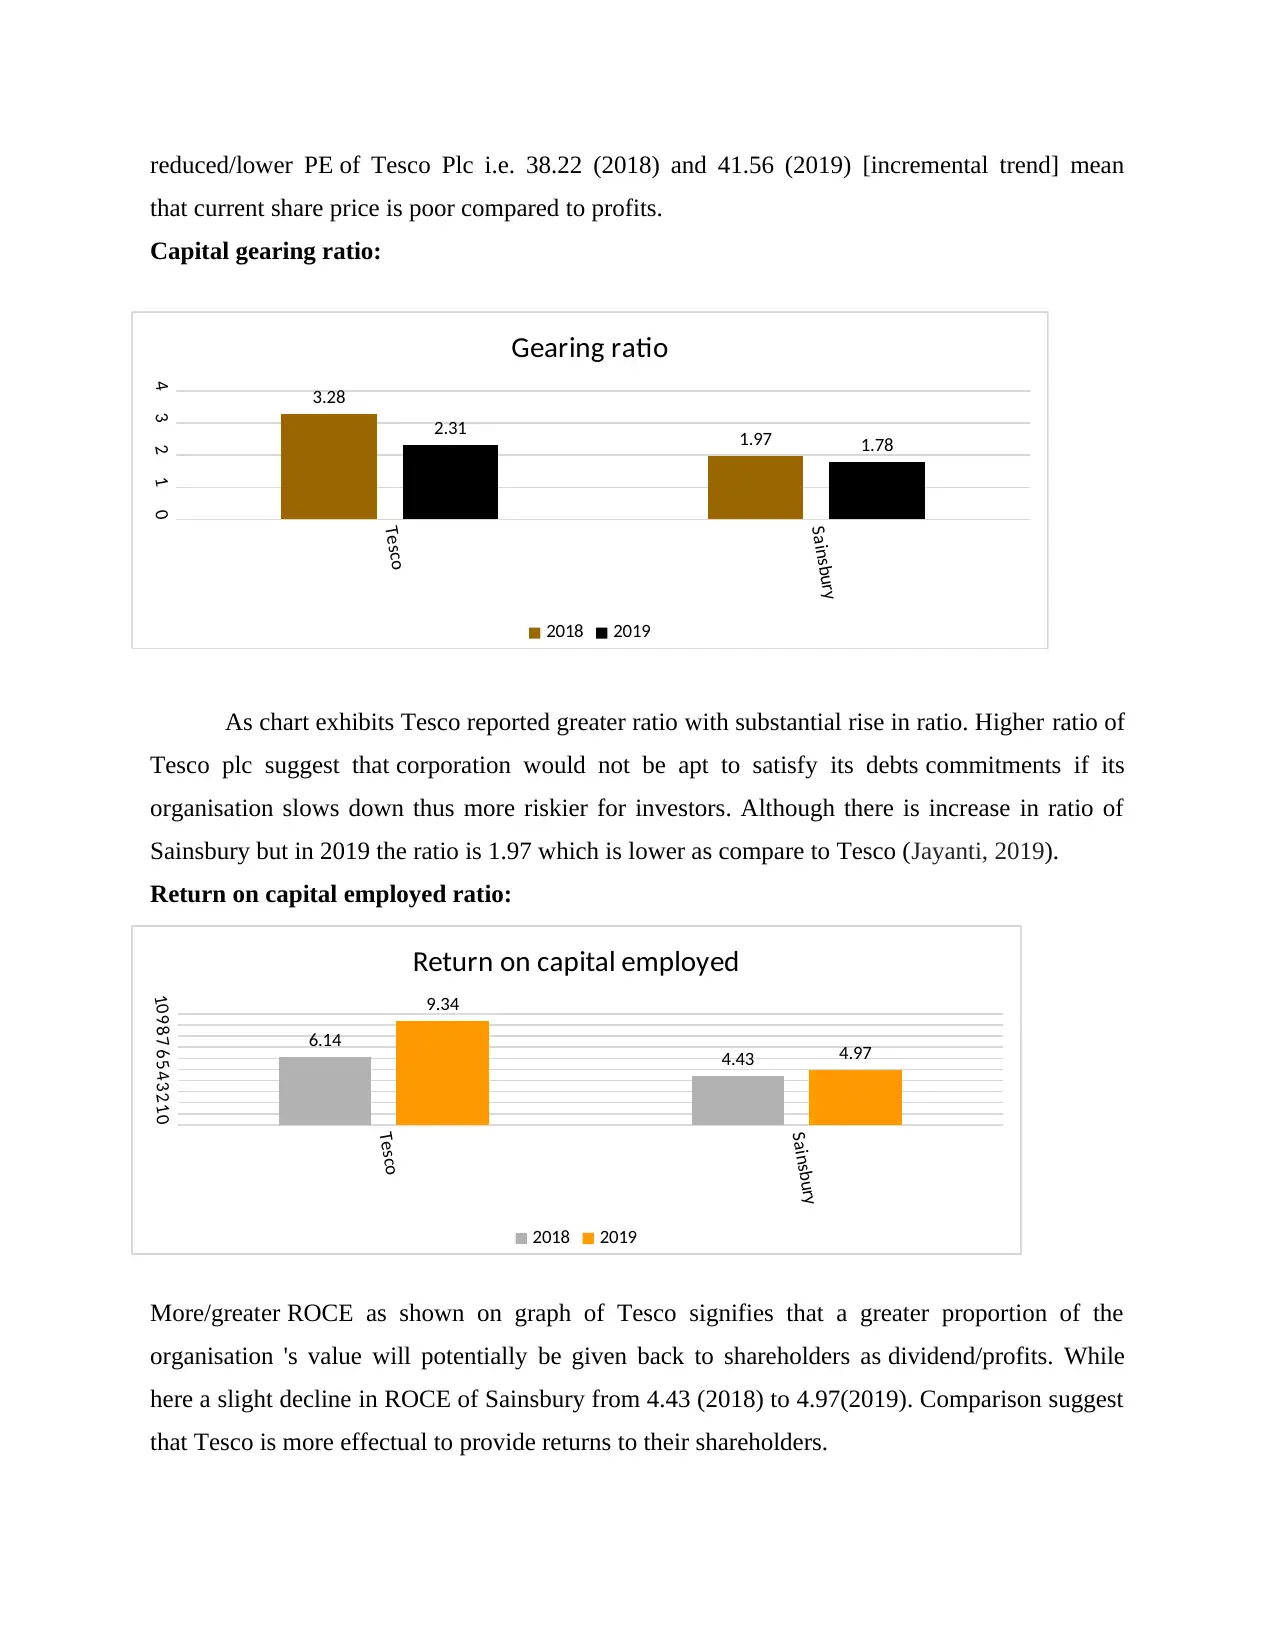
Capital gearing ratio:
As chart exhibits Tesco reported greater ratio with substantial rise in ratio. Higher ratio of
Tesco plc suggest that corporation would not be apt to satisfy its debts commitments if its
organisation slows down thus more riskier for investors. Although there is increase in ratio of
Sainsbury but in 2019 the ratio is 1.97 which is lower as compare to Tesco (Jayanti, 2019).
Return on capital employed ratio:
More/greater ROCE as shown on graph of Tesco signifies that a greater proportion of the
organisation 's value will potentially be given back to shareholders as dividend/profits. While
here a slight decline in ROCE of Sainsbury from 4.43 (2018) to 4.97(2019). Comparison suggest
that Tesco is more effectual to provide returns to their shareholders.
Tesco
Sainsbury
01234 3.28
1.97
2.31 1.78
Gearing ratio
2018 2019
Tesco
Sainsbury
012345678910
6.14
4.43
9.34
4.97
Return on capital employed
2018 2019
that current share price is poor compared to profits.
Capital gearing ratio:
As chart exhibits Tesco reported greater ratio with substantial rise in ratio. Higher ratio of
Tesco plc suggest that corporation would not be apt to satisfy its debts commitments if its
organisation slows down thus more riskier for investors. Although there is increase in ratio of
Sainsbury but in 2019 the ratio is 1.97 which is lower as compare to Tesco (Jayanti, 2019).
Return on capital employed ratio:
More/greater ROCE as shown on graph of Tesco signifies that a greater proportion of the
organisation 's value will potentially be given back to shareholders as dividend/profits. While
here a slight decline in ROCE of Sainsbury from 4.43 (2018) to 4.97(2019). Comparison suggest
that Tesco is more effectual to provide returns to their shareholders.
Tesco
Sainsbury
01234 3.28
1.97
2.31 1.78
Gearing ratio
2018 2019
Tesco
Sainsbury
012345678910
6.14
4.43
9.34
4.97
Return on capital employed
2018 2019
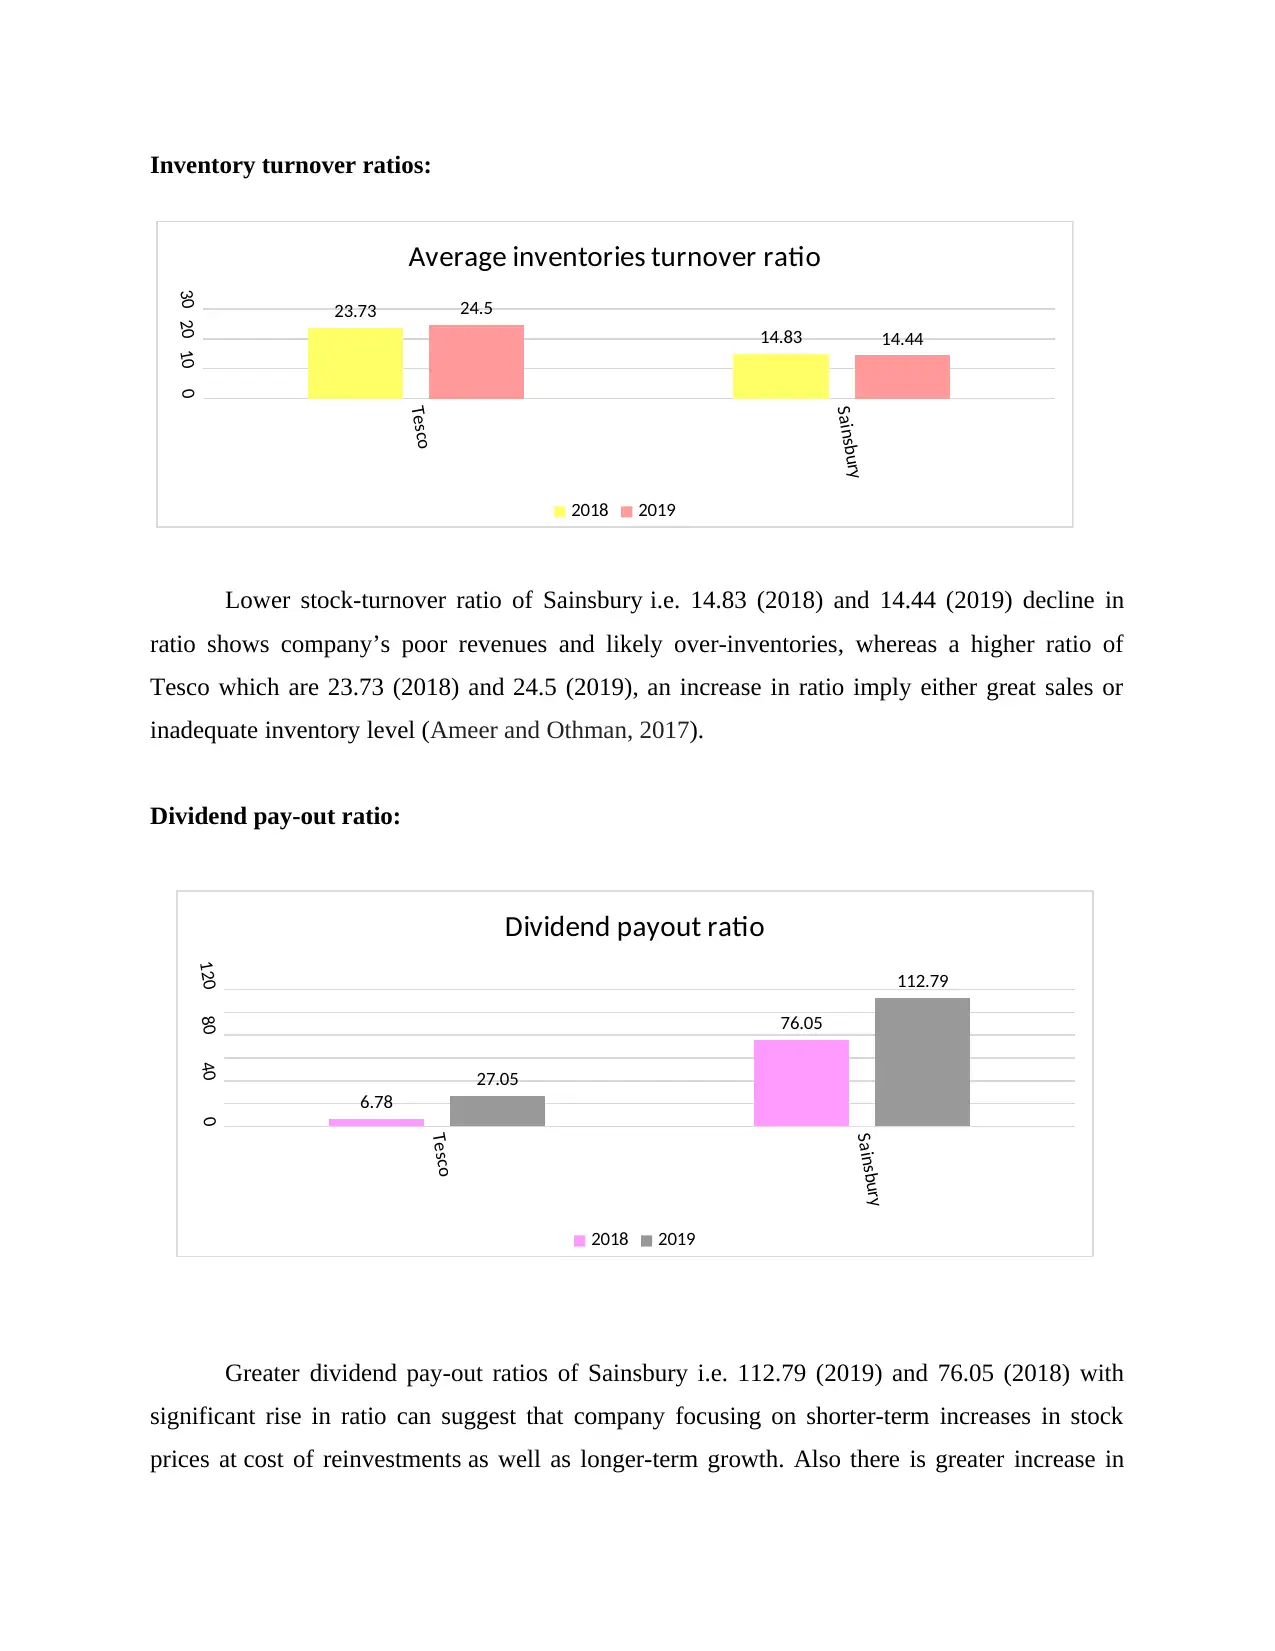
Inventory turnover ratios:
Lower stock-turnover ratio of Sainsbury i.e. 14.83 (2018) and 14.44 (2019) decline in
ratio shows company’s poor revenues and likely over-inventories, whereas a higher ratio of
Tesco which are 23.73 (2018) and 24.5 (2019), an increase in ratio imply either great sales or
inadequate inventory level (Ameer and Othman, 2017).
Dividend pay-out ratio:
Greater dividend pay-out ratios of Sainsbury i.e. 112.79 (2019) and 76.05 (2018) with
significant rise in ratio can suggest that company focusing on shorter-term increases in stock
prices at cost of reinvestments as well as longer-term growth. Also there is greater increase in
Tesco
Sainsbury
0102030 23.73
14.83
24.5
14.44
Average inventories turnover ratio
2018 2019
Tesco
Sainsbury
04080120
6.78
76.05
27.05
112.79
Dividend payout ratio
2018 2019
⊘ This is a preview!⊘
Do you want full access?
Subscribe today to unlock all pages.
Trusted by 1+ million students worldwide
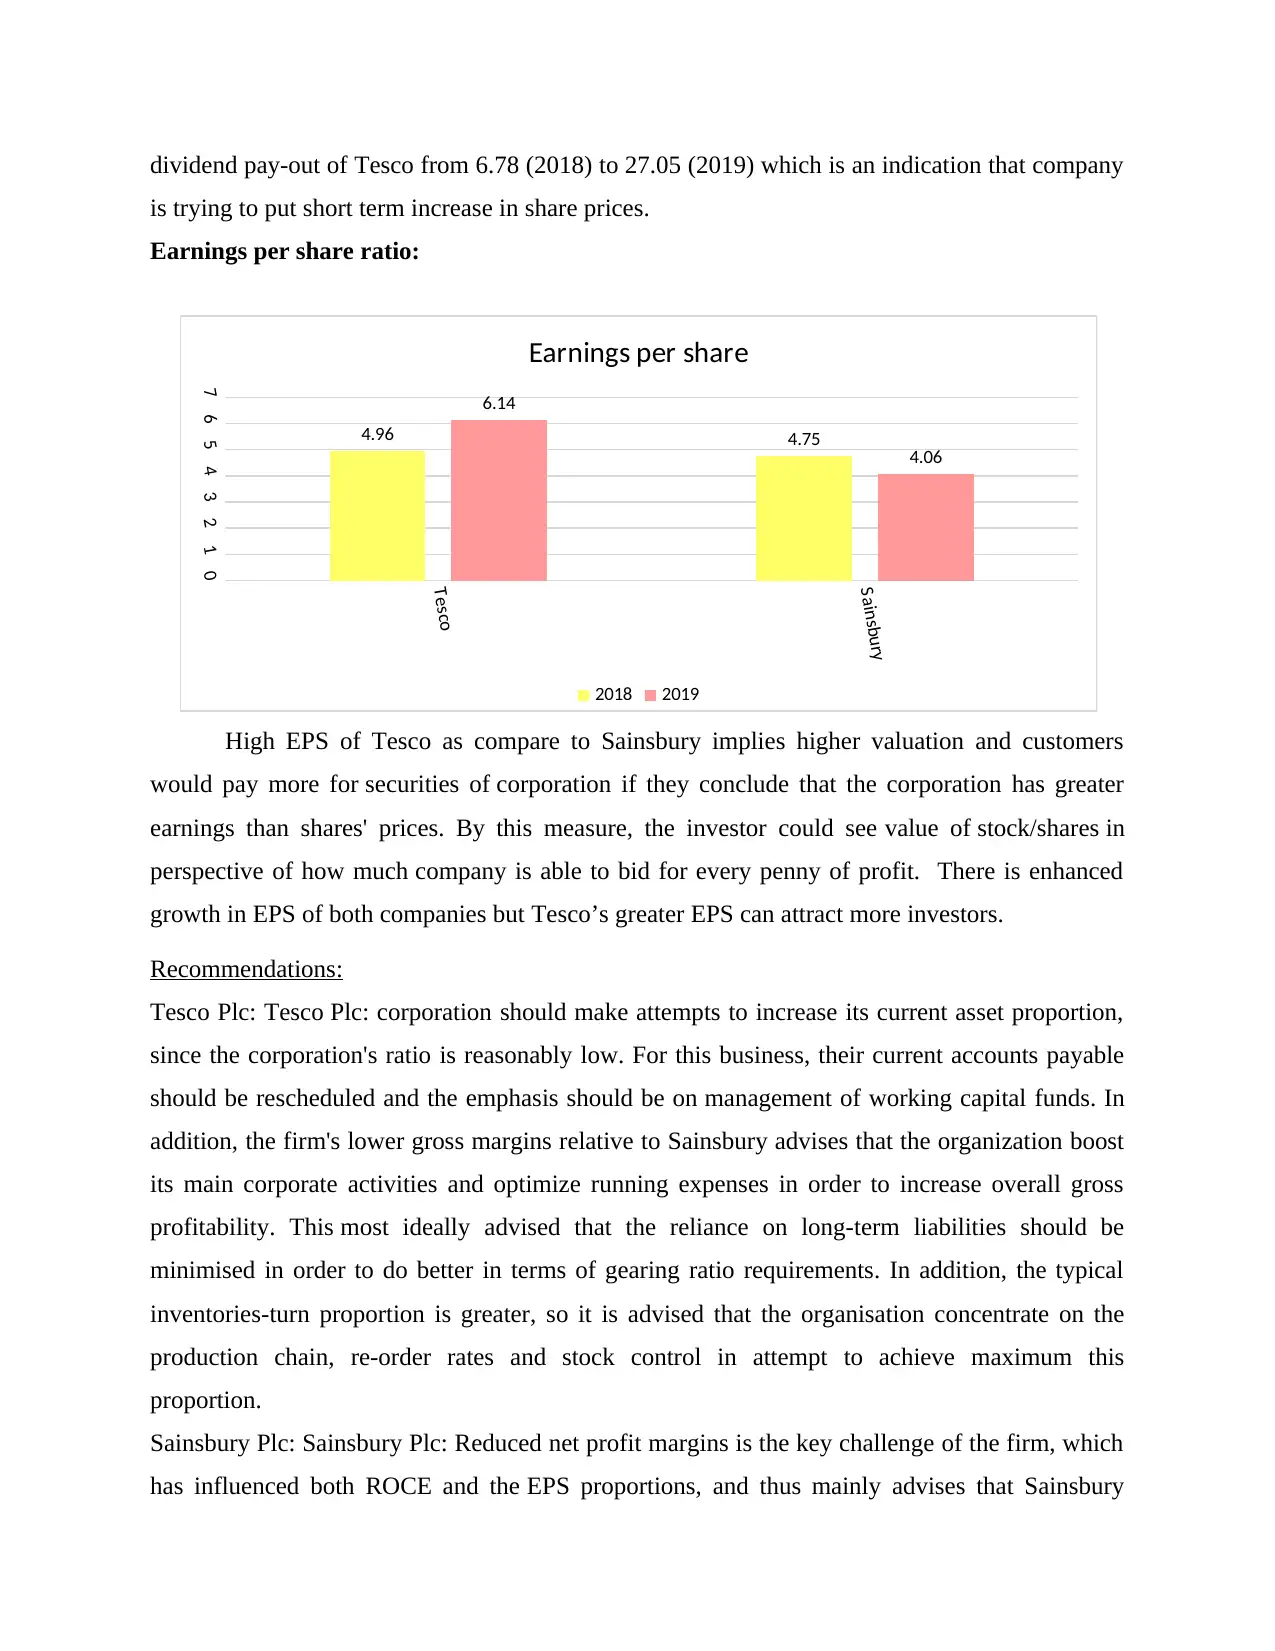
dividend pay-out of Tesco from 6.78 (2018) to 27.05 (2019) which is an indication that company
is trying to put short term increase in share prices.
Earnings per share ratio:
High EPS of Tesco as compare to Sainsbury implies higher valuation and customers
would pay more for securities of corporation if they conclude that the corporation has greater
earnings than shares' prices. By this measure, the investor could see value of stock/shares in
perspective of how much company is able to bid for every penny of profit. There is enhanced
growth in EPS of both companies but Tesco’s greater EPS can attract more investors.
Recommendations:
Tesco Plc: Tesco Plc: corporation should make attempts to increase its current asset proportion,
since the corporation's ratio is reasonably low. For this business, their current accounts payable
should be rescheduled and the emphasis should be on management of working capital funds. In
addition, the firm's lower gross margins relative to Sainsbury advises that the organization boost
its main corporate activities and optimize running expenses in order to increase overall gross
profitability. This most ideally advised that the reliance on long-term liabilities should be
minimised in order to do better in terms of gearing ratio requirements. In addition, the typical
inventories-turn proportion is greater, so it is advised that the organisation concentrate on the
production chain, re-order rates and stock control in attempt to achieve maximum this
proportion.
Sainsbury Plc: Sainsbury Plc: Reduced net profit margins is the key challenge of the firm, which
has influenced both ROCE and the EPS proportions, and thus mainly advises that Sainsbury
Tesco
Sainsbury
01234567
4.96 4.75
6.14
4.06
Earnings per share
2018 2019
Paraphrase This Document
Need a fresh take? Get an instant paraphrase of this document with our AI Paraphraser
should reduce its total business expenditures and improve its turnover-level by innovative
advertising initiatives and policies. The organisation should have deals, promotions, rewards and
benefits to gain more customers.
Limitations for using ratio analysis for knowing firms financial position:
No specification/standard criteria of the percentages/ratios and quantities to use is known
as usual. Certain companies may include certain products in the estimation of a
proportion. And then it becomes impossible to equate the two firms.
The ratio evaluation lacks the efficiency of the business and instead includes the
quantitative element.
Some businesses can deceive the figures and allow adjustments to the proportion and
show a clearer representation of the business. There are also possibilities for window
dressings in ratio study (Minnis and Sutherland, 2017).
Relational analyses may also be deceptive, since the P&L statement components are
focused on real expenditures while financial statement components are centered on
historic statistics. Contrasting components as a combination of both will often be
disappointing and cannot achieve desired effect.
The financial statement is just updated for last day of financial cycle for those amounts.
Therefore, if the figures for last day of accounting cycle are unexpectedly fired or
reduced, the aggregate analysis of percentage will have a dramatic effect.
PORTFOLIO 2
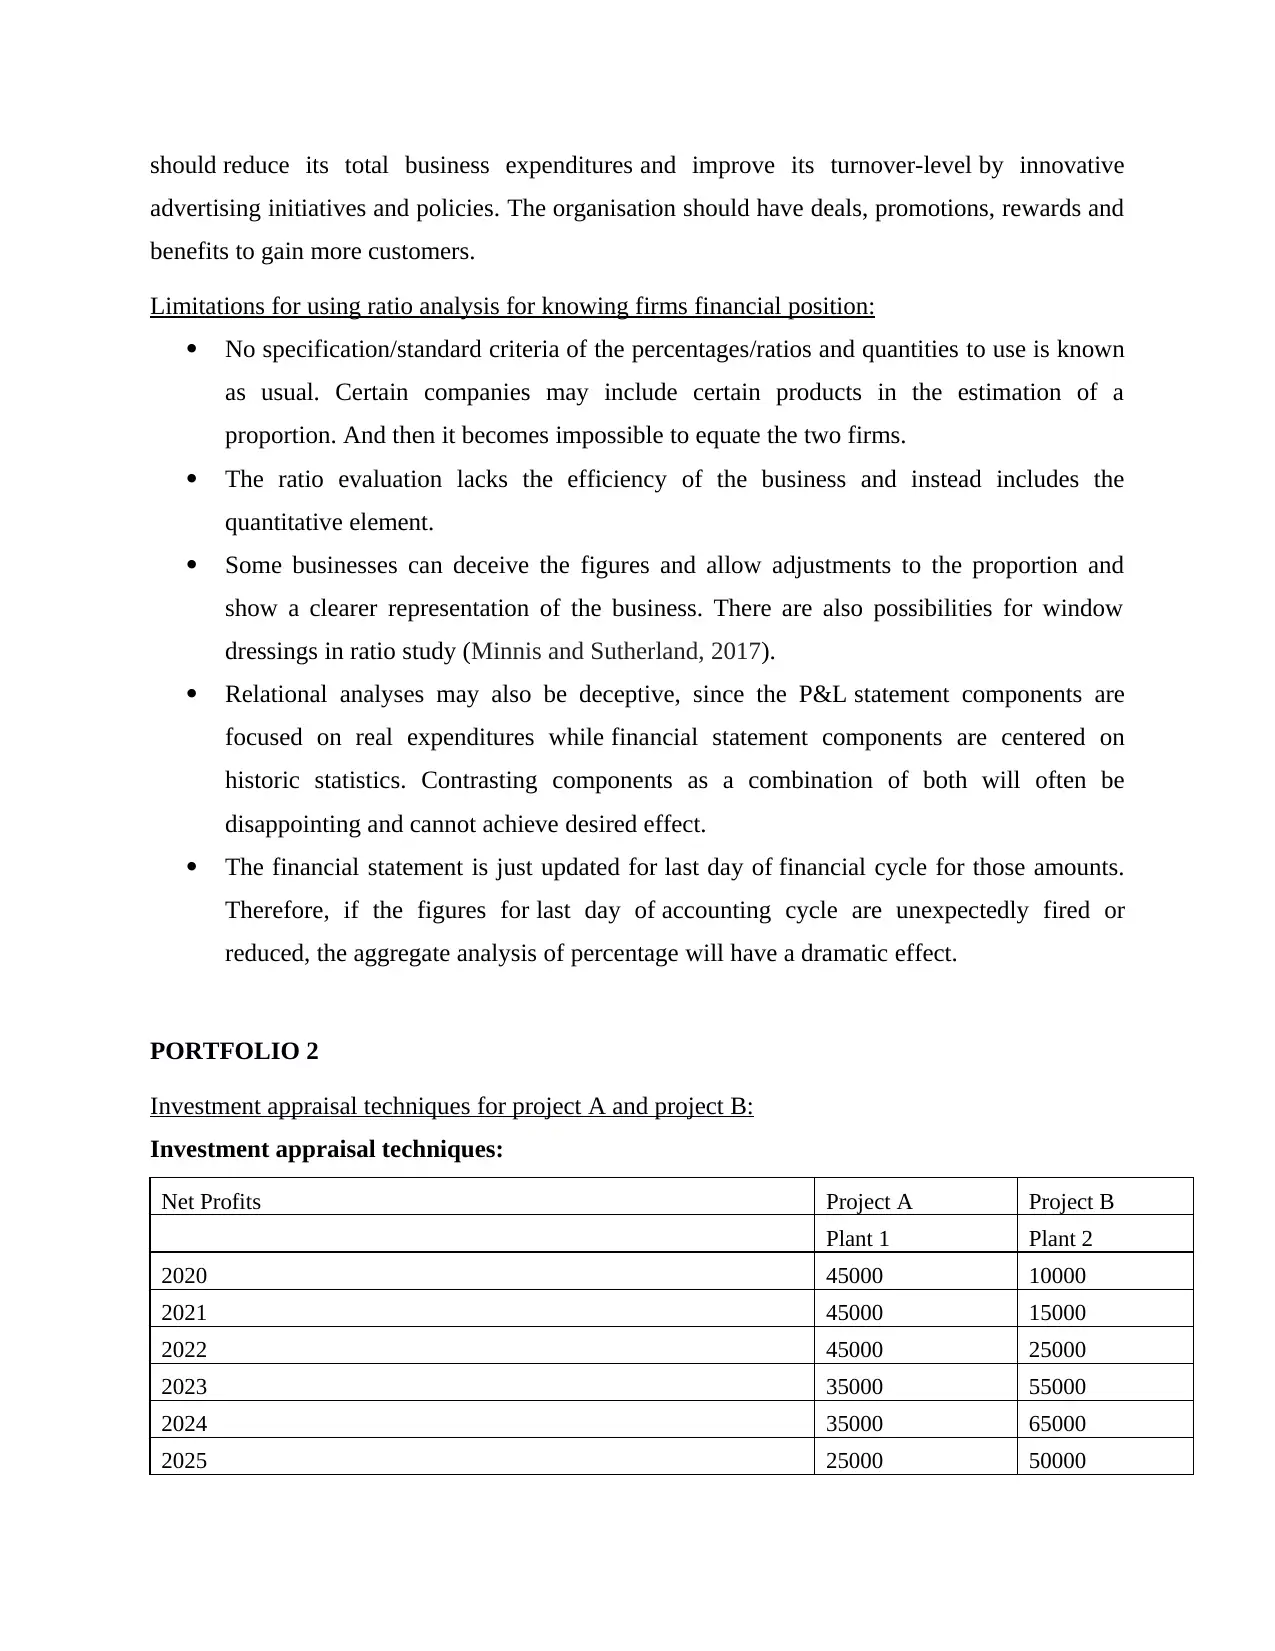
Investment appraisal techniques for project A and project B:
Investment appraisal techniques:
Net Profits Project A Project B
Plant 1 Plant 2
2020 45000 10000
2021 45000 15000
2022 45000 25000
2023 35000 55000
2024 35000 65000
2025 25000 50000
advertising initiatives and policies. The organisation should have deals, promotions, rewards and
benefits to gain more customers.
Limitations for using ratio analysis for knowing firms financial position:
No specification/standard criteria of the percentages/ratios and quantities to use is known
as usual. Certain companies may include certain products in the estimation of a
proportion. And then it becomes impossible to equate the two firms.
The ratio evaluation lacks the efficiency of the business and instead includes the
quantitative element.
Some businesses can deceive the figures and allow adjustments to the proportion and
show a clearer representation of the business. There are also possibilities for window
dressings in ratio study (Minnis and Sutherland, 2017).
Relational analyses may also be deceptive, since the P&L statement components are
focused on real expenditures while financial statement components are centered on
historic statistics. Contrasting components as a combination of both will often be
disappointing and cannot achieve desired effect.
The financial statement is just updated for last day of financial cycle for those amounts.
Therefore, if the figures for last day of accounting cycle are unexpectedly fired or
reduced, the aggregate analysis of percentage will have a dramatic effect.
PORTFOLIO 2
Investment appraisal techniques for project A and project B:
Investment appraisal techniques:
Net Profits Project A Project B
Plant 1 Plant 2
2020 45000 10000
2021 45000 15000
2022 45000 25000
2023 35000 55000
2024 35000 65000
2025 25000 50000
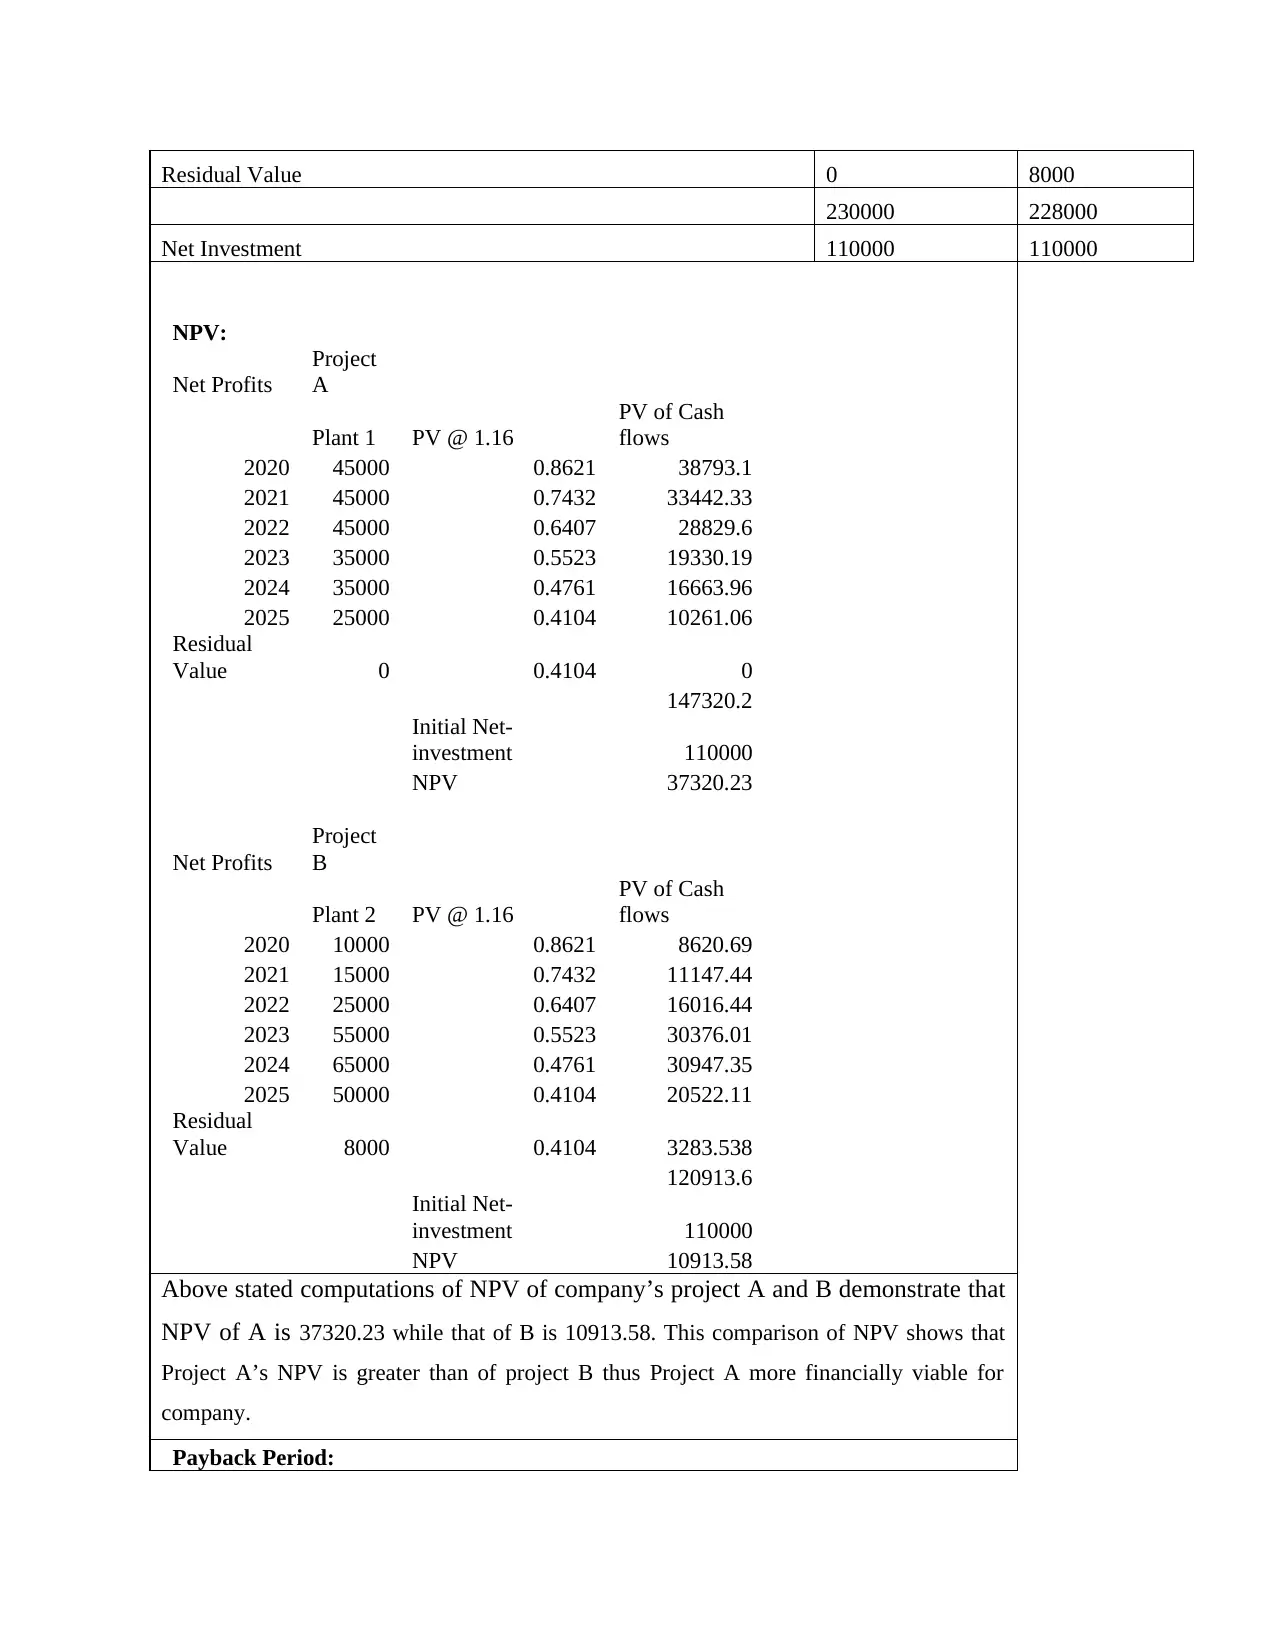
Residual Value 0 8000
230000 228000
Net Investment 110000 110000
NPV:
Net Profits
Project
A
Plant 1 PV @ 1.16
PV of Cash
flows
2020 45000 0.8621 38793.1
2021 45000 0.7432 33442.33
2022 45000 0.6407 28829.6
2023 35000 0.5523 19330.19
2024 35000 0.4761 16663.96
2025 25000 0.4104 10261.06
Residual
Value 0 0.4104 0
147320.2
Initial Net-
investment 110000
NPV 37320.23
Net Profits
Project
B
Plant 2 PV @ 1.16
PV of Cash
flows
2020 10000 0.8621 8620.69
2021 15000 0.7432 11147.44
2022 25000 0.6407 16016.44
2023 55000 0.5523 30376.01
2024 65000 0.4761 30947.35
2025 50000 0.4104 20522.11
Residual
Value 8000 0.4104 3283.538
120913.6
Initial Net-
investment 110000
NPV 10913.58
Above stated computations of NPV of company’s project A and B demonstrate that
NPV of A is 37320.23 while that of B is 10913.58. This comparison of NPV shows that
Project A’s NPV is greater than of project B thus Project A more financially viable for
company.
Payback Period:
⊘ This is a preview!⊘
Do you want full access?
Subscribe today to unlock all pages.
Trusted by 1+ million students worldwide
1 out of 17
Related Documents


Your All-in-One AI-Powered Toolkit for Academic Success.
+13062052269
info@desklib.com
Available 24*7 on WhatsApp / Email
![[object Object]](/_next/static/media/star-bottom.7253800d.svg)
Unlock your academic potential
Copyright © 2020–2026 A2Z Services. All Rights Reserved. Developed and managed by ZUCOL.