M522 Finance & Risk Management: Stock Analysis of LG & Samsung
VerifiedAdded on 2023/06/04
|19
|4671
|283
Report
AI Summary
This report provides a detailed financial and risk management analysis of LG and Samsung stocks, covering key financial ratios such as current ratio, quick ratio, return on assets, return on equity, debt-equity ratio, and price-to-equity ratio. It includes calculations of log returns, arithmetic average returns, standard deviations (risk), correlations, systematic risk (beta), cost of equity, portfolio return, and portfolio beta. The analysis assesses capital structure choices, firm valuation, the impact of future dividends, and potential undervaluation or overvaluation. The report also examines the relationship between company announcements and share price behavior, culminating in investment recommendations based on the comprehensive financial analysis of both companies. This document is available on Desklib, a platform offering a wide array of study tools and solved assignments for students.

Finance and risk management
Paraphrase This Document
Need a fresh take? Get an instant paraphrase of this document with our AI Paraphraser
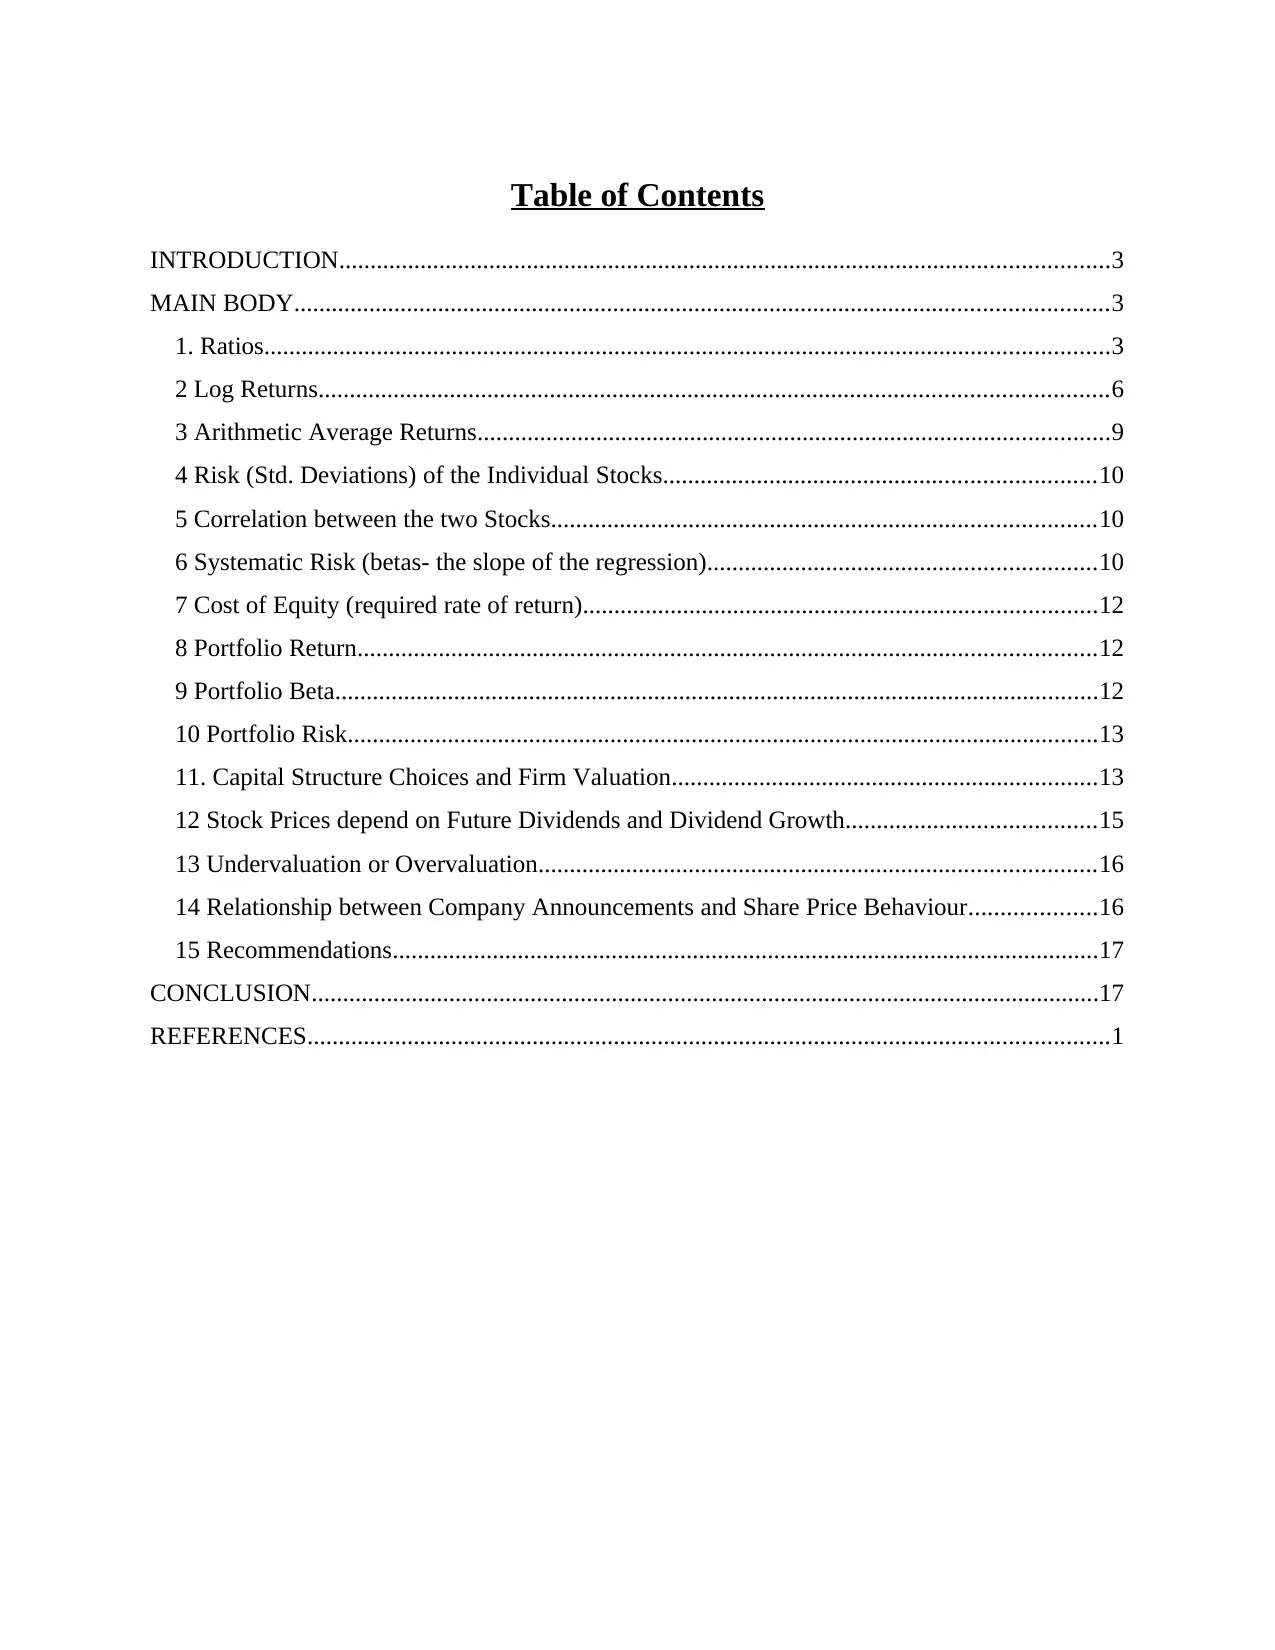
Table of Contents
INTRODUCTION...........................................................................................................................3
MAIN BODY..................................................................................................................................3
1. Ratios.......................................................................................................................................3
2 Log Returns..............................................................................................................................6
3 Arithmetic Average Returns.....................................................................................................9
4 Risk (Std. Deviations) of the Individual Stocks.....................................................................10
5 Correlation between the two Stocks.......................................................................................10
6 Systematic Risk (betas- the slope of the regression)..............................................................10
7 Cost of Equity (required rate of return)..................................................................................12
8 Portfolio Return......................................................................................................................12
9 Portfolio Beta..........................................................................................................................12
10 Portfolio Risk........................................................................................................................13
11. Capital Structure Choices and Firm Valuation....................................................................13
12 Stock Prices depend on Future Dividends and Dividend Growth........................................15
13 Undervaluation or Overvaluation.........................................................................................16
14 Relationship between Company Announcements and Share Price Behaviour....................16
15 Recommendations.................................................................................................................17
CONCLUSION..............................................................................................................................17
REFERENCES................................................................................................................................1
INTRODUCTION
Management of finances and risk involved in the process of investing in certain
stocks is referred to as financial and risk management. It involves monitoring returns, risks, beta
values and other financial factors to base the investing decision. Therefore, the following report
which involves analysis of two stocks i.e., LG and Samsung includes such process of financial
and risk management. For the analysis of the finance and risk management the organizations
selected by Samsung Electronics and LG Electronics.
MAIN BODY
1. Ratios
1 2 3 4 5
1.04
1.06
1.08
1.10
1.12
1.14
1.16
1.18
Current Ratio - LG Electronics
1 2 3 4 5
0.00
0.50
1.00
1.50
2.00
2.50
3.00
3.50
Current Ratio - Samsung
Electronics
1 2021
2 2020
3 2019
4 2018
5 2017
The current ratio of a company is used to get insight about the liquidity of the company
(Supriyanto and Darmawan, 2018). The current ratio of the Samsung electronics is more stable
than the LG electronics. Samsung maintains an ideal current ratio on the other LG’s current ratio
is below 2.
⊘ This is a preview!⊘
Do you want full access?
Subscribe today to unlock all pages.
Trusted by 1+ million students worldwide
1 2 3 4 5
0.73
0.74
0.75
0.76
0.77
0.78
0.79
Quick Ratio - LG Electronics
1 2 3 4 5
0.00
0.50
1.00
1.50
2.00
2.50
3.00
Quick Ratio - Samsung
Electronics
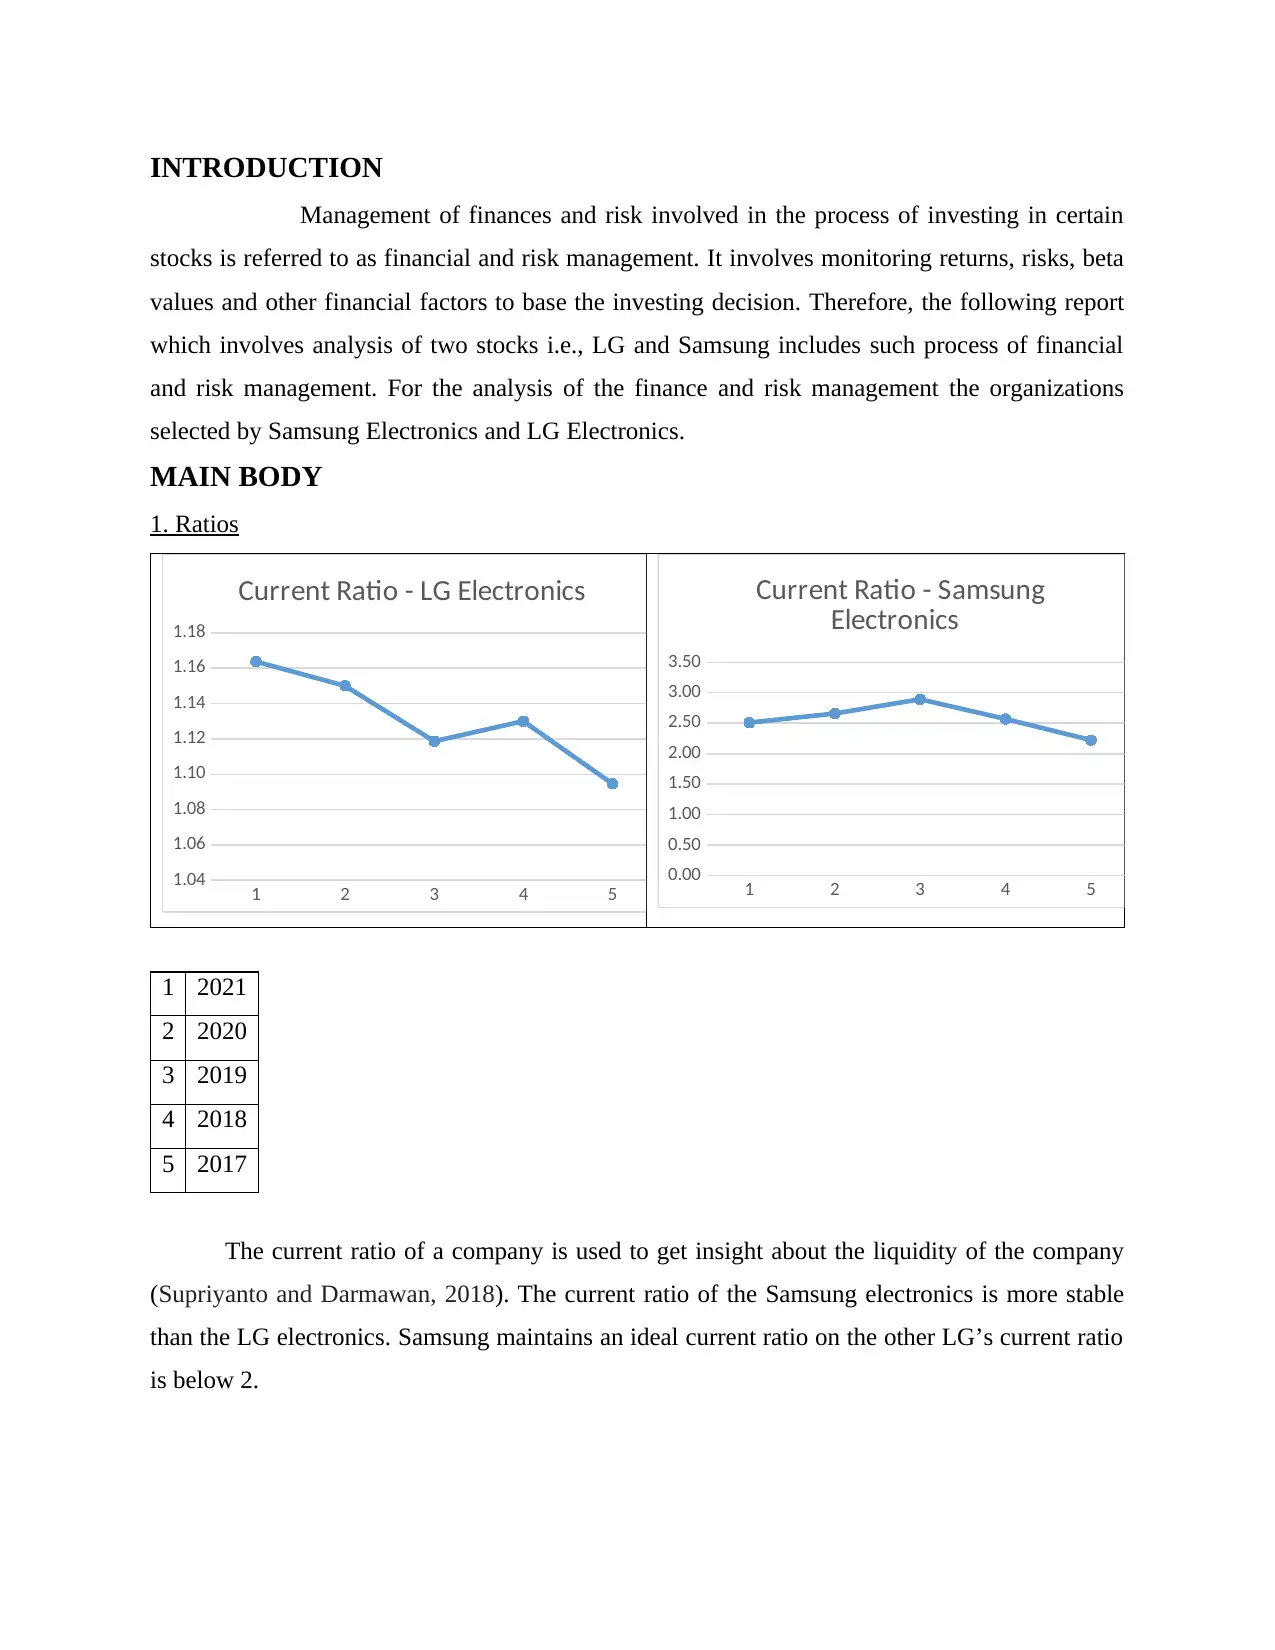
Quick ratio also depicts the liquidity position of the company. A quick ratio of 1 is
considered to be an ideal ratio. LG is having a ratio below the standard level for all the five
years. Samsung maintains its ratio above the standard requirement, which is also not good. The
results show that Samsung is more capable to pay more its current obligations.
1 2 3 4 5
0.00%
1.00%
2.00%
3.00%
4.00%
5.00%
Return On Assets Ratio - LG
Electronics
1 2 3 4 5
0.00%
2.00%
4.00%
6.00%
8.00%
10.00%
12.00%
14.00%
16.00%
Return On Assets Ratio -
Samsung Electronics
Return of assets ratio is calculated to know how efficiently a company make use of its
total assets to generate income. Samsung make high use of its assets to earn profits. The
contribution of this company’s assets in generating income is more.
0.73
0.74
0.75
0.76
0.77
0.78
0.79
Quick Ratio - LG Electronics
1 2 3 4 5
0.00
0.50
1.00
1.50
2.00
2.50
3.00
Quick Ratio - Samsung
Electronics
Quick ratio also depicts the liquidity position of the company. A quick ratio of 1 is
considered to be an ideal ratio. LG is having a ratio below the standard level for all the five
years. Samsung maintains its ratio above the standard requirement, which is also not good. The
results show that Samsung is more capable to pay more its current obligations.
1 2 3 4 5
0.00%
1.00%
2.00%
3.00%
4.00%
5.00%
Return On Assets Ratio - LG
Electronics
1 2 3 4 5
0.00%
2.00%
4.00%
6.00%
8.00%
10.00%
12.00%
14.00%
16.00%
Return On Assets Ratio -
Samsung Electronics
Return of assets ratio is calculated to know how efficiently a company make use of its
total assets to generate income. Samsung make high use of its assets to earn profits. The
contribution of this company’s assets in generating income is more.
Paraphrase This Document
Need a fresh take? Get an instant paraphrase of this document with our AI Paraphraser
1 2 3 4 5
0.00%
2.00%
4.00%
6.00%
8.00%
10.00%
12.00%
14.00%
Return On Equity Ratio - LG
Electronics
1 2 3 4 5
0.00%
5.00%
10.00%
15.00%
20.00%
25.00%
Return On Equity Ratio -
Samsung Electronics
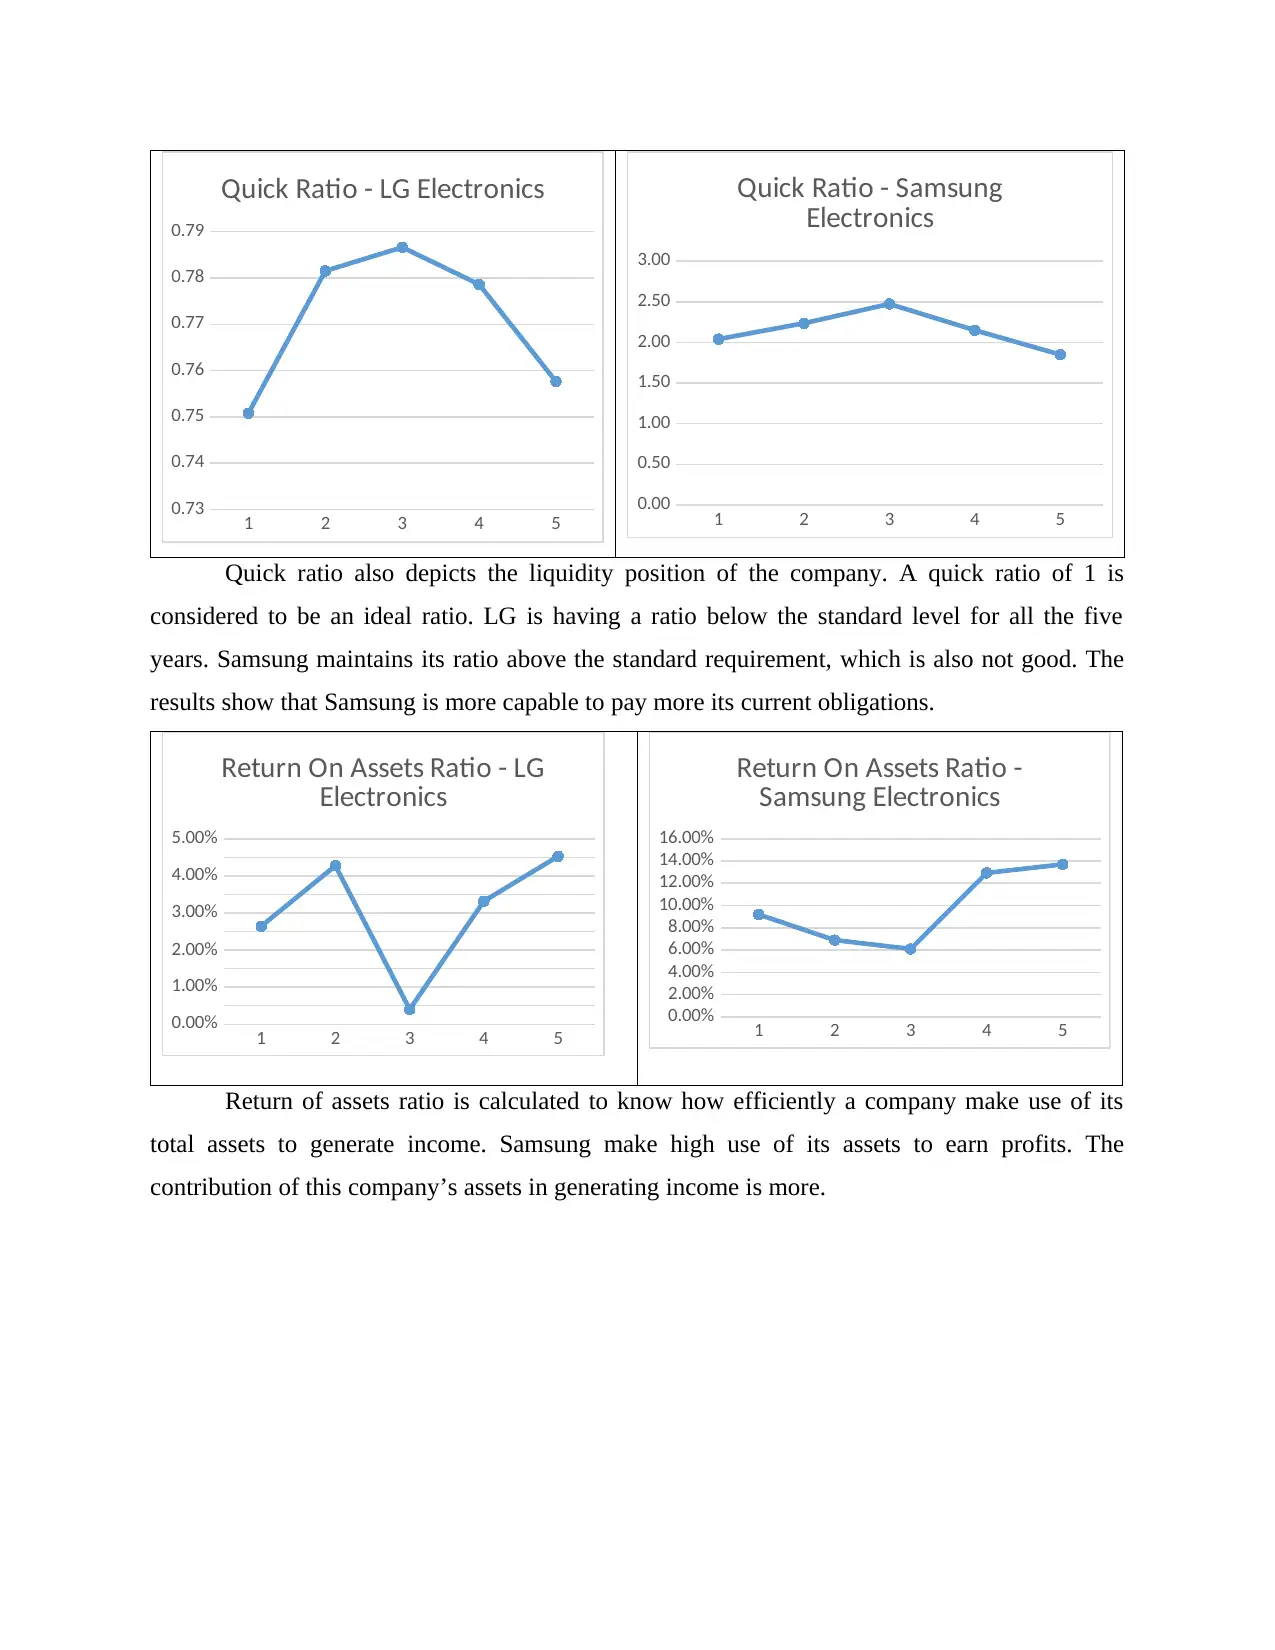
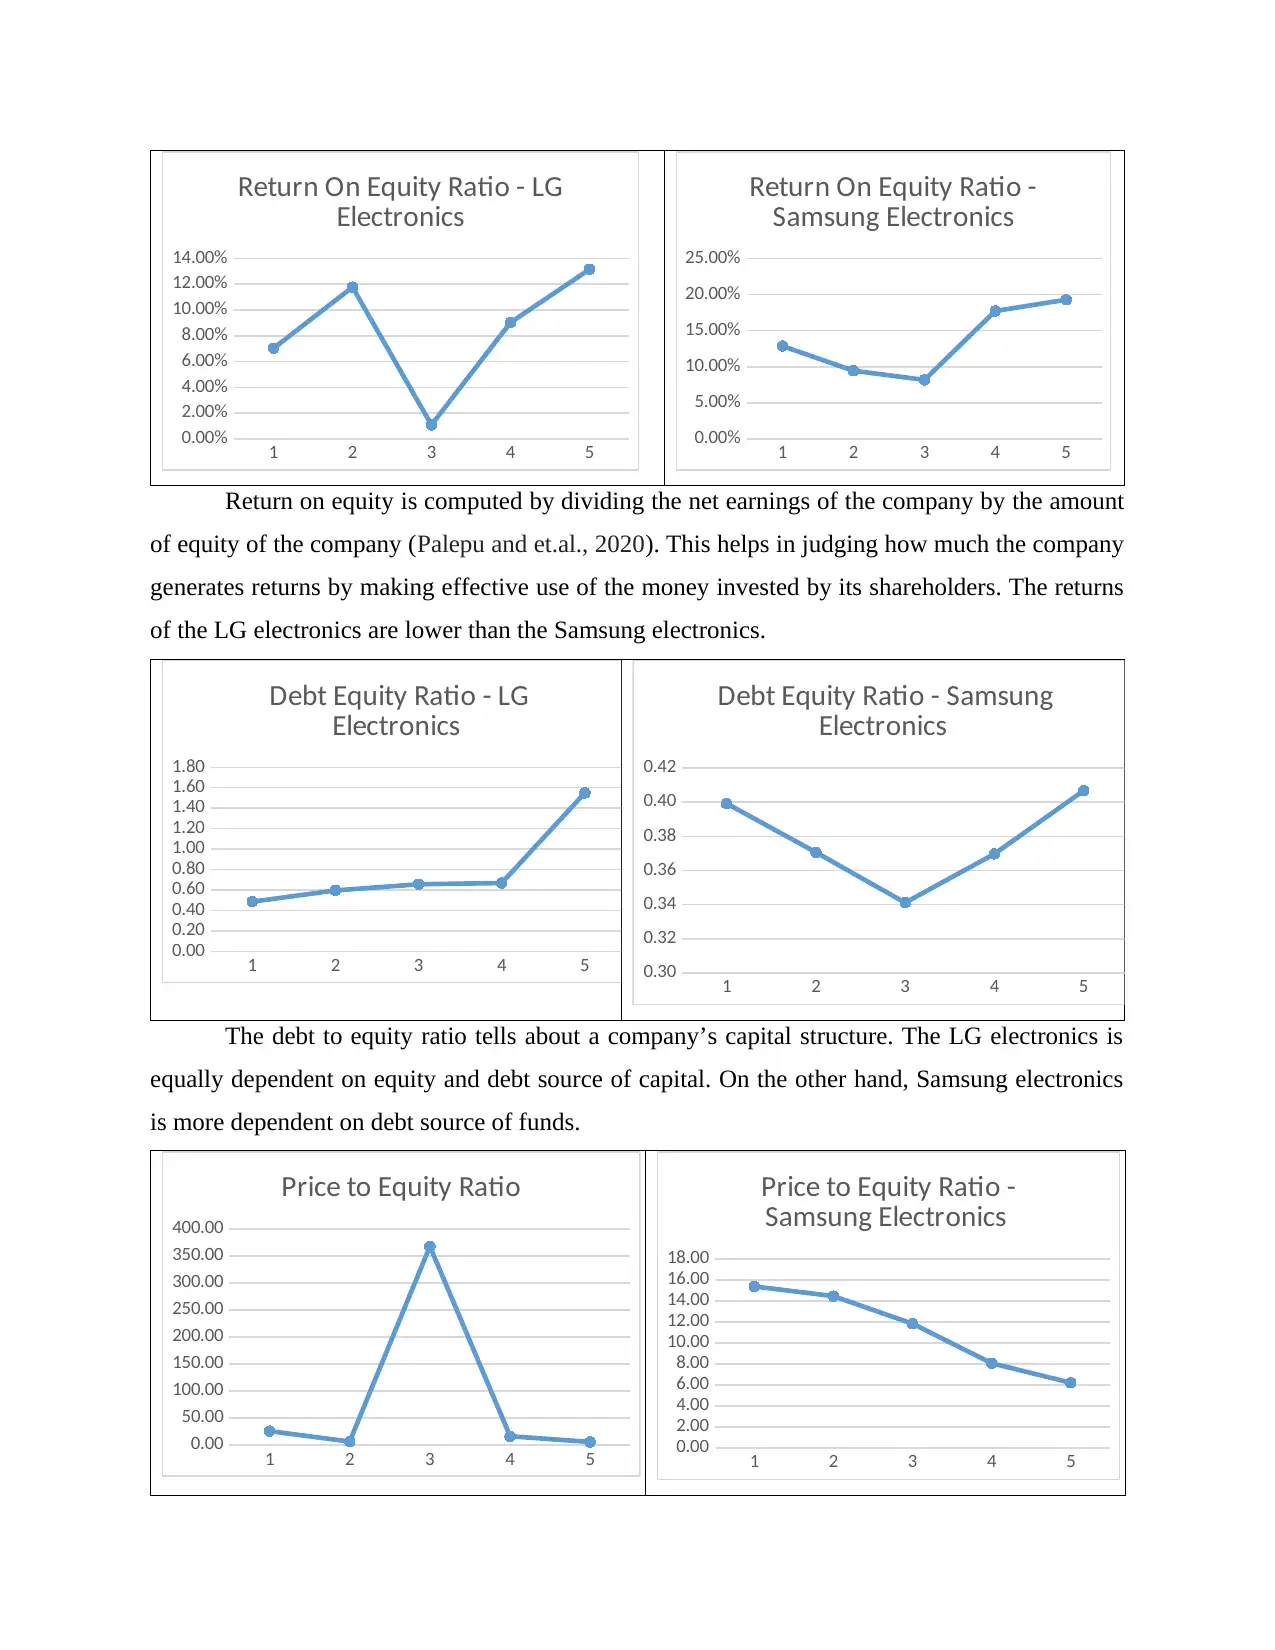
Return on equity is computed by dividing the net earnings of the company by the amount
of equity of the company (Palepu and et.al., 2020). This helps in judging how much the company
generates returns by making effective use of the money invested by its shareholders. The returns
of the LG electronics are lower than the Samsung electronics.
1 2 3 4 5
0.00
0.20
0.40
0.60
0.80
1.00
1.20
1.40
1.60
1.80
Debt Equity Ratio - LG
Electronics
1 2 3 4 5
0.30
0.32
0.34
0.36
0.38
0.40
0.42
Debt Equity Ratio - Samsung
Electronics
The debt to equity ratio tells about a company’s capital structure. The LG electronics is
equally dependent on equity and debt source of capital. On the other hand, Samsung electronics
is more dependent on debt source of funds.
1 2 3 4 5
0.00
50.00
100.00
150.00
200.00
250.00
300.00
350.00
400.00
Price to Equity Ratio
1 2 3 4 5
0.00
2.00
4.00
6.00
8.00
10.00
12.00
14.00
16.00
18.00
Price to Equity Ratio -
Samsung Electronics
0.00%
2.00%
4.00%
6.00%
8.00%
10.00%
12.00%
14.00%
Return On Equity Ratio - LG
Electronics
1 2 3 4 5
0.00%
5.00%
10.00%
15.00%
20.00%
25.00%
Return On Equity Ratio -
Samsung Electronics
Return on equity is computed by dividing the net earnings of the company by the amount
of equity of the company (Palepu and et.al., 2020). This helps in judging how much the company
generates returns by making effective use of the money invested by its shareholders. The returns
of the LG electronics are lower than the Samsung electronics.
1 2 3 4 5
0.00
0.20
0.40
0.60
0.80
1.00
1.20
1.40
1.60
1.80
Debt Equity Ratio - LG
Electronics
1 2 3 4 5
0.30
0.32
0.34
0.36
0.38
0.40
0.42
Debt Equity Ratio - Samsung
Electronics
The debt to equity ratio tells about a company’s capital structure. The LG electronics is
equally dependent on equity and debt source of capital. On the other hand, Samsung electronics
is more dependent on debt source of funds.
1 2 3 4 5
0.00
50.00
100.00
150.00
200.00
250.00
300.00
350.00
400.00
Price to Equity Ratio
1 2 3 4 5
0.00
2.00
4.00
6.00
8.00
10.00
12.00
14.00
16.00
18.00
Price to Equity Ratio -
Samsung Electronics
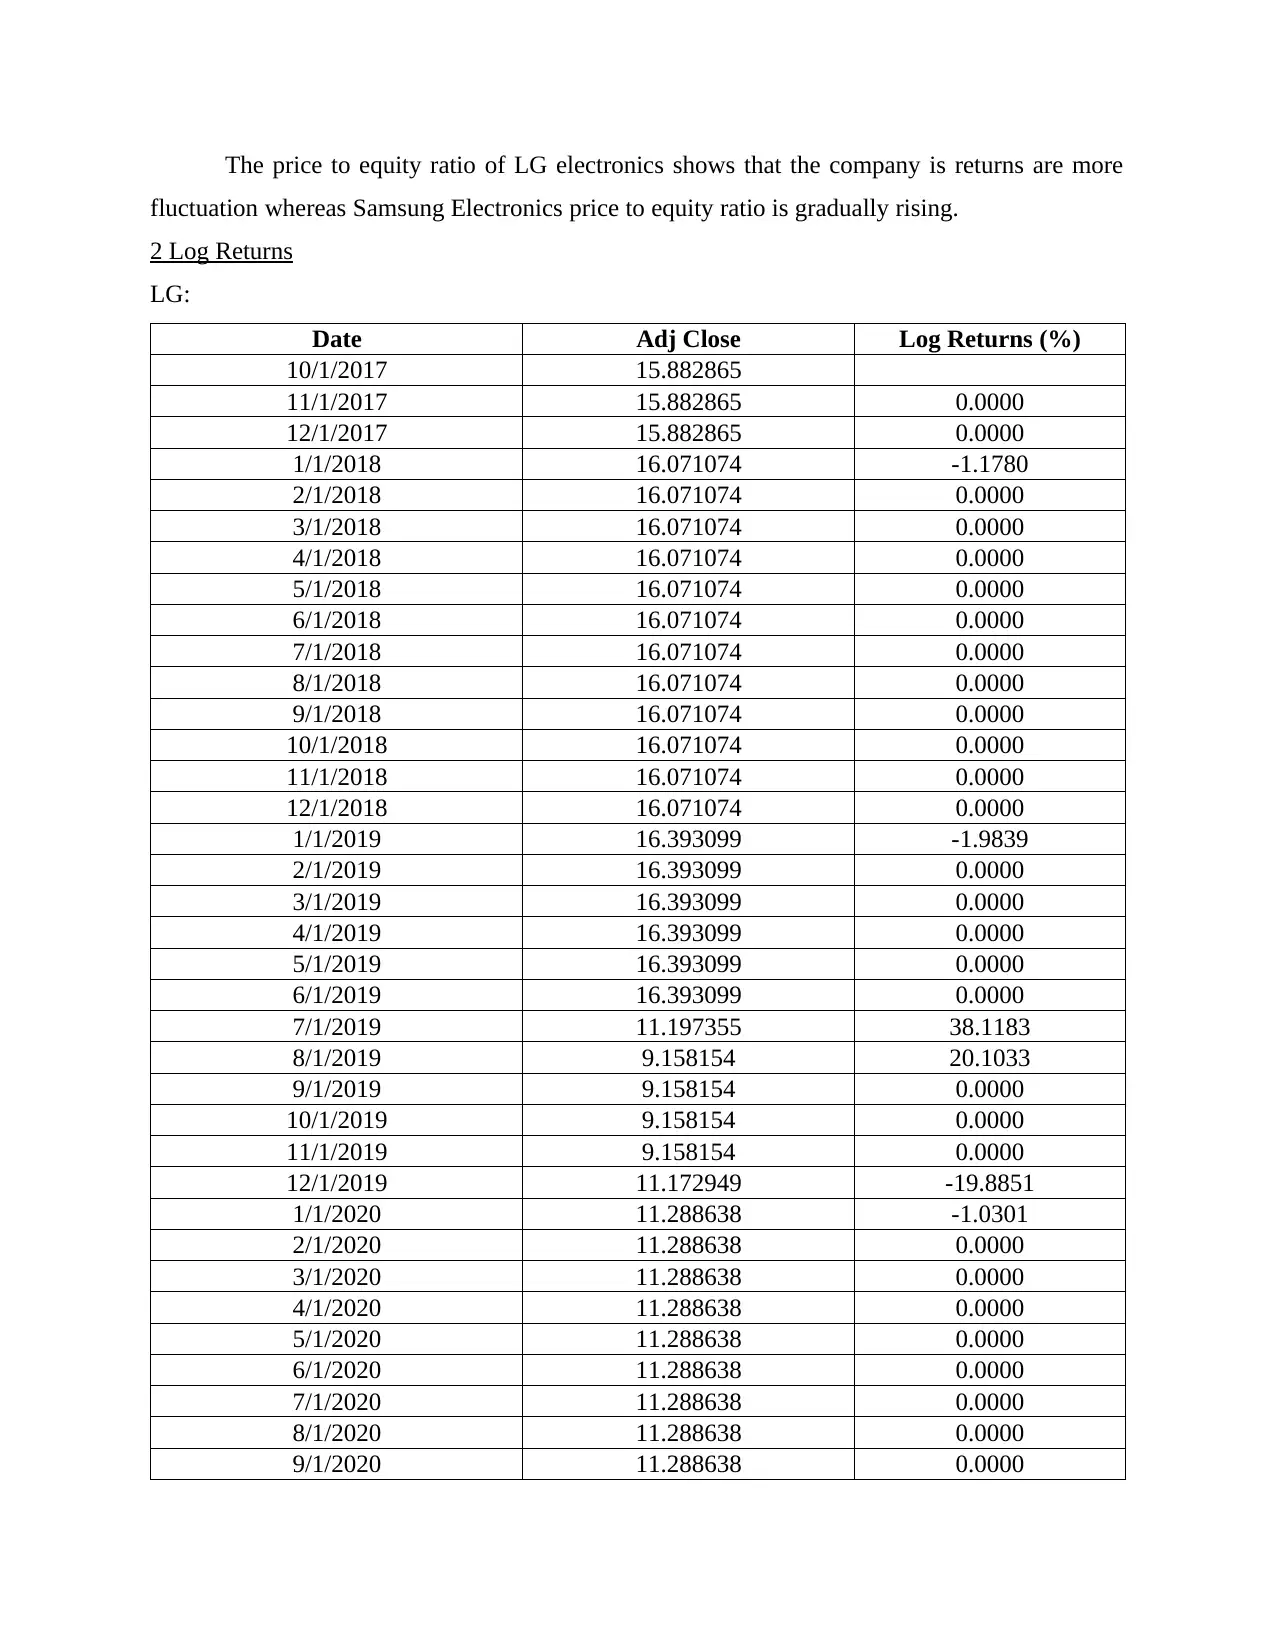
The price to equity ratio of LG electronics shows that the company is returns are more
fluctuation whereas Samsung Electronics price to equity ratio is gradually rising.
2 Log Returns
LG:
Date Adj Close Log Returns (%)
10/1/2017 15.882865
11/1/2017 15.882865 0.0000
12/1/2017 15.882865 0.0000
1/1/2018 16.071074 -1.1780
2/1/2018 16.071074 0.0000
3/1/2018 16.071074 0.0000
4/1/2018 16.071074 0.0000
5/1/2018 16.071074 0.0000
6/1/2018 16.071074 0.0000
7/1/2018 16.071074 0.0000
8/1/2018 16.071074 0.0000
9/1/2018 16.071074 0.0000
10/1/2018 16.071074 0.0000
11/1/2018 16.071074 0.0000
12/1/2018 16.071074 0.0000
1/1/2019 16.393099 -1.9839
2/1/2019 16.393099 0.0000
3/1/2019 16.393099 0.0000
4/1/2019 16.393099 0.0000
5/1/2019 16.393099 0.0000
6/1/2019 16.393099 0.0000
7/1/2019 11.197355 38.1183
8/1/2019 9.158154 20.1033
9/1/2019 9.158154 0.0000
10/1/2019 9.158154 0.0000
11/1/2019 9.158154 0.0000
12/1/2019 11.172949 -19.8851
1/1/2020 11.288638 -1.0301
2/1/2020 11.288638 0.0000
3/1/2020 11.288638 0.0000
4/1/2020 11.288638 0.0000
5/1/2020 11.288638 0.0000
6/1/2020 11.288638 0.0000
7/1/2020 11.288638 0.0000
8/1/2020 11.288638 0.0000
9/1/2020 11.288638 0.0000
⊘ This is a preview!⊘
Do you want full access?
Subscribe today to unlock all pages.
Trusted by 1+ million students worldwide
10/1/2020 11.288638 0.0000
11/1/2020 11.288638 0.0000
12/1/2020 11.288638 0.0000
1/1/2021 33.267841 -108.0794
2/1/2021 33.267841 0.0000
3/1/2021 33.267841 0.0000
4/1/2021 33.267841 0.0000
5/1/2021 33.267841 0.0000
6/1/2021 33.267841 0.0000
7/1/2021 33.267841 0.0000
8/1/2021 33.267841 0.0000
9/1/2021 33.267841 0.0000
10/1/2021 33.267841 0.0000
11/1/2021 25.060307 28.3306
12/1/2021 26.638908 -6.1088
1/1/2022 28.200001 -5.6949
2/1/2022 24.799999 12.8478
3/1/2022 24 3.2790
4/1/2022 22.4 6.8993
5/1/2022 21.200001 5.5060
6/1/2022 17 22.0788
7/1/2022 17 0.0000
8/1/2022 17.1 -0.5865
9/1/2022 15.3 11.1226
9/15/2022 15.3 0.0000
Samsung:
Date Adj Close Log Returns (%)
10/1/2017 47691.1563
11/1/2017 43985.3125 8.0890
12/1/2017 44123.8477 -0.3145
1/1/2018 43594.9531 1.2059
2/1/2018 41113.8047 5.8597
3/1/2018 43000.8828 -4.4877
4/1/2018 46642.3047 -8.1287
5/1/2018 44618.207 4.4366
6/1/2018 41054.0234 8.3253
7/1/2018 41004.7305 0.1201
8/1/2018 42955.2305 -4.6471
9/1/2018 41182.0586 4.2156
10/1/2018 37874.2266 8.3732
11/1/2018 37382.9375 1.3056
12/1/2018 34569.168 7.8252
Paraphrase This Document
Need a fresh take? Get an instant paraphrase of this document with our AI Paraphraser
1/1/2019 41608.0234 -18.5331
2/1/2019 40661.3555 2.3015
3/1/2019 40255.6484 1.0028
4/1/2019 41662.7656 -3.4357
5/1/2019 38618.6992 7.5871
6/1/2019 42707.7422 -10.0644
7/1/2019 41530.1289 2.7961
8/1/2019 40293.8438 3.0220
9/1/2019 44918.4727 -10.8650
10/1/2019 46489.2617 -3.4372
11/1/2019 46397.0117 0.1986
12/1/2019 51470.2539 -10.3769
1/1/2020 52358.2656 -1.7106
2/1/2020 50315.9141 3.9788
3/1/2020 44328.1406 12.6702
4/1/2020 46759.6055 -5.3400
5/1/2020 47414.2461 -1.3903
6/1/2020 49378.1367 -4.0585
7/1/2020 54509.6563 -9.8870
8/1/2020 50838.0156 6.9733
9/1/2020 54792.0938 -7.4901
10/1/2020 53613.5703 2.1744
11/1/2020 63180.6602 -16.4196
12/1/2020 76726.1406 -19.4244
1/1/2021 79628.1563 -3.7125
2/1/2021 80113.6953 -0.6079
3/1/2021 79045.5234 1.3423
4/1/2021 79494.3125 -0.5662
5/1/2021 78518.9219 1.2346
6/1/2021 78714 -0.2481
7/1/2021 76907.1328 2.3222
8/1/2021 75143.6563 2.3197
9/1/2021 72596.4141 3.4486
10/1/2021 68708.75 5.5039
11/1/2021 70185.2969 -2.1262
12/1/2021 77075.8594 -9.3651
1/1/2022 72479.875 6.1481
2/1/2022 71095.5391 1.9284
3/1/2022 68821.2656 3.2512
4/1/2022 66990.375 2.6964
5/1/2022 66990.375 0.0000
6/1/2022 56653.5859 16.7594
7/1/2022 61400 -8.0455
8/1/2022 59700 2.8078
9/1/2022 55300 7.6559
9/22/2022 54400 1.6409
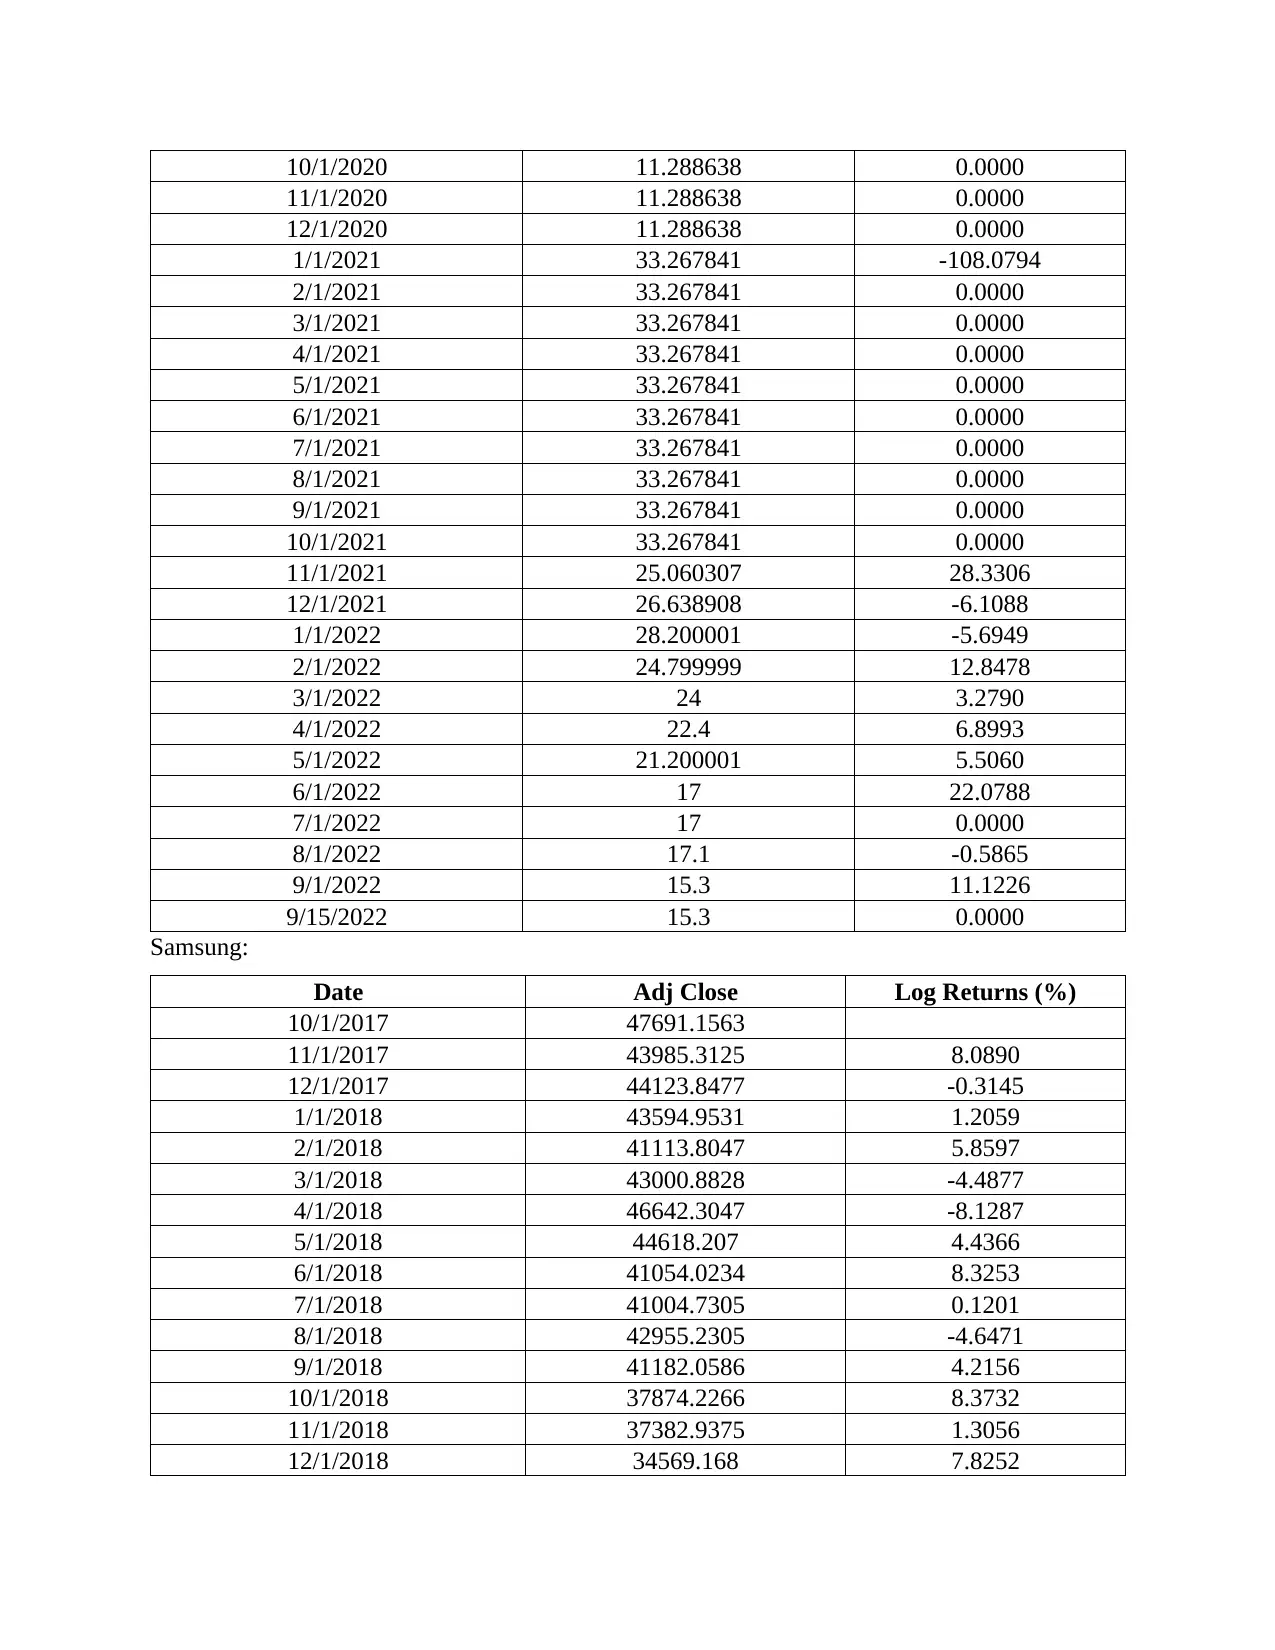
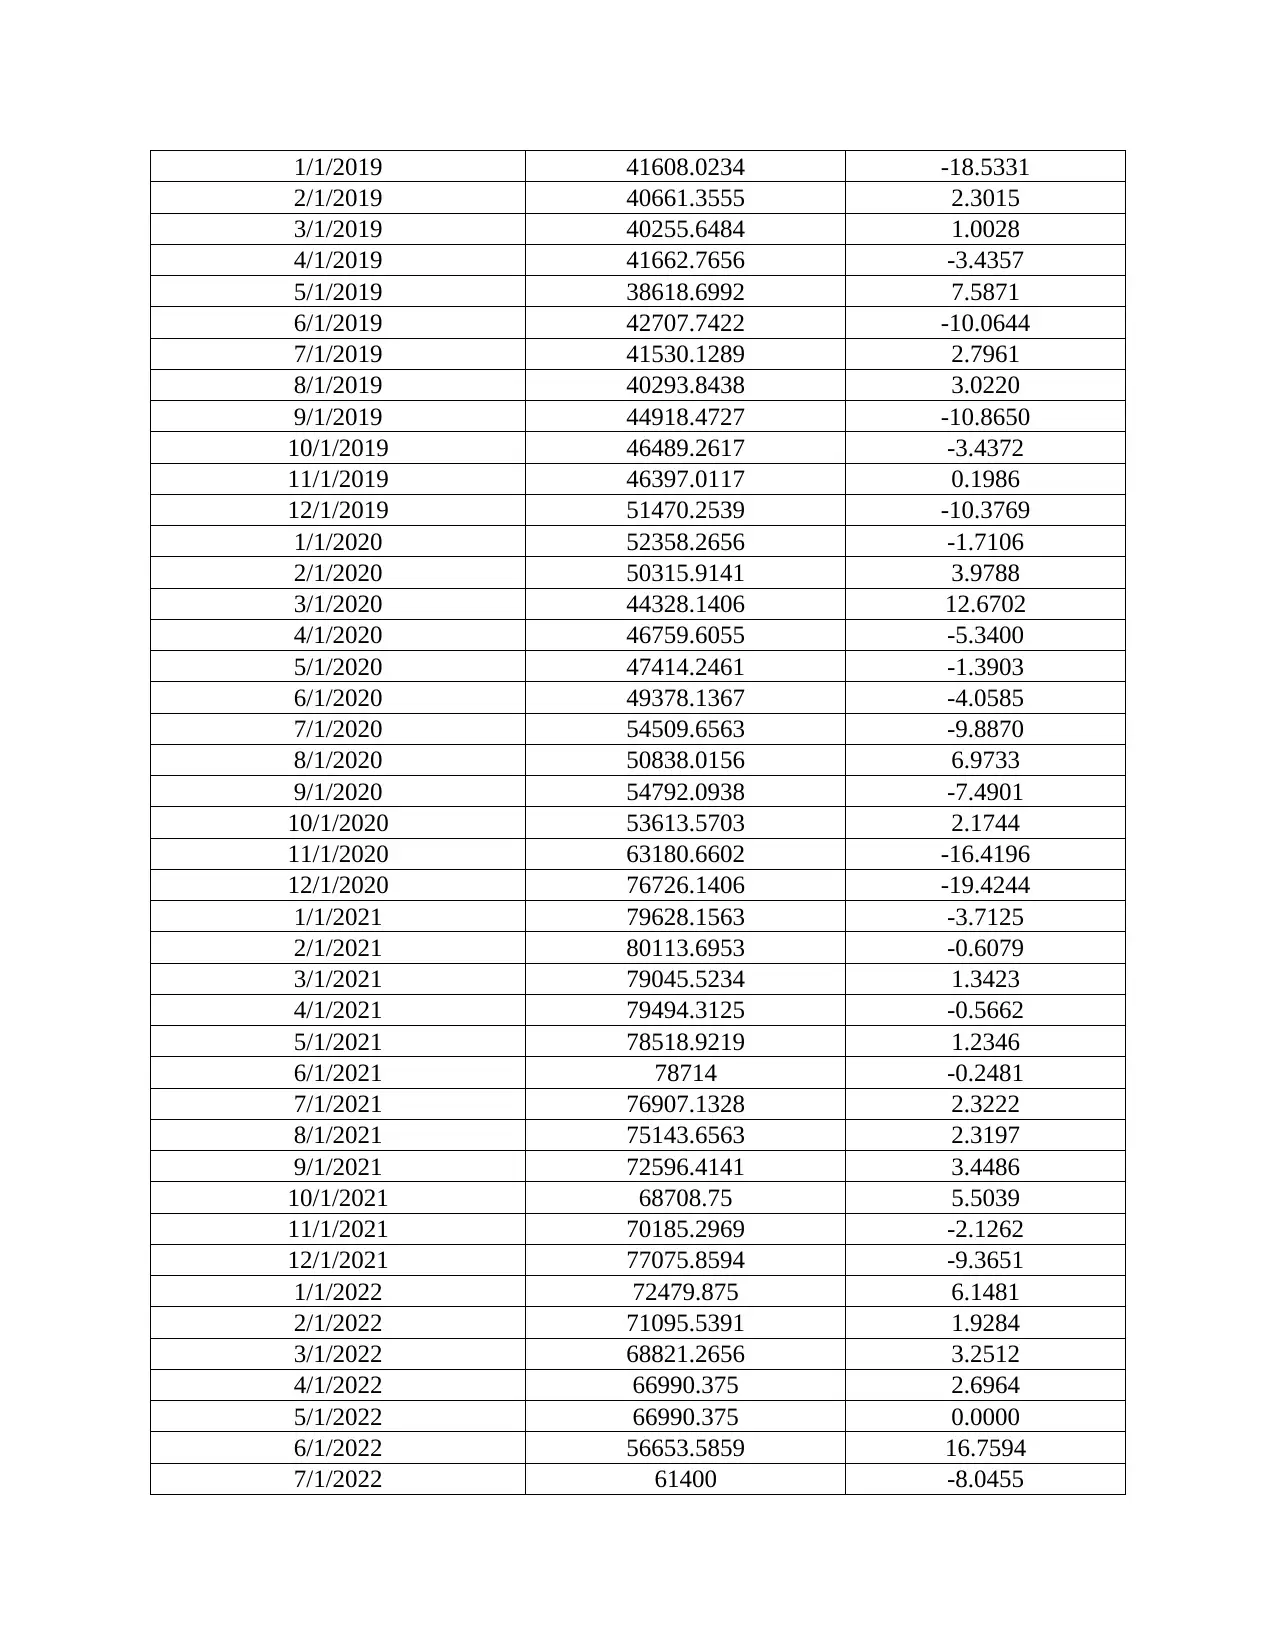
The above tables show the log returns for both LG as well as Samsung. In calculation of
log return, it is always assumed that the returns of the stocks are continuously compounded. This
calculation is done by obtaining natural log of closing value divided by opening value.
3 Arithmetic Average Returns
Individual Stocks:
Stock Average Stock Return (%)
LG -4.2208
Samsung -6.3170
Market Portfolio:
Stock Return (X) Weights (W)
Average Return of Stocks 1 2 3 4 5
LG -4.2208 0.5 0.7 0.6 0.3 0.4
Samsung -6.3170 0.5 0.3 0.4 0.7 0.6
1 2 3 4 5
LG -4.2208 -2.1104 -2.9546 -2.5325 -1.2662 -1.6883
Samsung -6.3170 -3.1585 -1.8951 -2.5268 -4.4219 -3.7902
Portfolio Return (%) -5.2689 -4.8497 -5.0593 -5.6882 -5.4785
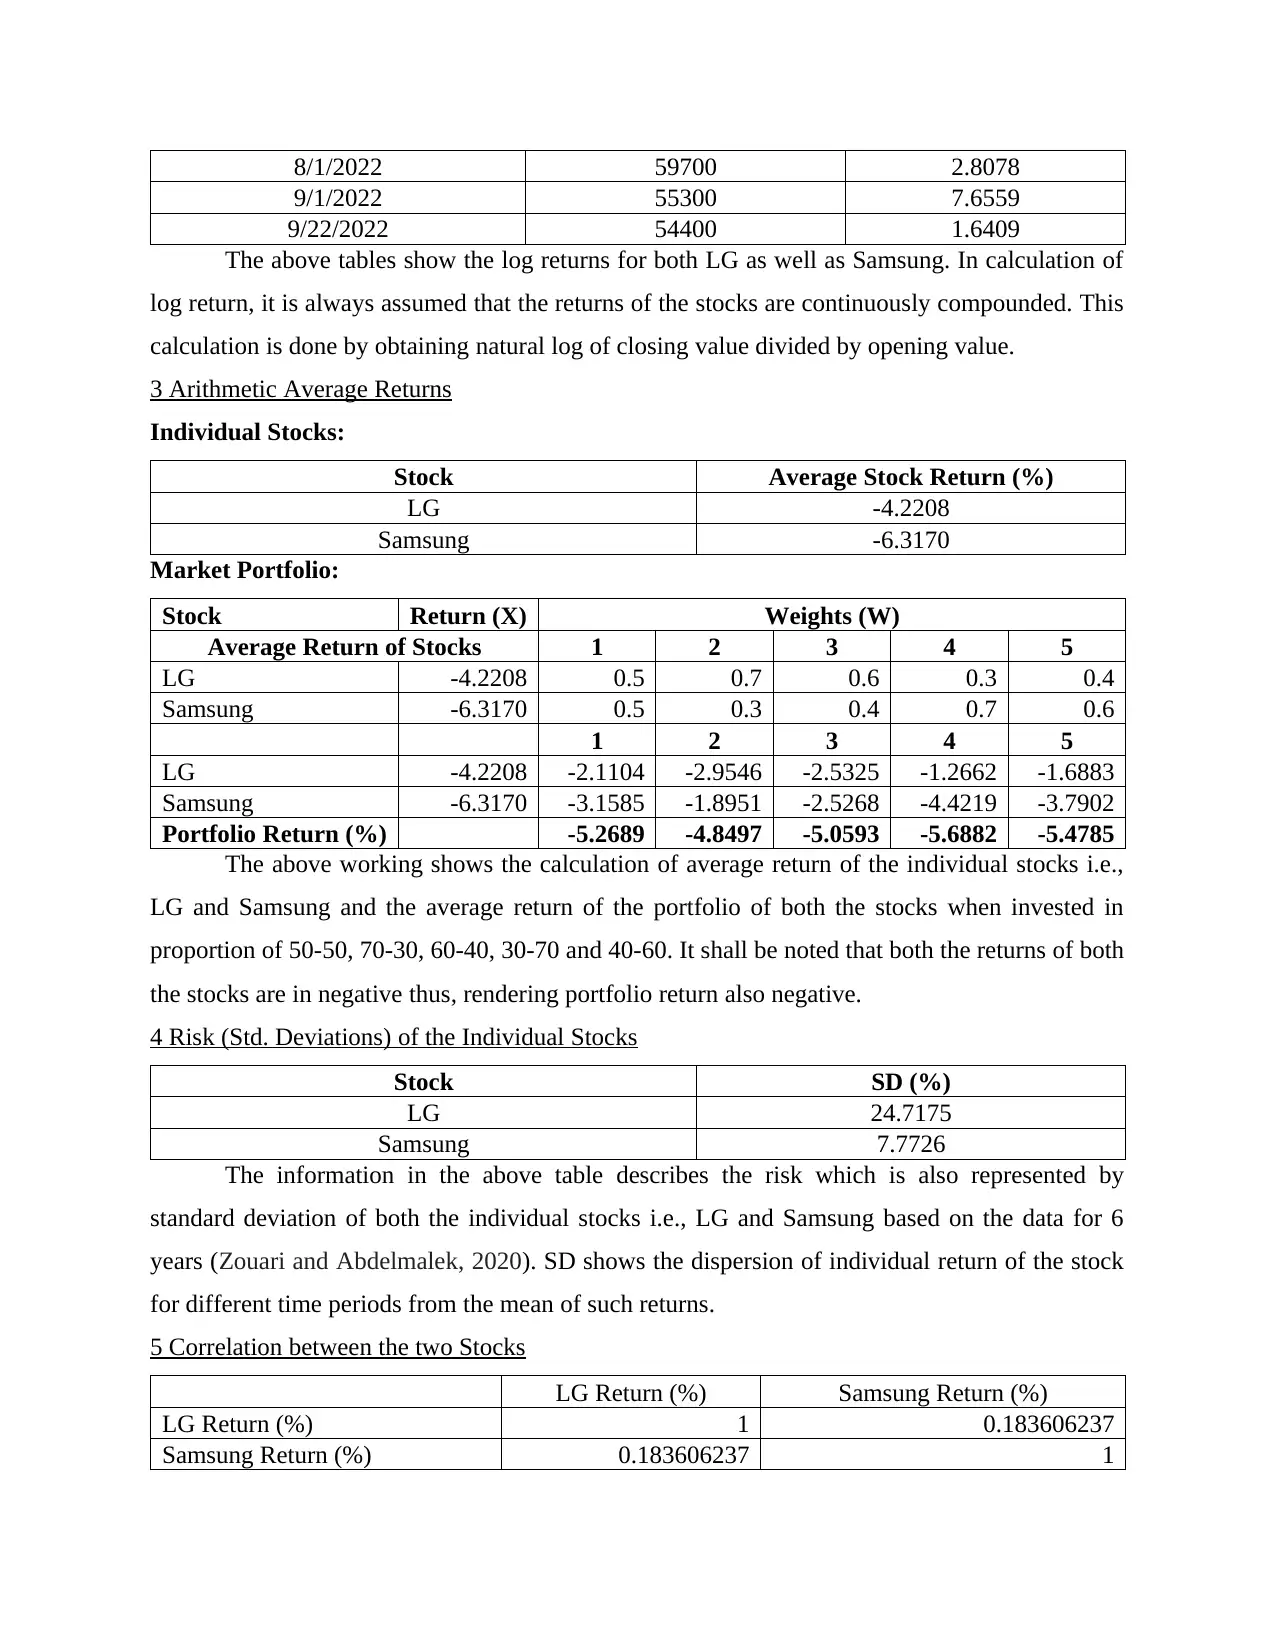
The above working shows the calculation of average return of the individual stocks i.e.,
LG and Samsung and the average return of the portfolio of both the stocks when invested in
proportion of 50-50, 70-30, 60-40, 30-70 and 40-60. It shall be noted that both the returns of both
the stocks are in negative thus, rendering portfolio return also negative.
4 Risk (Std. Deviations) of the Individual Stocks
Stock SD (%)
LG 24.7175
Samsung 7.7726
The information in the above table describes the risk which is also represented by
standard deviation of both the individual stocks i.e., LG and Samsung based on the data for 6
years (Zouari and Abdelmalek, 2020). SD shows the dispersion of individual return of the stock
for different time periods from the mean of such returns.
5 Correlation between the two Stocks
LG Return (%) Samsung Return (%)
LG Return (%) 1 0.183606237
Samsung Return (%) 0.183606237 1
9/1/2022 55300 7.6559
9/22/2022 54400 1.6409
The above tables show the log returns for both LG as well as Samsung. In calculation of
log return, it is always assumed that the returns of the stocks are continuously compounded. This
calculation is done by obtaining natural log of closing value divided by opening value.
3 Arithmetic Average Returns
Individual Stocks:
Stock Average Stock Return (%)
LG -4.2208
Samsung -6.3170
Market Portfolio:
Stock Return (X) Weights (W)
Average Return of Stocks 1 2 3 4 5
LG -4.2208 0.5 0.7 0.6 0.3 0.4
Samsung -6.3170 0.5 0.3 0.4 0.7 0.6
1 2 3 4 5
LG -4.2208 -2.1104 -2.9546 -2.5325 -1.2662 -1.6883
Samsung -6.3170 -3.1585 -1.8951 -2.5268 -4.4219 -3.7902
Portfolio Return (%) -5.2689 -4.8497 -5.0593 -5.6882 -5.4785
The above working shows the calculation of average return of the individual stocks i.e.,
LG and Samsung and the average return of the portfolio of both the stocks when invested in
proportion of 50-50, 70-30, 60-40, 30-70 and 40-60. It shall be noted that both the returns of both
the stocks are in negative thus, rendering portfolio return also negative.
4 Risk (Std. Deviations) of the Individual Stocks
Stock SD (%)
LG 24.7175
Samsung 7.7726
The information in the above table describes the risk which is also represented by
standard deviation of both the individual stocks i.e., LG and Samsung based on the data for 6
years (Zouari and Abdelmalek, 2020). SD shows the dispersion of individual return of the stock
for different time periods from the mean of such returns.
5 Correlation between the two Stocks
LG Return (%) Samsung Return (%)
LG Return (%) 1 0.183606237
Samsung Return (%) 0.183606237 1
⊘ This is a preview!⊘
Do you want full access?
Subscribe today to unlock all pages.
Trusted by 1+ million students worldwide
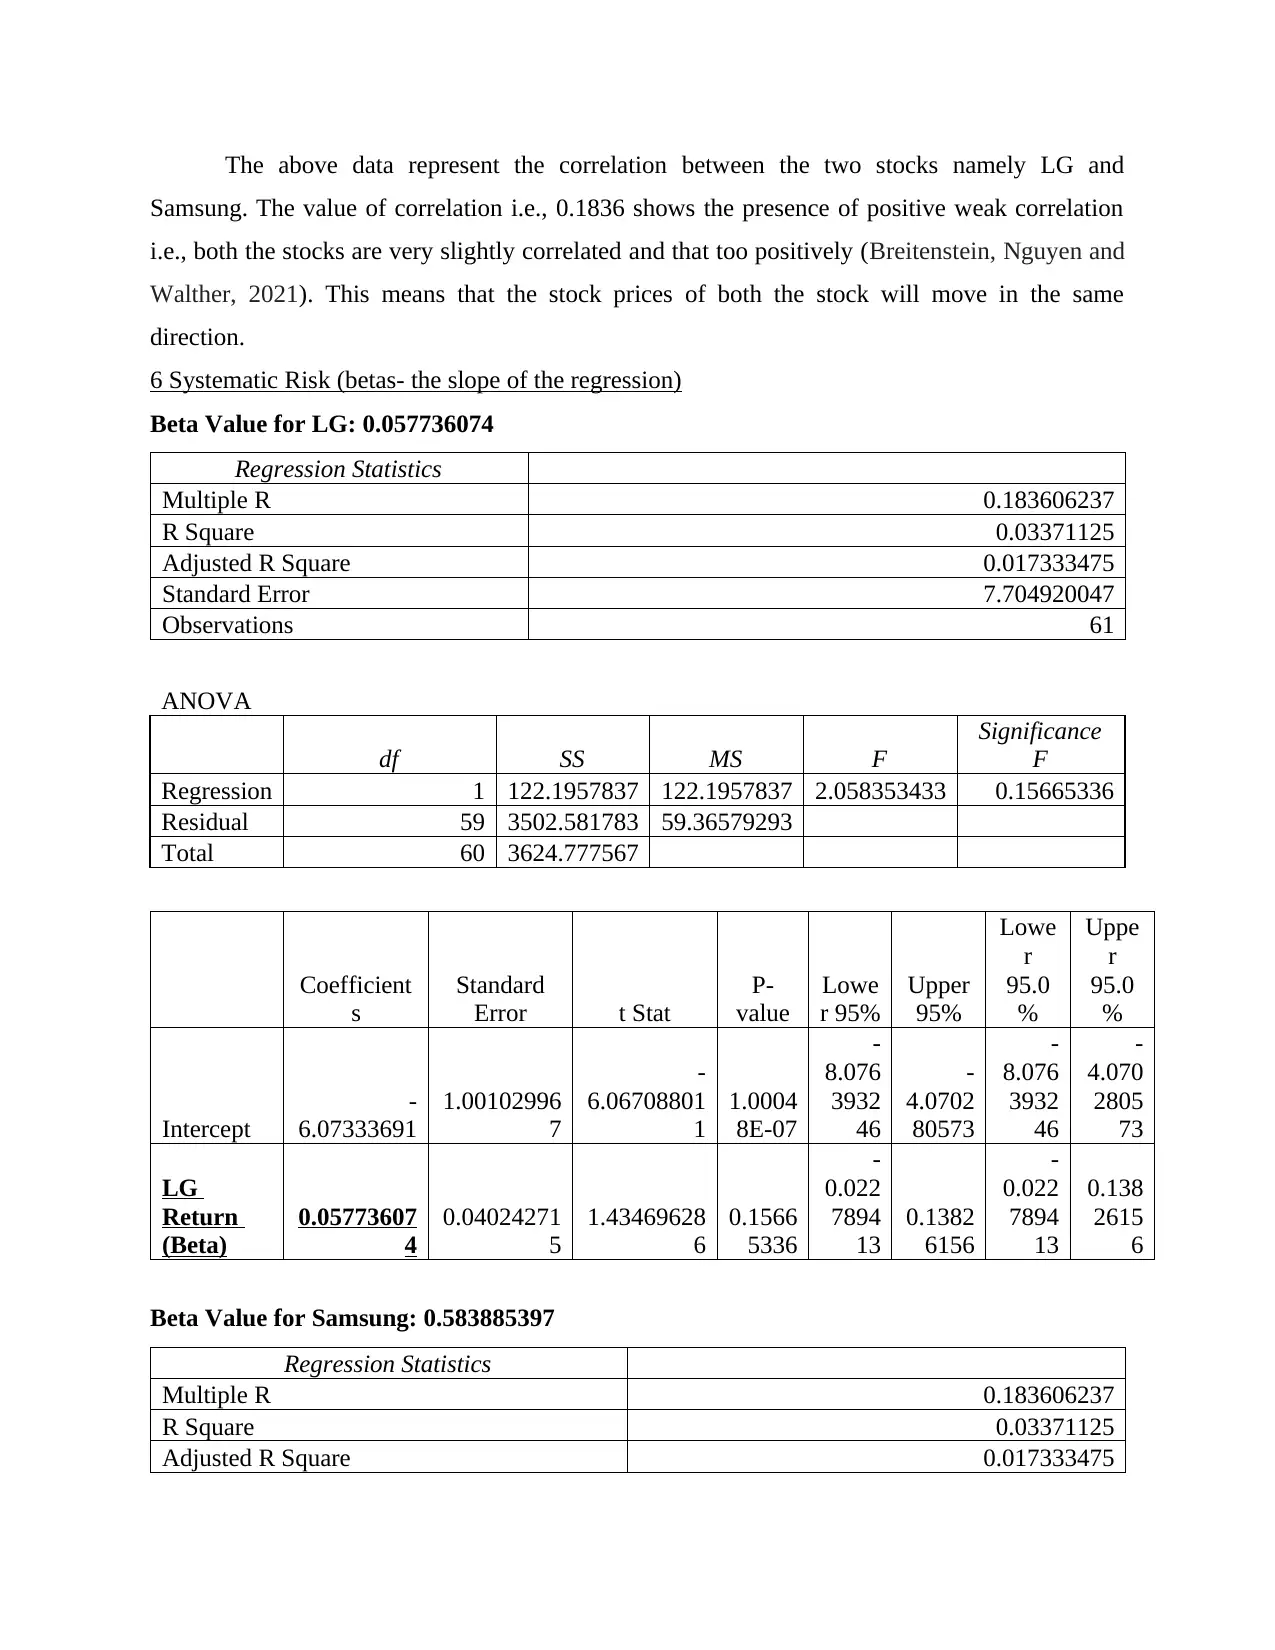
The above data represent the correlation between the two stocks namely LG and
Samsung. The value of correlation i.e., 0.1836 shows the presence of positive weak correlation
i.e., both the stocks are very slightly correlated and that too positively (Breitenstein, Nguyen and
Walther, 2021). This means that the stock prices of both the stock will move in the same
direction.
6 Systematic Risk (betas- the slope of the regression)
Beta Value for LG: 0.057736074
Regression Statistics
Multiple R 0.183606237
R Square 0.03371125
Adjusted R Square 0.017333475
Standard Error 7.704920047
Observations 61
ANOVA
df SS MS F
Significance
F
Regression 1 122.1957837 122.1957837 2.058353433 0.15665336
Residual 59 3502.581783 59.36579293
Total 60 3624.777567
Coefficient
s
Standard
Error t Stat
P-
value
Lowe
r 95%
Upper
95%
Lowe
r
95.0
%
Uppe
r
95.0
%
Intercept
-
6.07333691
1.00102996
7
-
6.06708801
1
1.0004
8E-07
-
8.076
3932
46
-
4.0702
80573
-
8.076
3932
46
-
4.070
2805
73
LG
Return
(Beta)
0.05773607
4
0.04024271
5
1.43469628
6
0.1566
5336
-
0.022
7894
13
0.1382
6156
-
0.022
7894
13
0.138
2615
6
Beta Value for Samsung: 0.583885397
Regression Statistics
Multiple R 0.183606237
R Square 0.03371125
Adjusted R Square 0.017333475
Paraphrase This Document
Need a fresh take? Get an instant paraphrase of this document with our AI Paraphraser
Standard Error 24.50238279
Observations 61
ANOVA
df SS MS F
Significance
F
Regression 1 1235.766986 1235.766986 2.058353433 0.15665336
Residual 59 35421.63899 600.3667625
Total 60 36657.40598
Coefficients
Standard
Error
t
Stat P-value
Lower
95%
Upper
95%
Lower
95.0%
Upper
95.0%
Intercept -0.532383075
4.056040
414
-
0.13
1256
847
0.89601
8684
-
8.6485
01197
7.5837
35047
-
8.64850
1197
7.5837
35047
Samsung
Return
(Beta) 0.583885397
0.406974
914
1.43
4696
286
0.15665
336
-
0.2304
69524
1.3982
40318
-
0.23046
9524
1.3982
40318
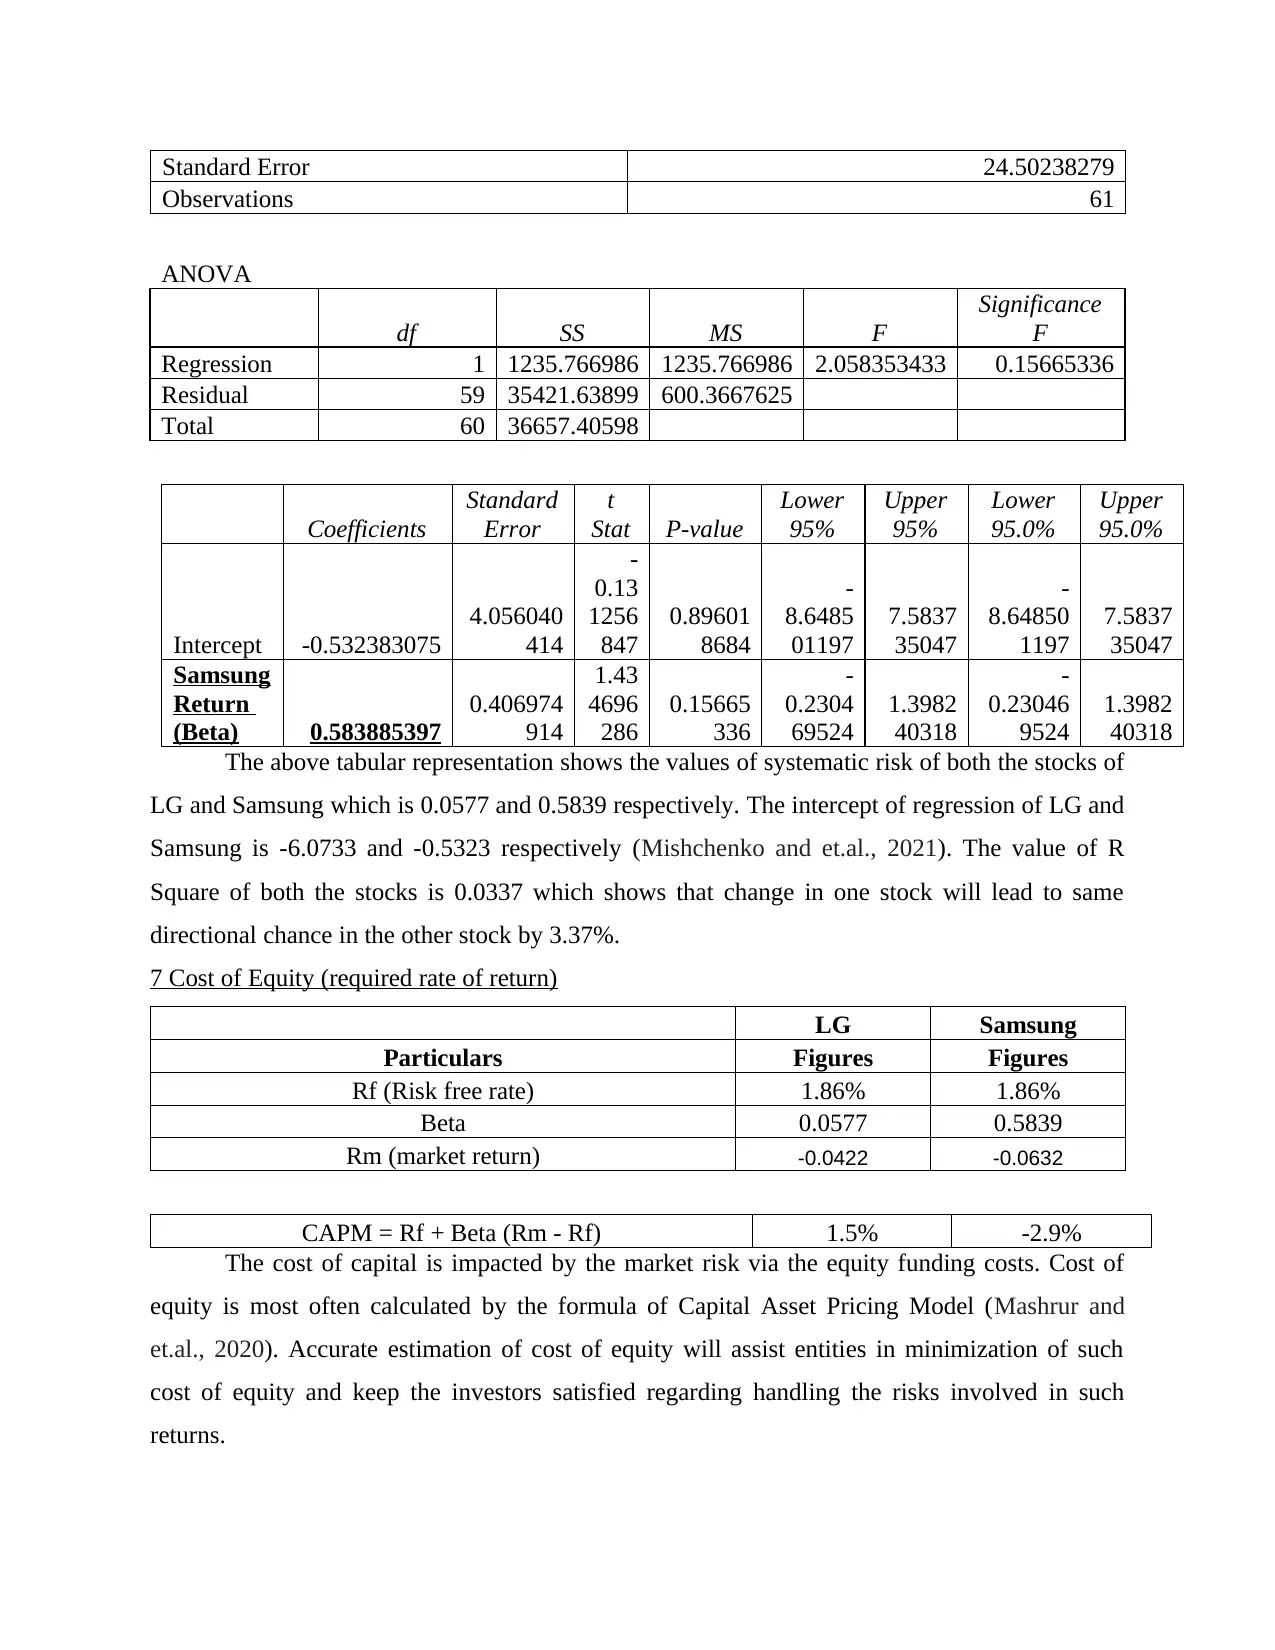
The above tabular representation shows the values of systematic risk of both the stocks of
LG and Samsung which is 0.0577 and 0.5839 respectively. The intercept of regression of LG and
Samsung is -6.0733 and -0.5323 respectively (Mishchenko and et.al., 2021). The value of R
Square of both the stocks is 0.0337 which shows that change in one stock will lead to same
directional chance in the other stock by 3.37%.
7 Cost of Equity (required rate of return)
LG Samsung
Particulars Figures Figures
Rf (Risk free rate) 1.86% 1.86%
Beta 0.0577 0.5839
Rm (market return) -0.0422 -0.0632
CAPM = Rf + Beta (Rm - Rf) 1.5% -2.9%
The cost of capital is impacted by the market risk via the equity funding costs. Cost of
equity is most often calculated by the formula of Capital Asset Pricing Model (Mashrur and
et.al., 2020). Accurate estimation of cost of equity will assist entities in minimization of such
cost of equity and keep the investors satisfied regarding handling the risks involved in such
returns.
Observations 61
ANOVA
df SS MS F
Significance
F
Regression 1 1235.766986 1235.766986 2.058353433 0.15665336
Residual 59 35421.63899 600.3667625
Total 60 36657.40598
Coefficients
Standard
Error
t
Stat P-value
Lower
95%
Upper
95%
Lower
95.0%
Upper
95.0%
Intercept -0.532383075
4.056040
414
-
0.13
1256
847
0.89601
8684
-
8.6485
01197
7.5837
35047
-
8.64850
1197
7.5837
35047
Samsung
Return
(Beta) 0.583885397
0.406974
914
1.43
4696
286
0.15665
336
-
0.2304
69524
1.3982
40318
-
0.23046
9524
1.3982
40318
The above tabular representation shows the values of systematic risk of both the stocks of
LG and Samsung which is 0.0577 and 0.5839 respectively. The intercept of regression of LG and
Samsung is -6.0733 and -0.5323 respectively (Mishchenko and et.al., 2021). The value of R
Square of both the stocks is 0.0337 which shows that change in one stock will lead to same
directional chance in the other stock by 3.37%.
7 Cost of Equity (required rate of return)
LG Samsung
Particulars Figures Figures
Rf (Risk free rate) 1.86% 1.86%
Beta 0.0577 0.5839
Rm (market return) -0.0422 -0.0632
CAPM = Rf + Beta (Rm - Rf) 1.5% -2.9%
The cost of capital is impacted by the market risk via the equity funding costs. Cost of
equity is most often calculated by the formula of Capital Asset Pricing Model (Mashrur and
et.al., 2020). Accurate estimation of cost of equity will assist entities in minimization of such
cost of equity and keep the investors satisfied regarding handling the risks involved in such
returns.
8 Portfolio Return
Stock Return (X) Weights (W)
Average Return of Stocks 1 2 3 4 5
LG -4.2208 0.5 0.7 0.6 0.3 0.4
Samsung -6.3170 0.5 0.3 0.4 0.7 0.6
1 2 3 4 5
LG -4.2208 -2.1104 -2.9546 -2.5325 -1.2662 -1.6883
Samsung -6.3170 -3.1585 -1.8951 -2.5268 -4.4219 -3.7902
Portfolio Return (%) -5.2689 -4.8497 -5.0593 -5.6882 -5.4785
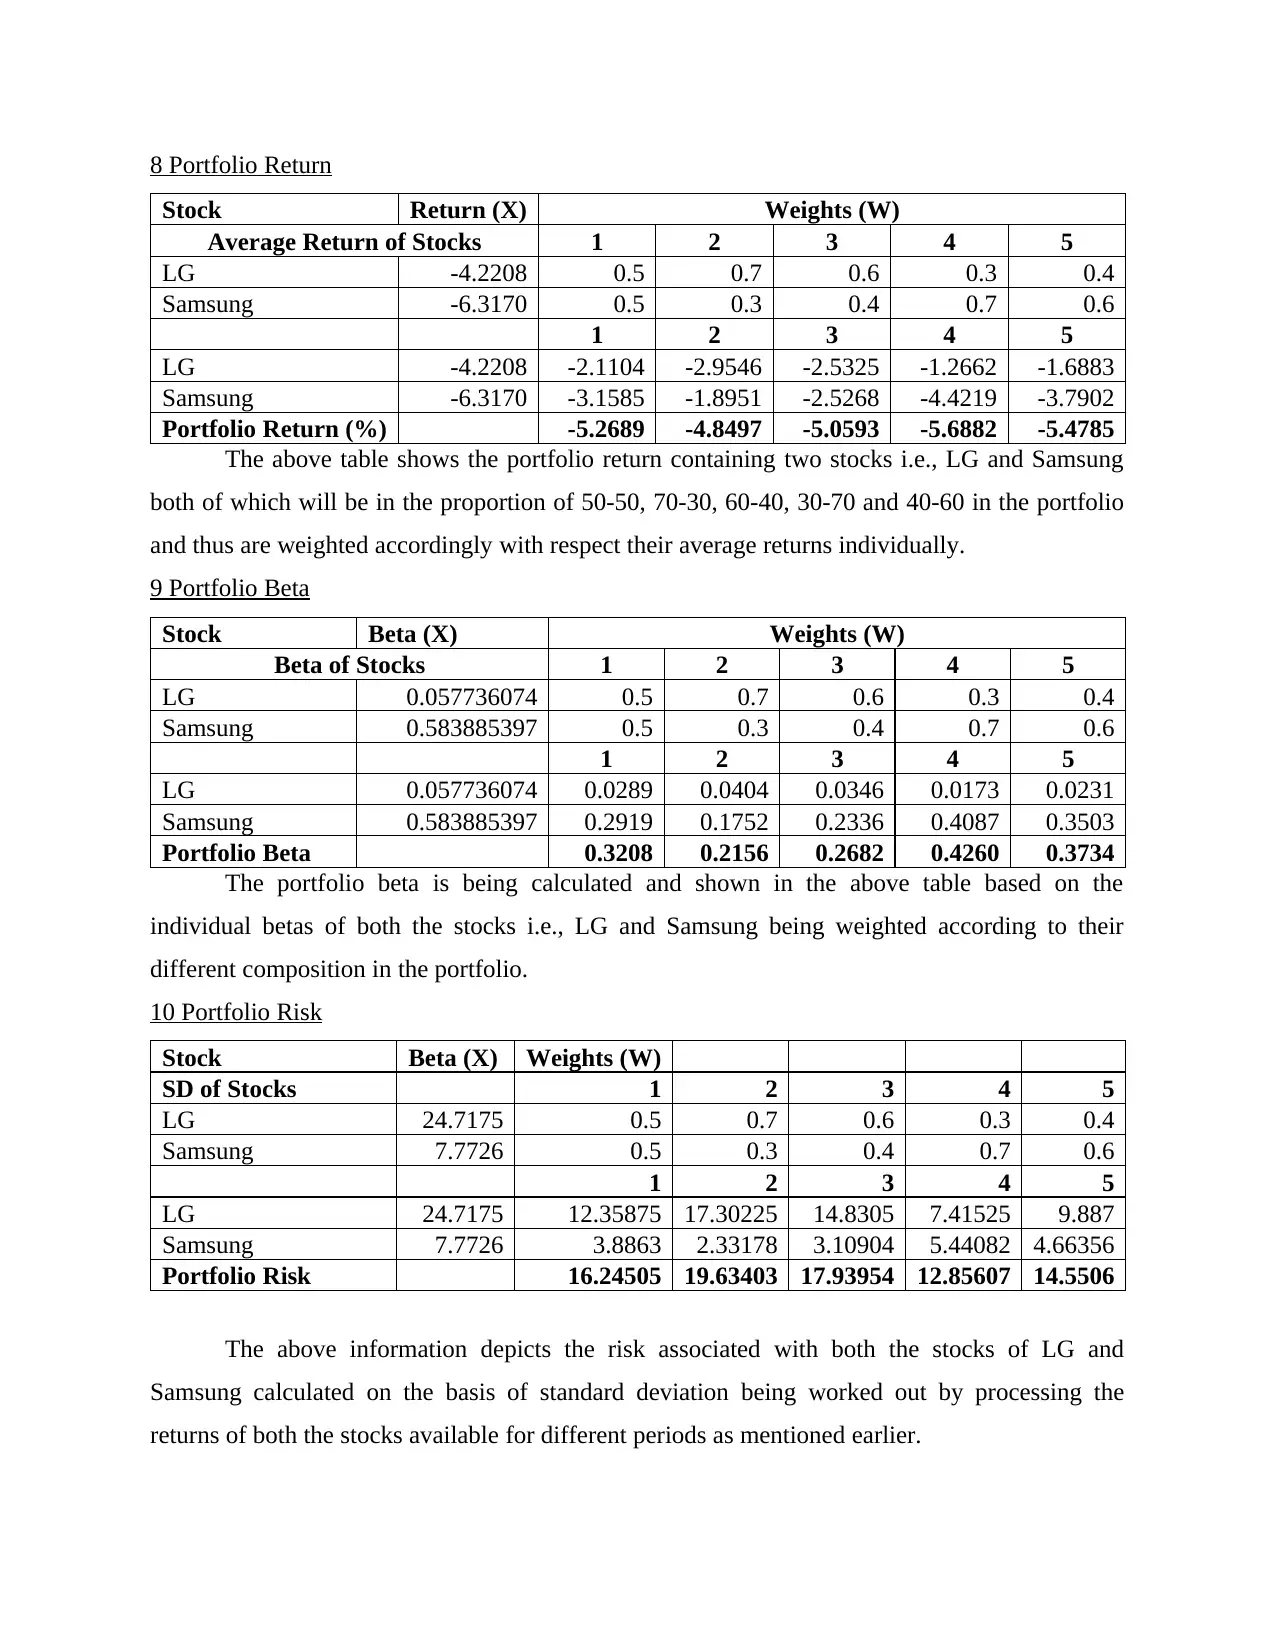
The above table shows the portfolio return containing two stocks i.e., LG and Samsung
both of which will be in the proportion of 50-50, 70-30, 60-40, 30-70 and 40-60 in the portfolio
and thus are weighted accordingly with respect their average returns individually.
9 Portfolio Beta
Stock Beta (X) Weights (W)
Beta of Stocks 1 2 3 4 5
LG 0.057736074 0.5 0.7 0.6 0.3 0.4
Samsung 0.583885397 0.5 0.3 0.4 0.7 0.6
1 2 3 4 5
LG 0.057736074 0.0289 0.0404 0.0346 0.0173 0.0231
Samsung 0.583885397 0.2919 0.1752 0.2336 0.4087 0.3503
Portfolio Beta 0.3208 0.2156 0.2682 0.4260 0.3734
The portfolio beta is being calculated and shown in the above table based on the
individual betas of both the stocks i.e., LG and Samsung being weighted according to their
different composition in the portfolio.
10 Portfolio Risk
Stock Beta (X) Weights (W)
SD of Stocks 1 2 3 4 5
LG 24.7175 0.5 0.7 0.6 0.3 0.4
Samsung 7.7726 0.5 0.3 0.4 0.7 0.6
1 2 3 4 5
LG 24.7175 12.35875 17.30225 14.8305 7.41525 9.887
Samsung 7.7726 3.8863 2.33178 3.10904 5.44082 4.66356
Portfolio Risk 16.24505 19.63403 17.93954 12.85607 14.5506
The above information depicts the risk associated with both the stocks of LG and
Samsung calculated on the basis of standard deviation being worked out by processing the
returns of both the stocks available for different periods as mentioned earlier.
Stock Return (X) Weights (W)
Average Return of Stocks 1 2 3 4 5
LG -4.2208 0.5 0.7 0.6 0.3 0.4
Samsung -6.3170 0.5 0.3 0.4 0.7 0.6
1 2 3 4 5
LG -4.2208 -2.1104 -2.9546 -2.5325 -1.2662 -1.6883
Samsung -6.3170 -3.1585 -1.8951 -2.5268 -4.4219 -3.7902
Portfolio Return (%) -5.2689 -4.8497 -5.0593 -5.6882 -5.4785
The above table shows the portfolio return containing two stocks i.e., LG and Samsung
both of which will be in the proportion of 50-50, 70-30, 60-40, 30-70 and 40-60 in the portfolio
and thus are weighted accordingly with respect their average returns individually.
9 Portfolio Beta
Stock Beta (X) Weights (W)
Beta of Stocks 1 2 3 4 5
LG 0.057736074 0.5 0.7 0.6 0.3 0.4
Samsung 0.583885397 0.5 0.3 0.4 0.7 0.6
1 2 3 4 5
LG 0.057736074 0.0289 0.0404 0.0346 0.0173 0.0231
Samsung 0.583885397 0.2919 0.1752 0.2336 0.4087 0.3503
Portfolio Beta 0.3208 0.2156 0.2682 0.4260 0.3734
The portfolio beta is being calculated and shown in the above table based on the
individual betas of both the stocks i.e., LG and Samsung being weighted according to their
different composition in the portfolio.
10 Portfolio Risk
Stock Beta (X) Weights (W)
SD of Stocks 1 2 3 4 5
LG 24.7175 0.5 0.7 0.6 0.3 0.4
Samsung 7.7726 0.5 0.3 0.4 0.7 0.6
1 2 3 4 5
LG 24.7175 12.35875 17.30225 14.8305 7.41525 9.887
Samsung 7.7726 3.8863 2.33178 3.10904 5.44082 4.66356
Portfolio Risk 16.24505 19.63403 17.93954 12.85607 14.5506
The above information depicts the risk associated with both the stocks of LG and
Samsung calculated on the basis of standard deviation being worked out by processing the
returns of both the stocks available for different periods as mentioned earlier.
⊘ This is a preview!⊘
Do you want full access?
Subscribe today to unlock all pages.
Trusted by 1+ million students worldwide
1 out of 19
Related Documents


Your All-in-One AI-Powered Toolkit for Academic Success.
+13062052269
info@desklib.com
Available 24*7 on WhatsApp / Email
![[object Object]](/_next/static/media/star-bottom.7253800d.svg)
Unlock your academic potential
Copyright © 2020–2026 A2Z Services. All Rights Reserved. Developed and managed by ZUCOL.