Comprehensive Finance Case Study: Risk, Return, and Financing
VerifiedAdded on 2020/04/01
|8
|1161
|279
Case Study
AI Summary
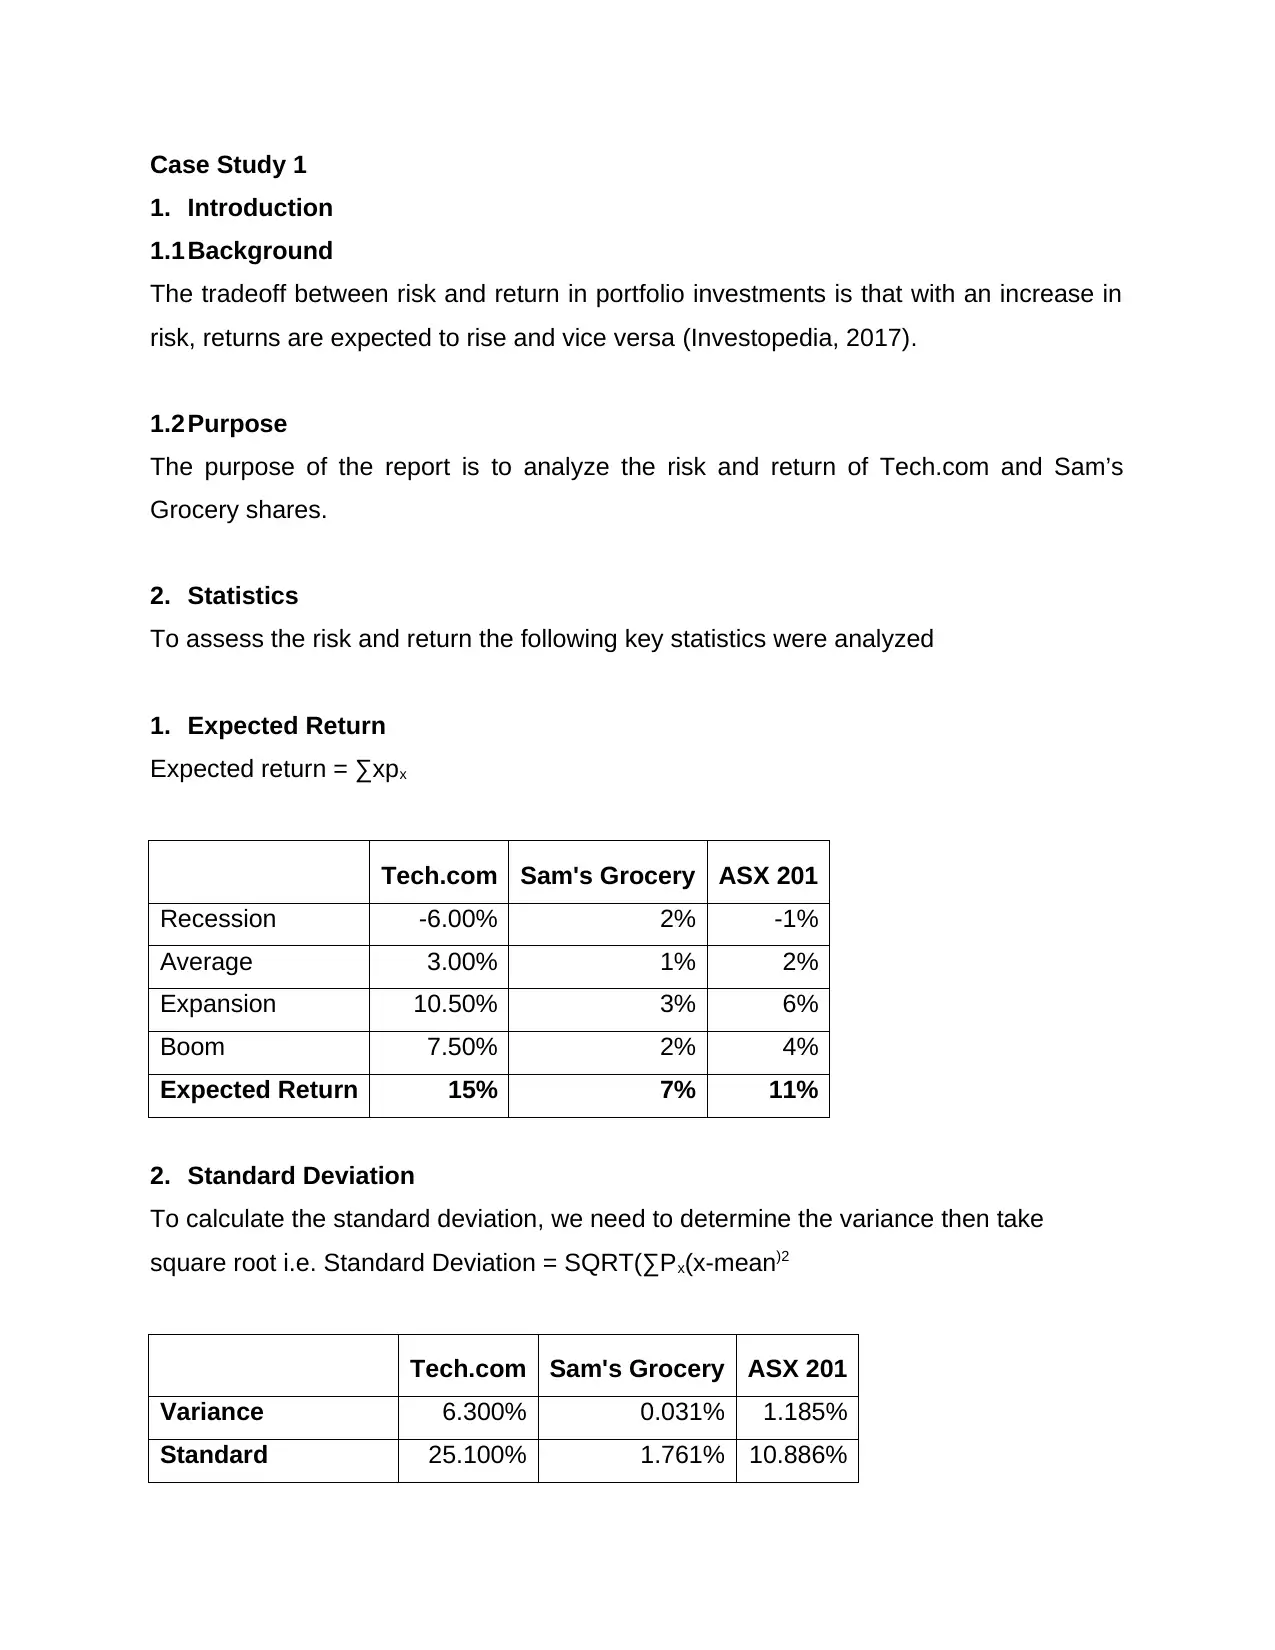
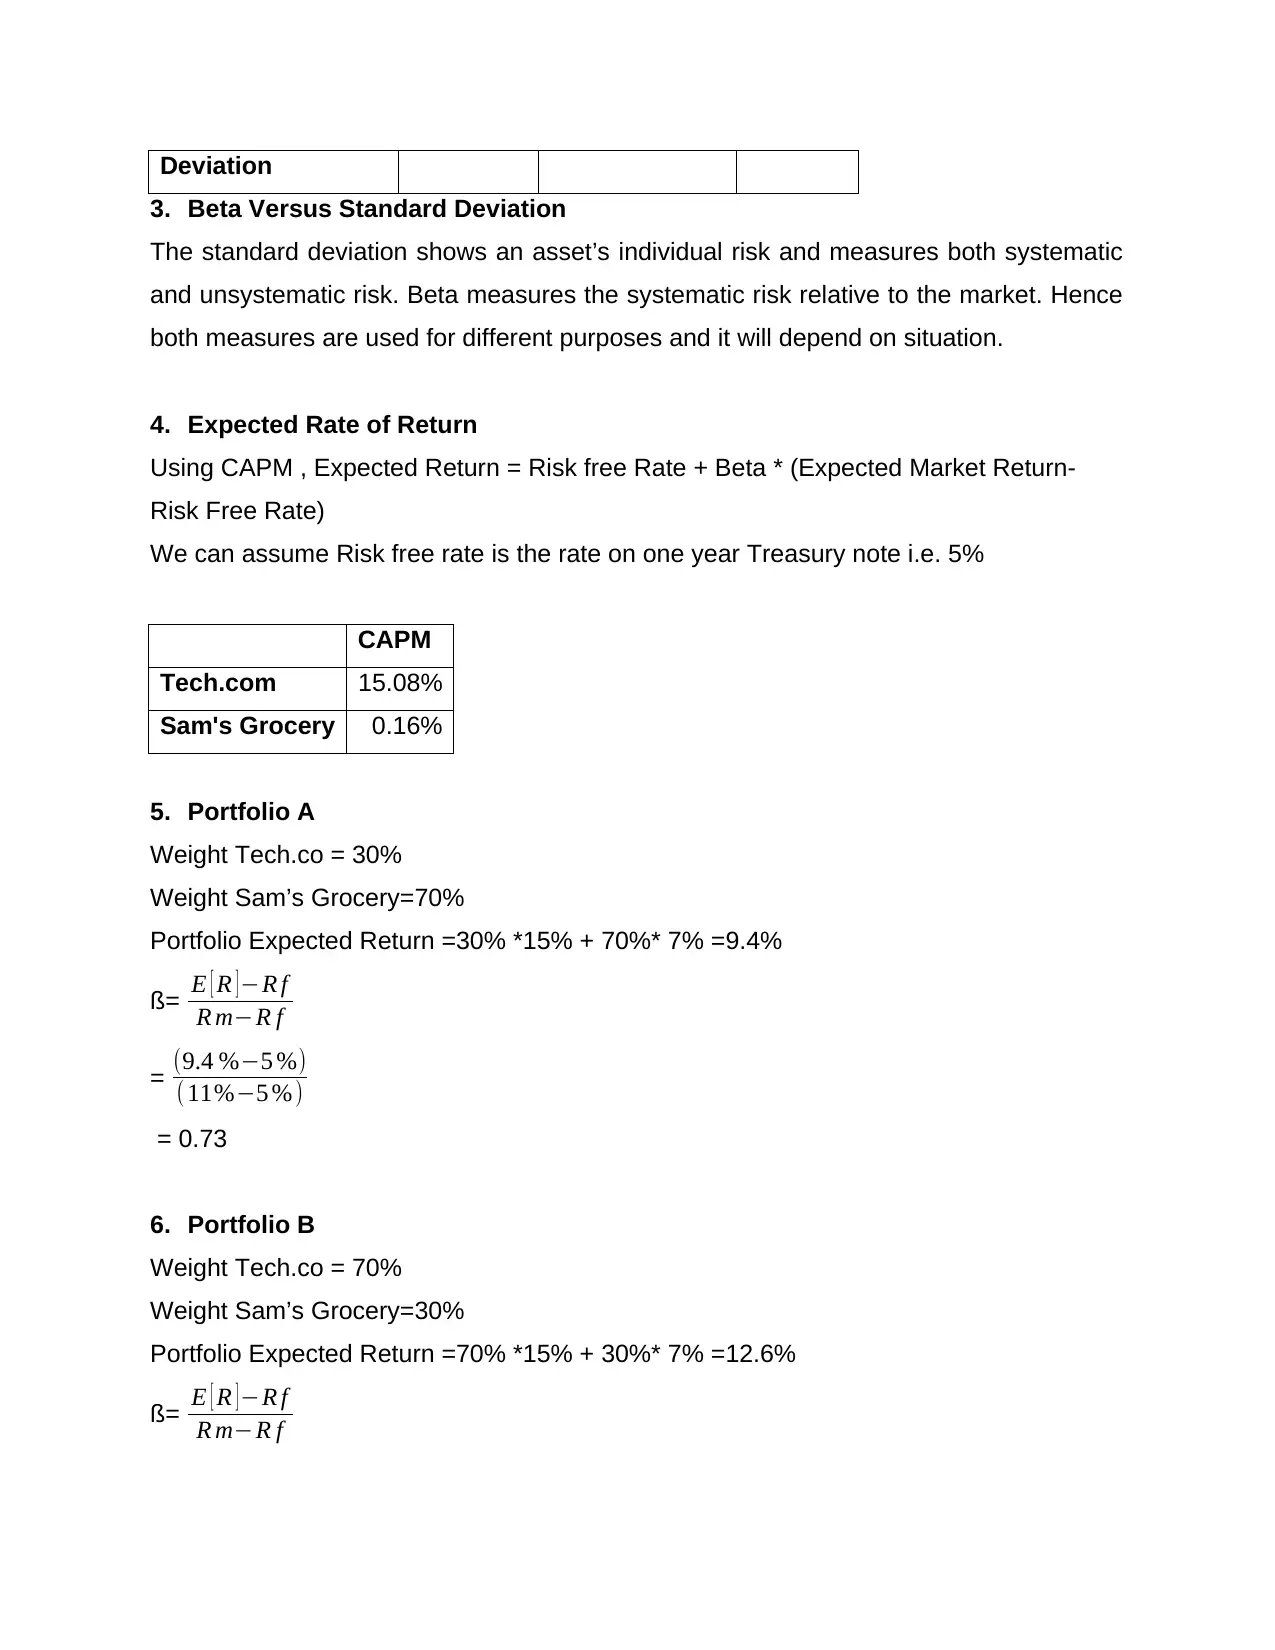
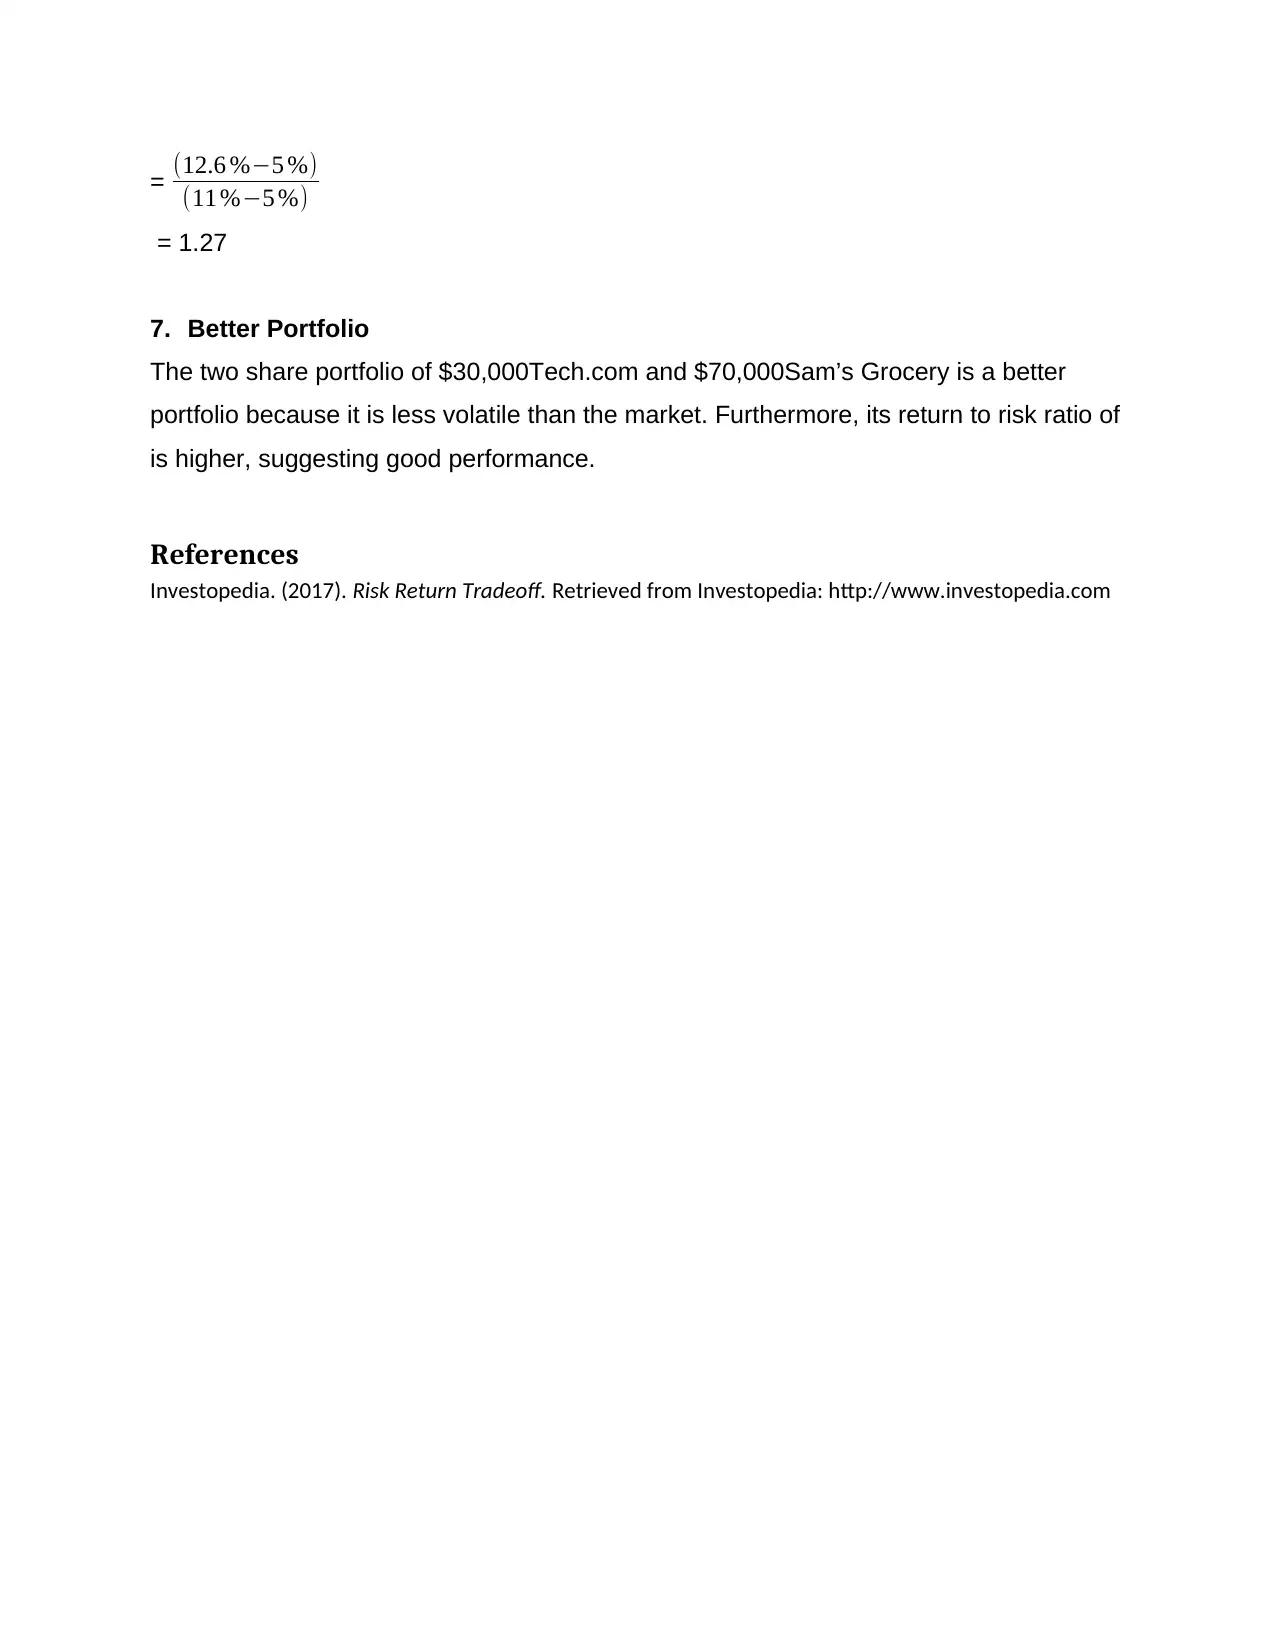
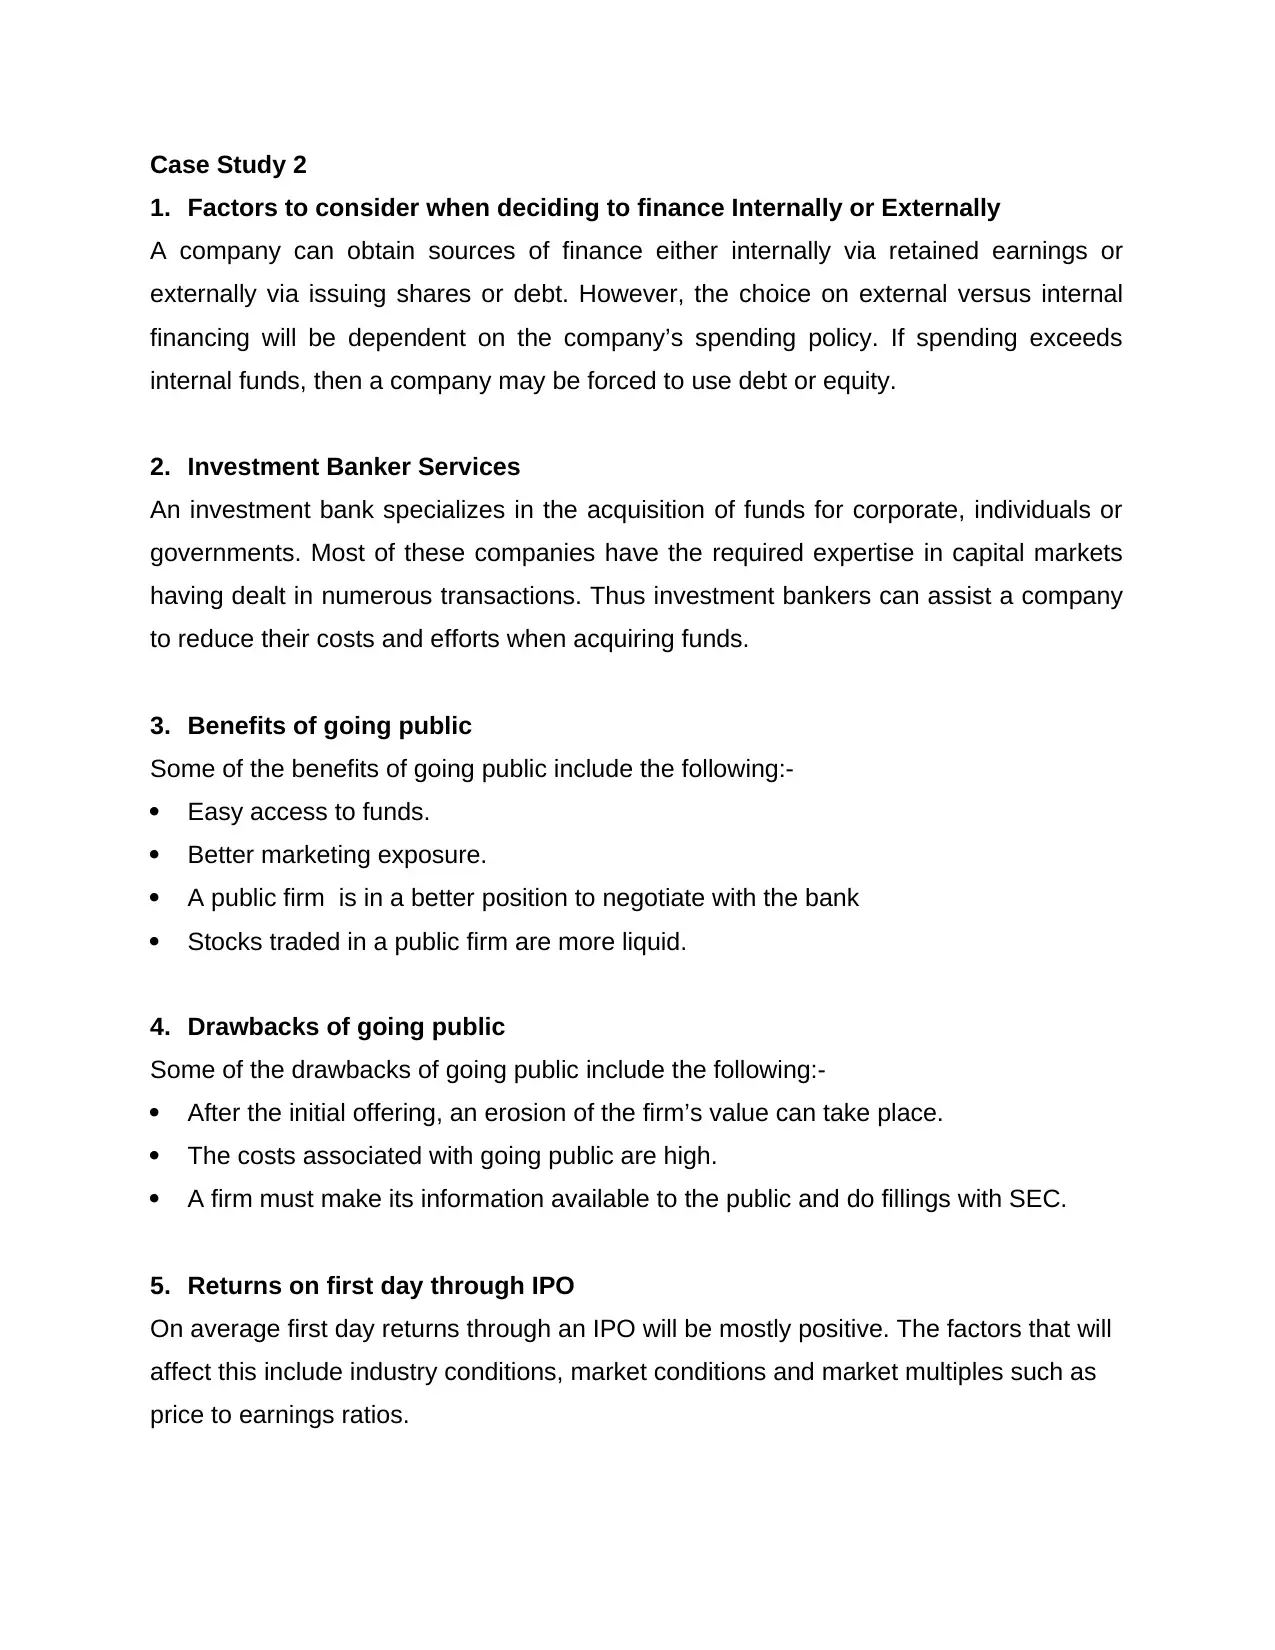
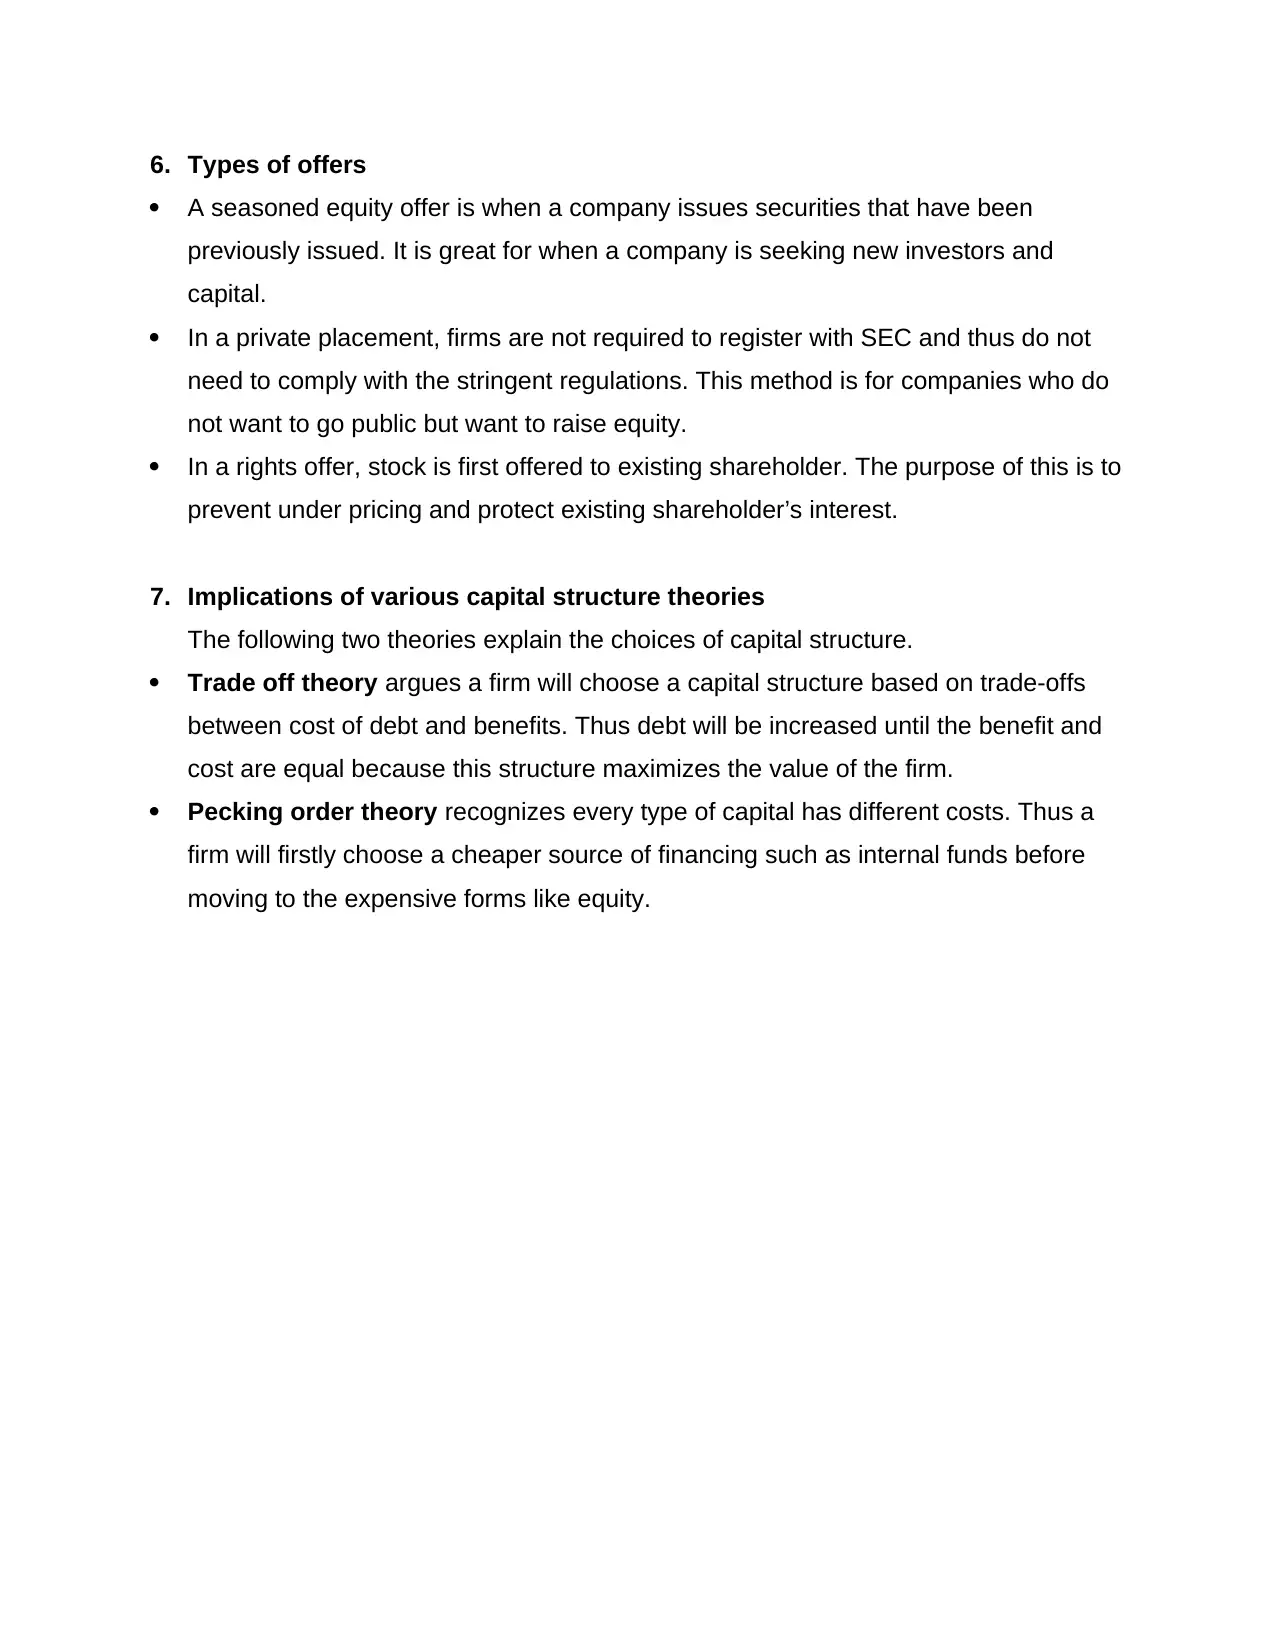
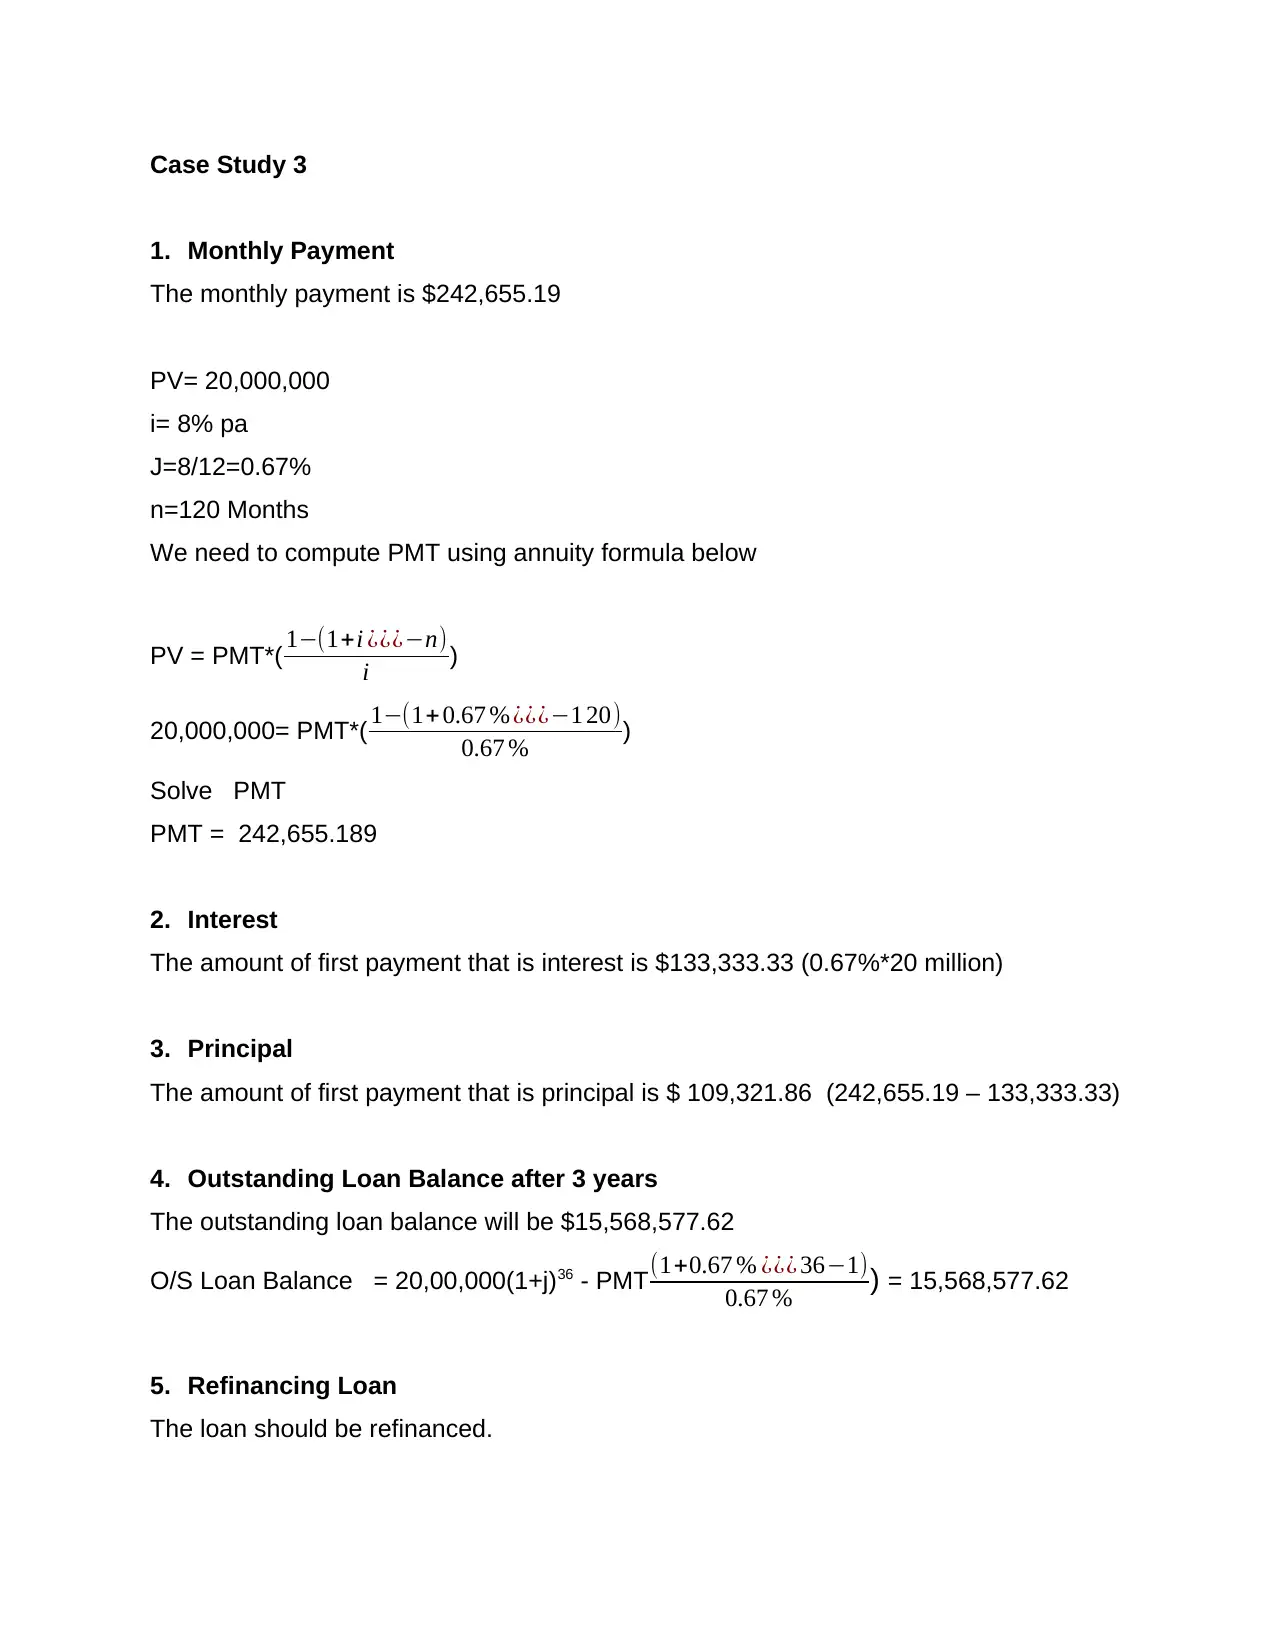
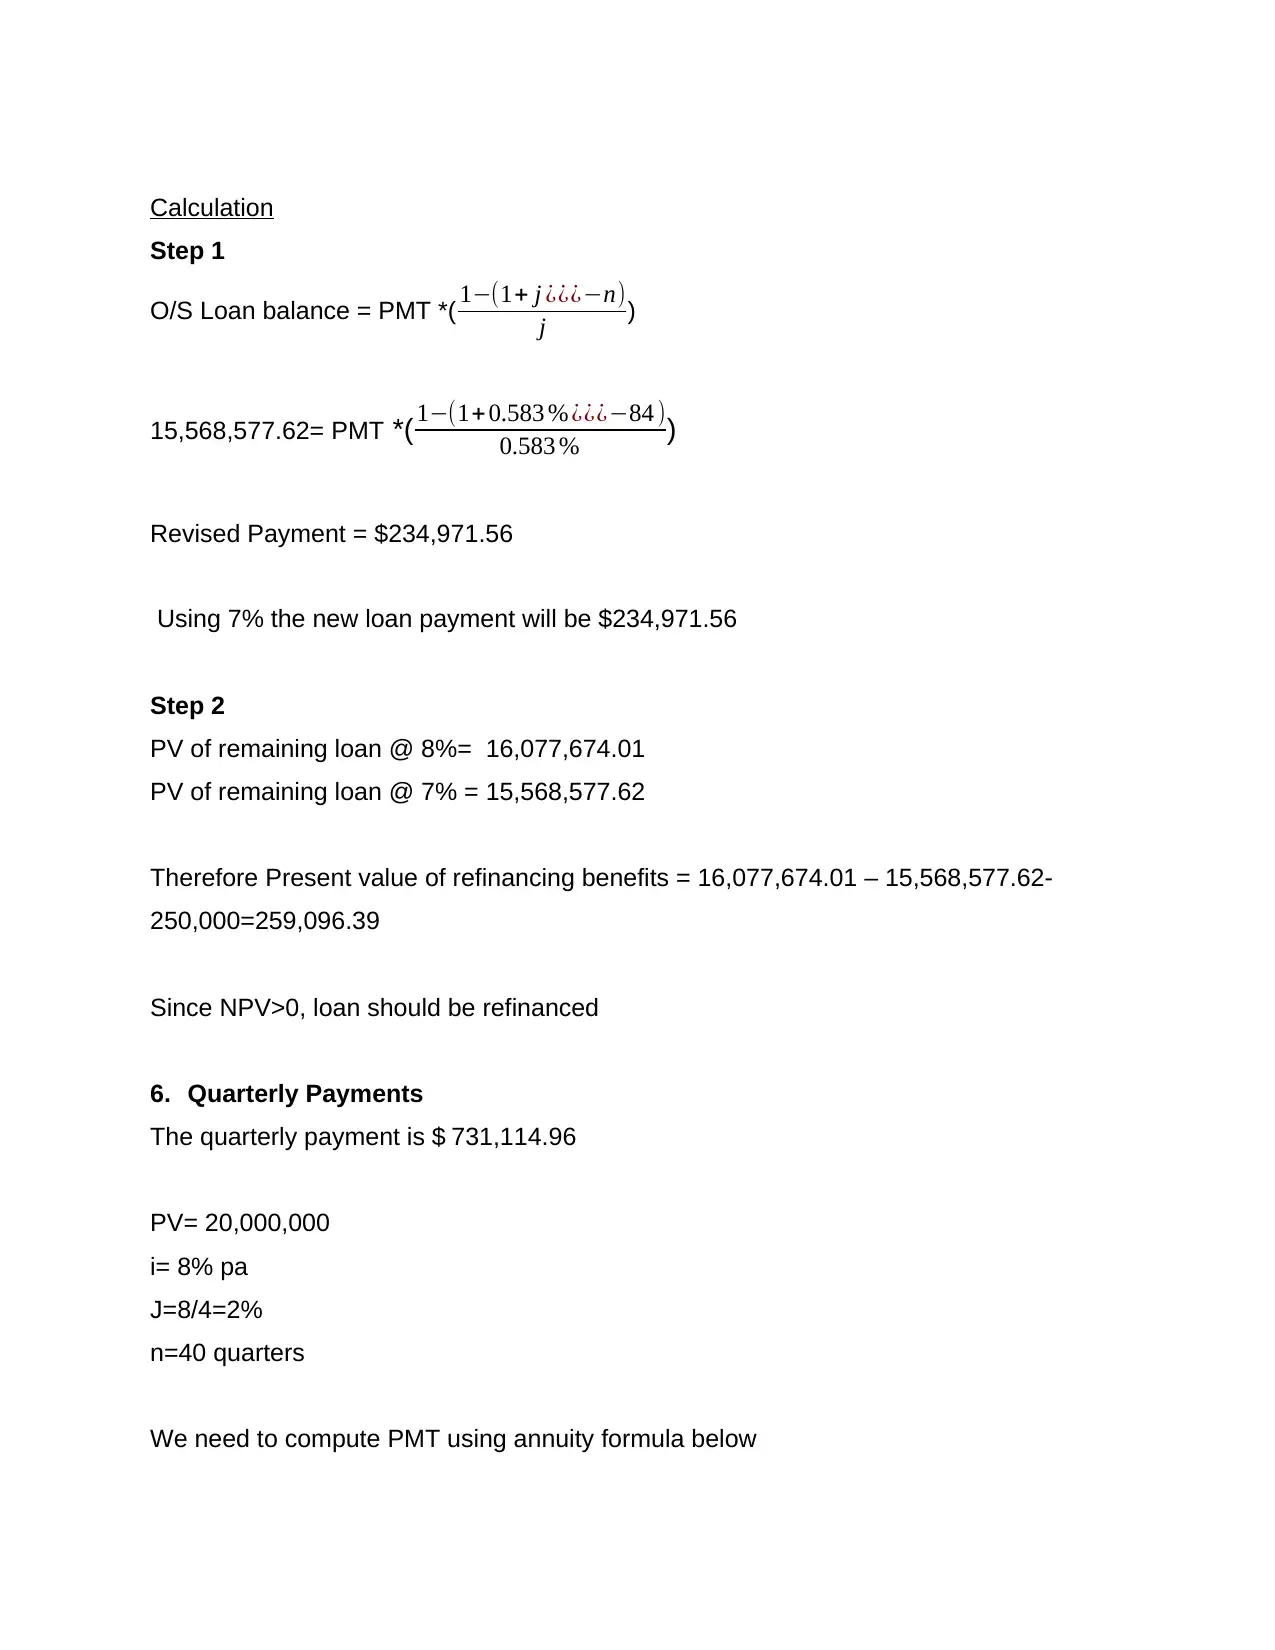
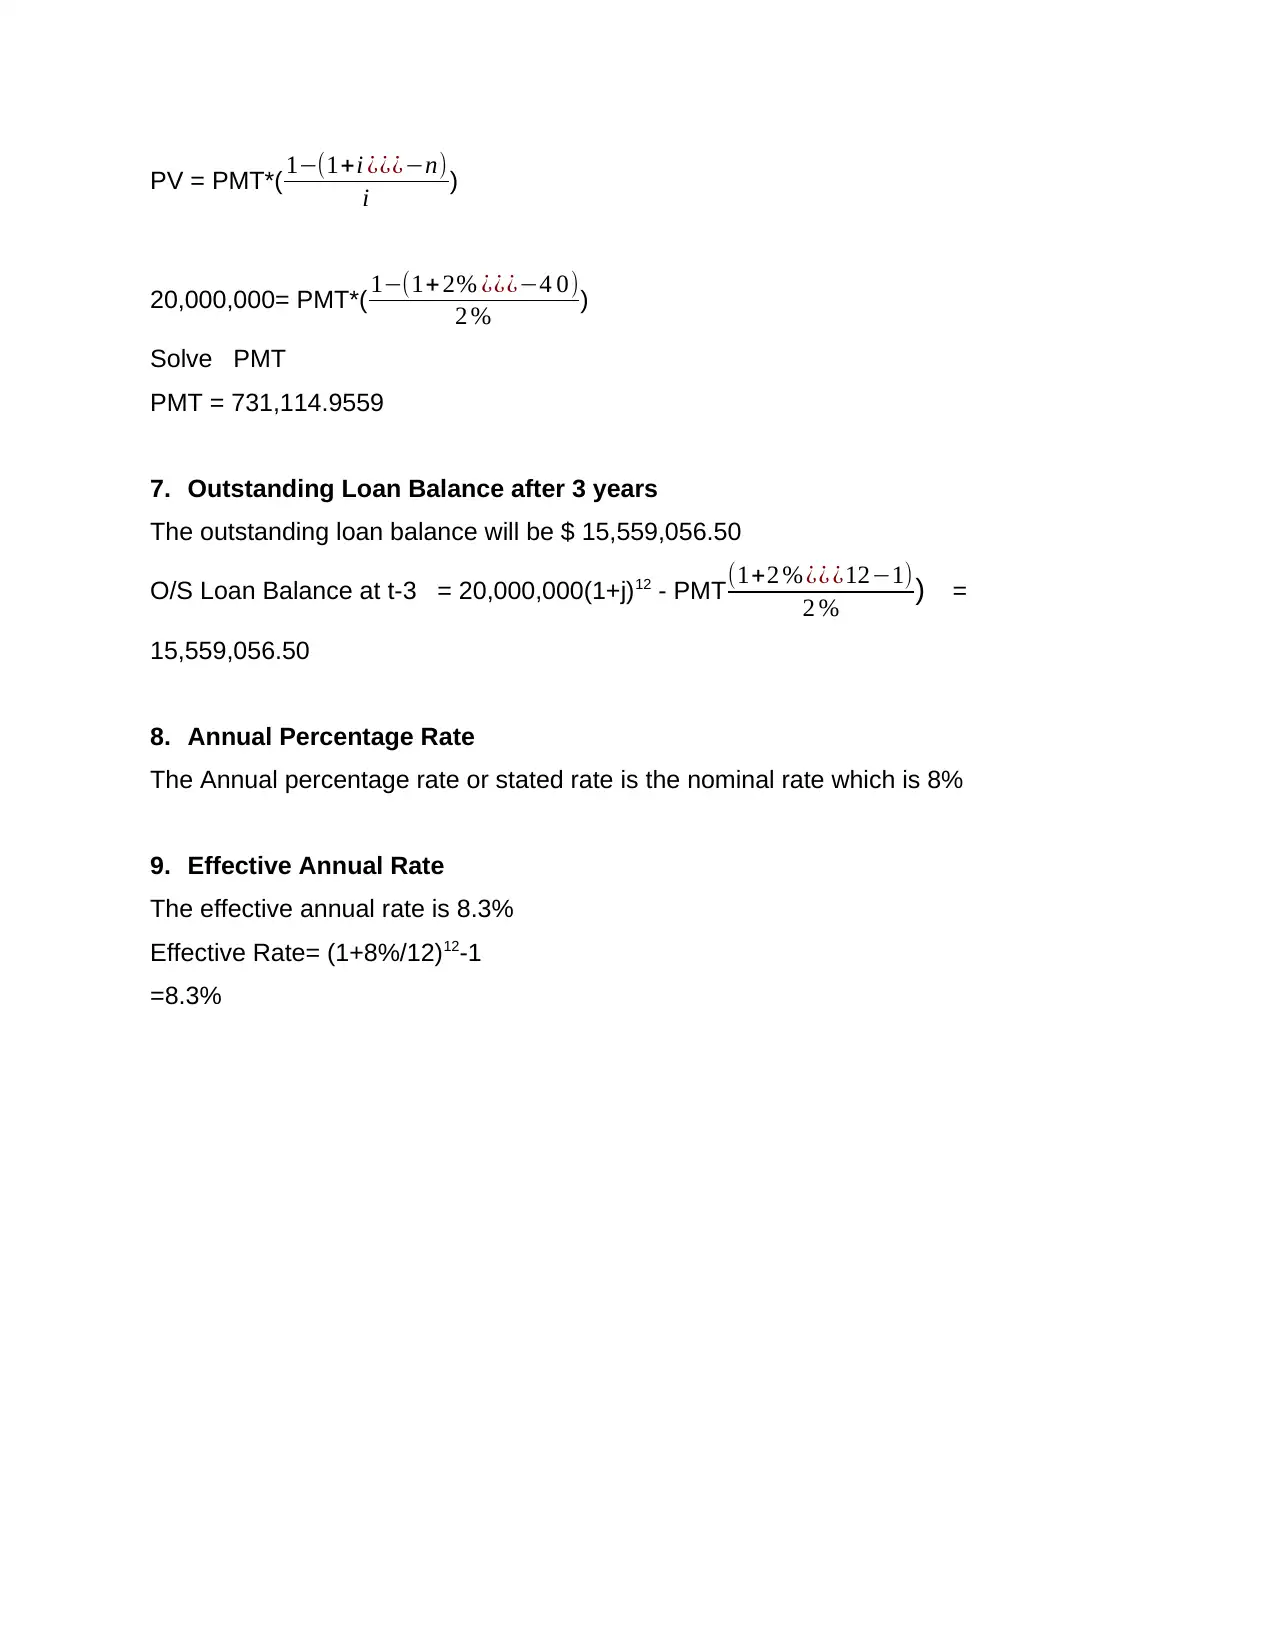
This finance case study examines three distinct scenarios. The first case study analyzes the risk and return of Tech.com and Sam's Grocery shares, calculating expected return, standard deviation, and beta to assess portfolio performance. The second case study explores factors influencing financing decisions, differentiating between internal and external financing, and outlining the benefits and drawbacks of going public, along with an overview of investment banking services. The third case study focuses on loan calculations, determining monthly and quarterly payments, outstanding loan balances, and evaluating the potential benefits of loan refinancing, including a comparison of effective annual rates and the impact of different payment frequencies.

Case Study 1
1. Introduction
1.1 Background
The tradeoff between risk and return in portfolio investments is that with an increase in
risk, returns are expected to rise and vice versa (Investopedia, 2017).
1.2 Purpose
The purpose of the report is to analyze the risk and return of Tech.com and Sam’s
Grocery shares.
2. Statistics
To assess the risk and return the following key statistics were analyzed
1. Expected Return
Expected return = ∑xpx
Tech.com Sam's Grocery ASX 201
Recession -6.00% 2% -1%
Average 3.00% 1% 2%
Expansion 10.50% 3% 6%
Boom 7.50% 2% 4%
Expected Return 15% 7% 11%
2. Standard Deviation
To calculate the standard deviation, we need to determine the variance then take
square root i.e. Standard Deviation = SQRT(∑Px(x-mean)2
Tech.com Sam's Grocery ASX 201
Variance 6.300% 0.031% 1.185%
Standard 25.100% 1.761% 10.886%
Paraphrase This Document
Need a fresh take? Get an instant paraphrase of this document with our AI Paraphraser

Deviation
3. Beta Versus Standard Deviation
The standard deviation shows an asset’s individual risk and measures both systematic
and unsystematic risk. Beta measures the systematic risk relative to the market. Hence
both measures are used for different purposes and it will depend on situation.
4. Expected Rate of Return
Using CAPM , Expected Return = Risk free Rate + Beta * (Expected Market Return-
Risk Free Rate)
We can assume Risk free rate is the rate on one year Treasury note i.e. 5%
CAPM
Tech.com 15.08%
Sam's Grocery 0.16%
5. Portfolio A
Weight Tech.co = 30%
Weight Sam’s Grocery=70%
Portfolio Expected Return =30% *15% + 70%* 7% =9.4%
ß= E [ R ] −R f
R m−R f
= (9.4 %−5 %)
(11%−5 %)
= 0.73
6. Portfolio B
Weight Tech.co = 70%
Weight Sam’s Grocery=30%
Portfolio Expected Return =70% *15% + 30%* 7% =12.6%
ß= E [ R ] −R f
R m−R f

= (12.6 %−5 %)
(11 %−5 %)
= 1.27
7. Better Portfolio
The two share portfolio of $30,000Tech.com and $70,000Sam’s Grocery is a better
portfolio because it is less volatile than the market. Furthermore, its return to risk ratio of
is higher, suggesting good performance.
References
Investopedia. (2017). Risk Return Tradeoff. Retrieved from Investopedia: http://www.investopedia.com
⊘ This is a preview!⊘
Do you want full access?
Subscribe today to unlock all pages.

Trusted by 1+ million students worldwide

Case Study 2
1. Factors to consider when deciding to finance Internally or Externally
A company can obtain sources of finance either internally via retained earnings or
externally via issuing shares or debt. However, the choice on external versus internal
financing will be dependent on the company’s spending policy. If spending exceeds
internal funds, then a company may be forced to use debt or equity.
2. Investment Banker Services
An investment bank specializes in the acquisition of funds for corporate, individuals or
governments. Most of these companies have the required expertise in capital markets
having dealt in numerous transactions. Thus investment bankers can assist a company
to reduce their costs and efforts when acquiring funds.
3. Benefits of going public
Some of the benefits of going public include the following:-
Easy access to funds.
Better marketing exposure.
A public firm is in a better position to negotiate with the bank
Stocks traded in a public firm are more liquid.
4. Drawbacks of going public
Some of the drawbacks of going public include the following:-
After the initial offering, an erosion of the firm’s value can take place.
The costs associated with going public are high.
A firm must make its information available to the public and do fillings with SEC.
5. Returns on first day through IPO
On average first day returns through an IPO will be mostly positive. The factors that will
affect this include industry conditions, market conditions and market multiples such as
price to earnings ratios.
Paraphrase This Document
Need a fresh take? Get an instant paraphrase of this document with our AI Paraphraser

6. Types of offers
A seasoned equity offer is when a company issues securities that have been
previously issued. It is great for when a company is seeking new investors and
capital.
In a private placement, firms are not required to register with SEC and thus do not
need to comply with the stringent regulations. This method is for companies who do
not want to go public but want to raise equity.
In a rights offer, stock is first offered to existing shareholder. The purpose of this is to
prevent under pricing and protect existing shareholder’s interest.
7. Implications of various capital structure theories
The following two theories explain the choices of capital structure.
Trade off theory argues a firm will choose a capital structure based on trade-offs
between cost of debt and benefits. Thus debt will be increased until the benefit and
cost are equal because this structure maximizes the value of the firm.
Pecking order theory recognizes every type of capital has different costs. Thus a
firm will firstly choose a cheaper source of financing such as internal funds before
moving to the expensive forms like equity.

Case Study 3
1. Monthly Payment
The monthly payment is $242,655.19
PV= 20,000,000
i= 8% pa
J=8/12=0.67%
n=120 Months
We need to compute PMT using annuity formula below
PV = PMT*( 1−(1+i ¿¿¿−n)
i )
20,000,000= PMT*( 1−(1+0.67 % ¿¿¿−1 20)
0.67 % )
Solve PMT
PMT = 242,655.189
2. Interest
The amount of first payment that is interest is $133,333.33 (0.67%*20 million)
3. Principal
The amount of first payment that is principal is $ 109,321.86 (242,655.19 – 133,333.33)
4. Outstanding Loan Balance after 3 years
The outstanding loan balance will be $15,568,577.62
O/S Loan Balance = 20,00,000(1+j)36 - PMT(1+0.67 % ¿¿¿ 36−1)
0.67 % ) = 15,568,577.62
5. Refinancing Loan
The loan should be refinanced.
⊘ This is a preview!⊘
Do you want full access?
Subscribe today to unlock all pages.

Trusted by 1+ million students worldwide

Calculation
Step 1
O/S Loan balance = PMT *( 1−(1+ j ¿¿¿−n)
j )
15,568,577.62= PMT *( 1−(1+ 0.583 % ¿¿¿−84 )
0.583 % )
Revised Payment = $234,971.56
Using 7% the new loan payment will be $234,971.56
Step 2
PV of remaining loan @ 8%= 16,077,674.01
PV of remaining loan @ 7% = 15,568,577.62
Therefore Present value of refinancing benefits = 16,077,674.01 – 15,568,577.62-
250,000=259,096.39
Since NPV>0, loan should be refinanced
6. Quarterly Payments
The quarterly payment is $ 731,114.96
PV= 20,000,000
i= 8% pa
J=8/4=2%
n=40 quarters
We need to compute PMT using annuity formula below
Paraphrase This Document
Need a fresh take? Get an instant paraphrase of this document with our AI Paraphraser

PV = PMT*( 1−(1+i ¿¿¿−n)
i )
20,000,000= PMT*( 1−(1+2% ¿¿¿−4 0)
2 % )
Solve PMT
PMT = 731,114.9559
7. Outstanding Loan Balance after 3 years
The outstanding loan balance will be $ 15,559,056.50
O/S Loan Balance at t-3 = 20,000,000(1+j)12 - PMT(1+2 %¿¿ ¿12−1)
2 % ) =
15,559,056.50
8. Annual Percentage Rate
The Annual percentage rate or stated rate is the nominal rate which is 8%
9. Effective Annual Rate
The effective annual rate is 8.3%
Effective Rate= (1+8%/12)12-1
=8.3%
1 out of 8
Related Documents

Your All-in-One AI-Powered Toolkit for Academic Success.
+13062052269
info@desklib.com
Available 24*7 on WhatsApp / Email
Unlock your academic potential
Copyright © 2020–2025 A2Z Services. All Rights Reserved. Developed and managed by ZUCOL.