Finance Homework: Project Evaluation and Portfolio Analysis

Verified

Added on  2022/10/11

|4
|442
|76
Homework Assignment
AI Summary
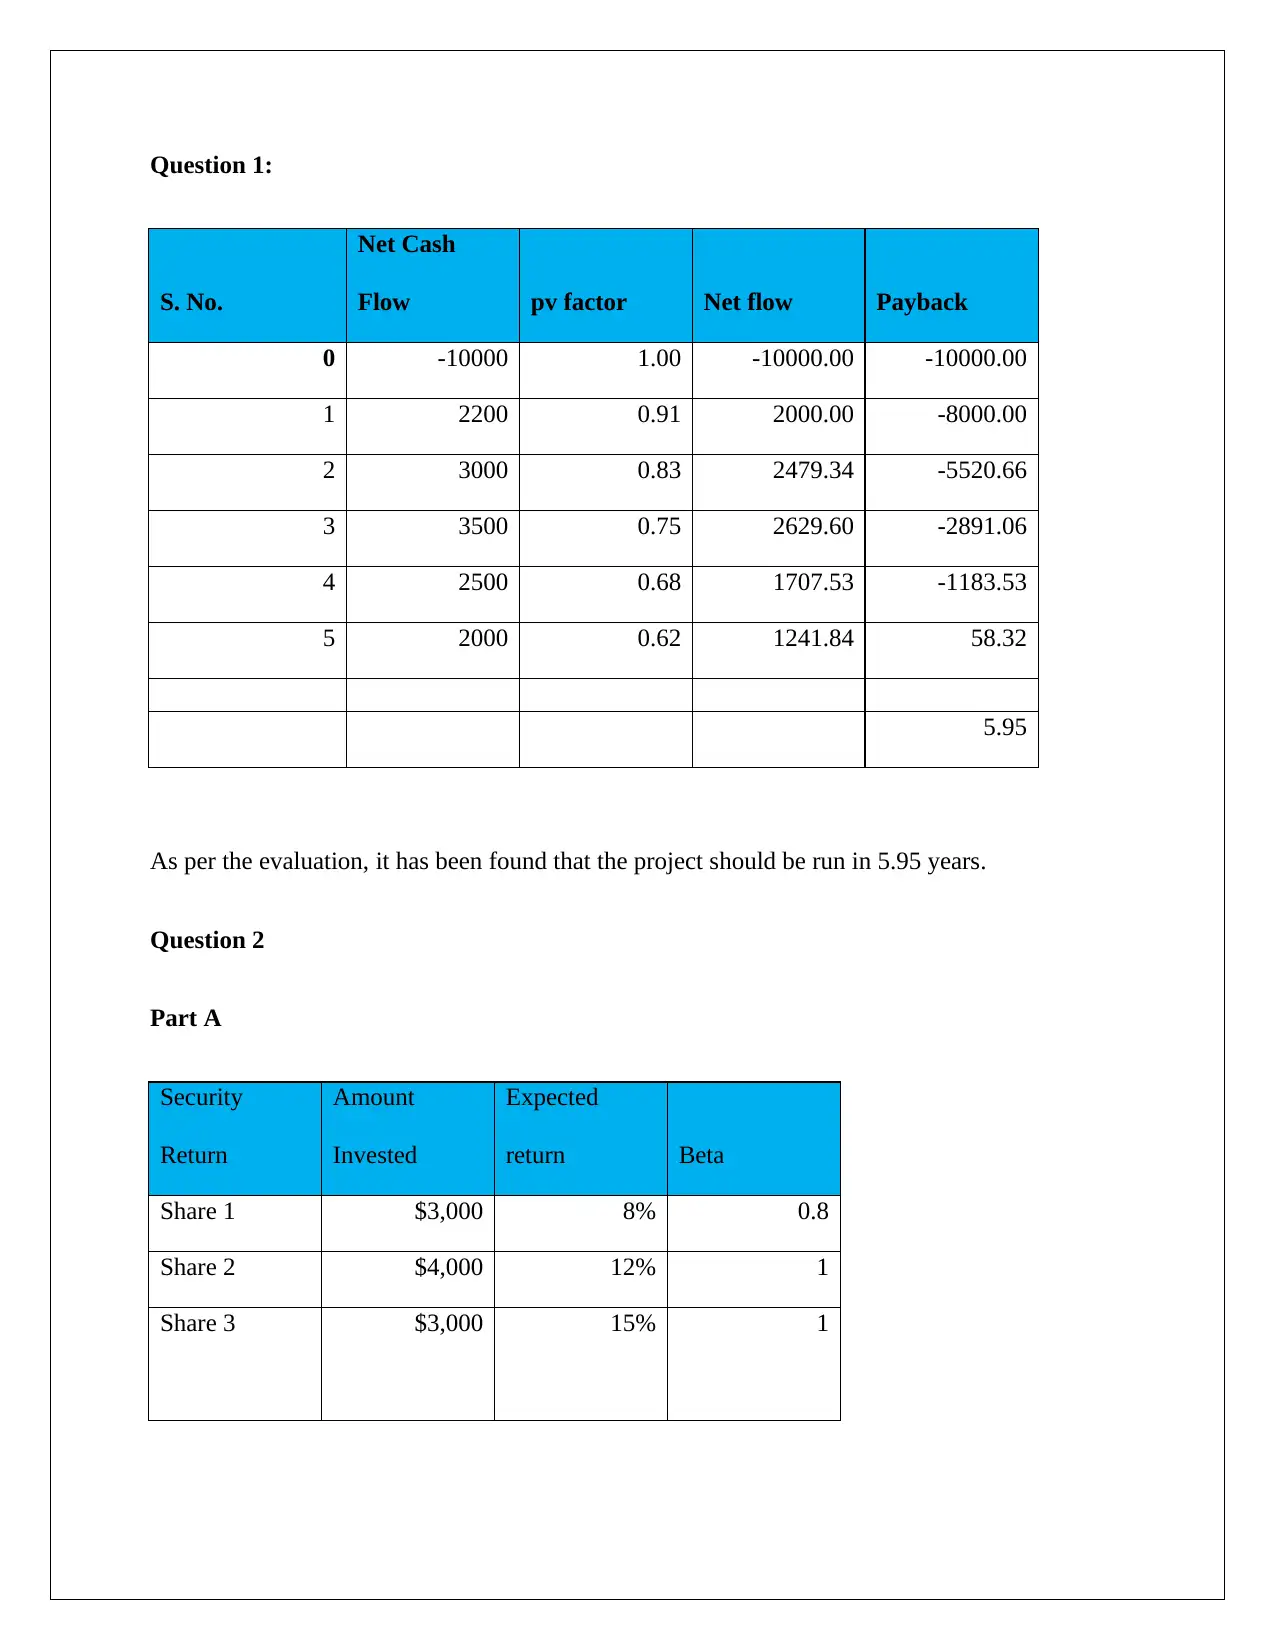
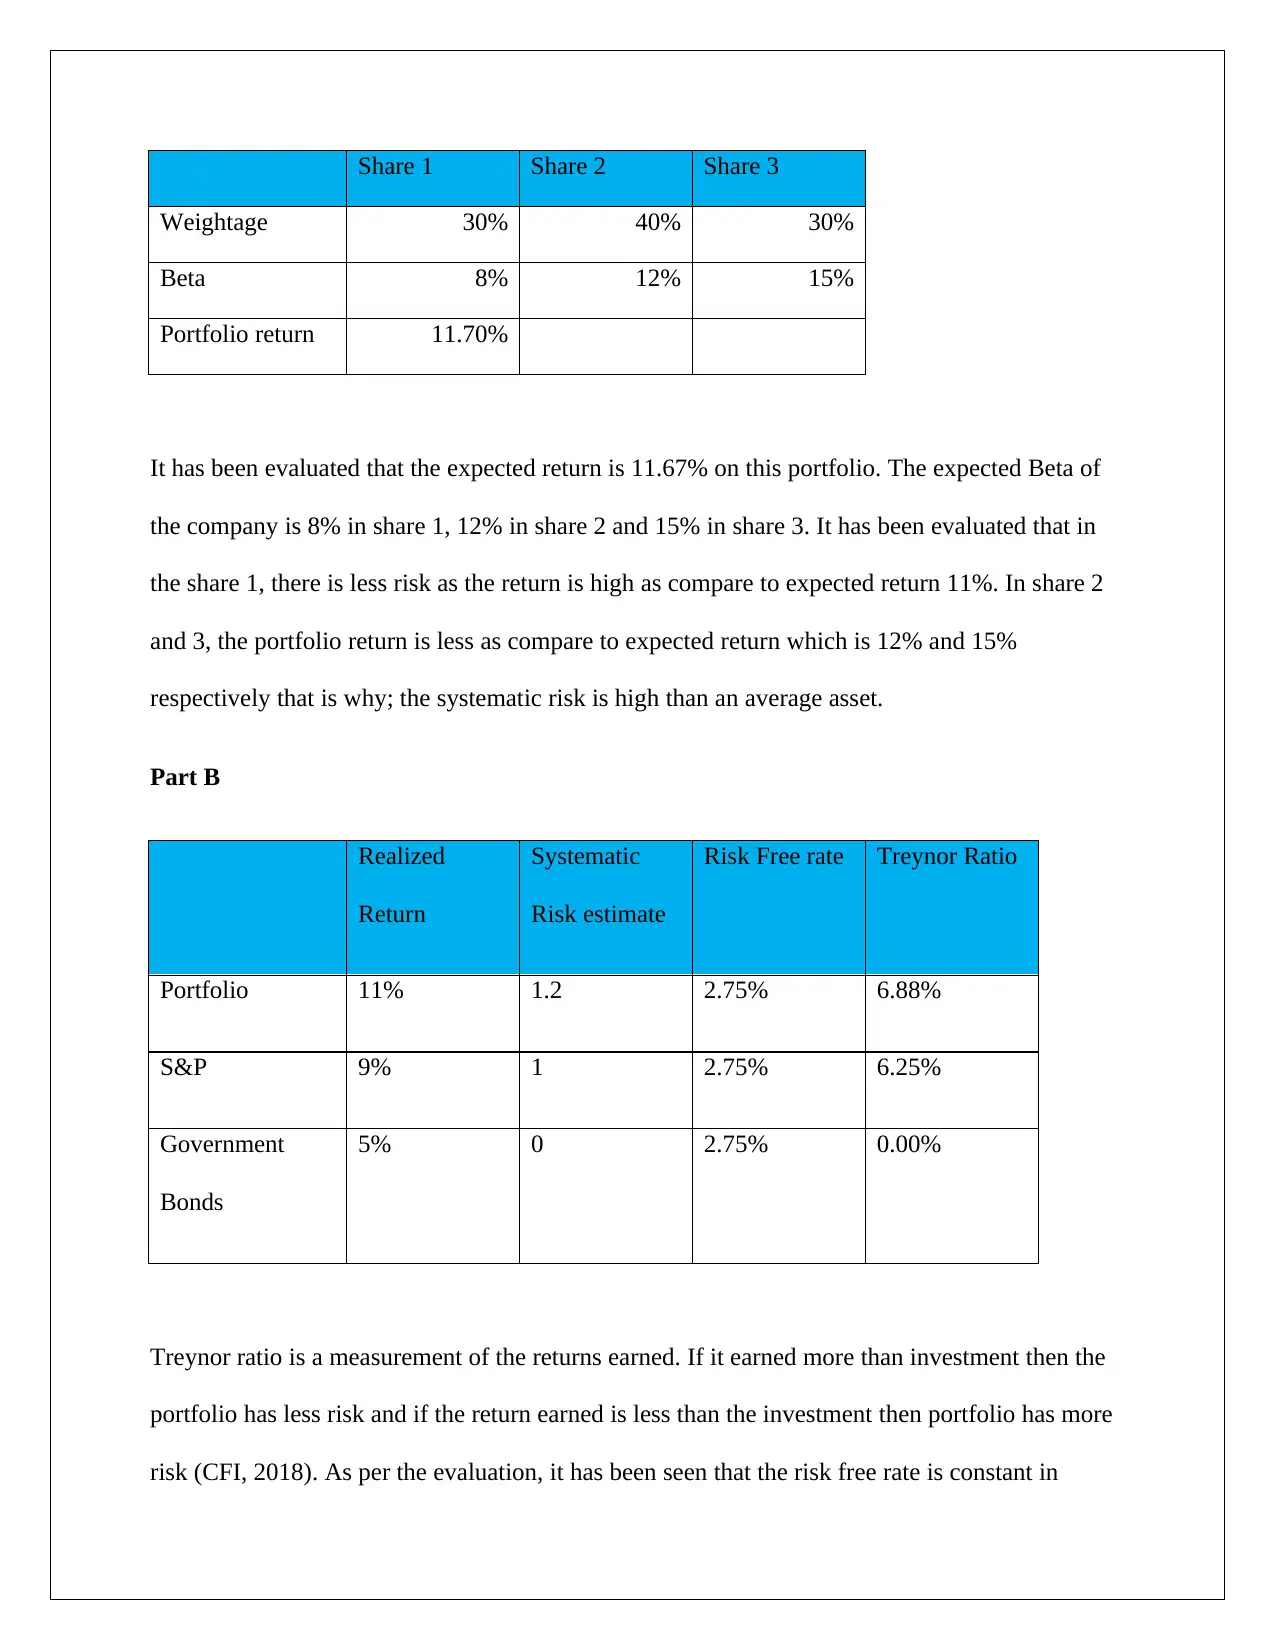
This document presents a detailed solution to a finance homework assignment, encompassing two key questions. The first question focuses on project evaluation, calculating the payback period using net cash flow and present value factors. The analysis determines the project's viability based on a 5.95-year payback period. The second question delves into portfolio analysis, examining the returns and risks associated with a diversified portfolio. Part A calculates the expected return of the portfolio, considering the amount invested, expected return, and beta for each security. Part B assesses the portfolio's performance using the Treynor ratio, comparing the realized return, systematic risk, and risk-free rate to evaluate risk-adjusted returns against market benchmarks like S&P and government bonds. The solution provides insights into the risk and return characteristics of the portfolio, demonstrating how to evaluate investment performance.
tabler-icon-diamond-filled.svg

Contribute Materials

Your contribution can guide someone’s learning journey. Share your documents today.
Document Page
Question 1:
S. No.
Net Cash
Flow pv factor Net flow Payback
0 -10000 1.00 -10000.00 -10000.00
1 2200 0.91 2000.00 -8000.00
2 3000 0.83 2479.34 -5520.66
3 3500 0.75 2629.60 -2891.06
4 2500 0.68 1707.53 -1183.53
5 2000 0.62 1241.84 58.32
5.95
As per the evaluation, it has been found that the project should be run in 5.95 years.
Question 2
Part A
Security
Return
Amount
Invested
Expected
return Beta
Share 1 $3,000 8% 0.8
Share 2 $4,000 12% 1
Share 3 $3,000 15% 1
tabler-icon-diamond-filled.svg

Secure Best Marks with AI Grader

Need help grading? Try our AI Grader for instant feedback on your assignments.
Document Page
Share 1 Share 2 Share 3
Weightage 30% 40% 30%
Beta 8% 12% 15%
Portfolio return 11.70%
It has been evaluated that the expected return is 11.67% on this portfolio. The expected Beta of
the company is 8% in share 1, 12% in share 2 and 15% in share 3. It has been evaluated that in
the share 1, there is less risk as the return is high as compare to expected return 11%. In share 2
and 3, the portfolio return is less as compare to expected return which is 12% and 15%
respectively that is why; the systematic risk is high than an average asset.
Part B
Realized
Return
Systematic
Risk estimate
Risk Free rate Treynor Ratio
Portfolio 11% 1.2 2.75% 6.88%
S&P 9% 1 2.75% 6.25%
Government
Bonds
5% 0 2.75% 0.00%
Treynor ratio is a measurement of the returns earned. If it earned more than investment then the
portfolio has less risk and if the return earned is less than the investment then portfolio has more
risk (CFI, 2018). As per the evaluation, it has been seen that the risk free rate is constant in
Document Page
portfolio, S&P, and government bonds with the percentage of 2.75%. It has been seen that
Treynor ratio is 6.88% in portfolio and same in S&P but 0 in government bonds which reflects
that the market benchmark is outperformed as per the market average (Amadeo, 2019).
Document Page
References
Amadeo, K. (2019) Five Ways to Outperform the Market. Which One Is Safe?. [online]
Available from: https://www.thebalance.com/outperform-the-market-3305874 [Accessed
4/08/19].
CFI. (2018) What is the Treynor Ratio?. [online] Available
from:https://corporatefinanceinstitute.com/resources/knowledge/finance/treynor-ratio/ [Accessed
4/08/19].
chevron_up_icon
1 out of 4
circle_padding
hide_on_mobile
zoom_out_icon
logo.png

Your All-in-One AI-Powered Toolkit for Academic Success.

Available 24*7 on WhatsApp / Email

[object Object]