BAO2001 Corporate Finance Assignment: Risk, Return, and Portfolio

Verified

Added on  2023/06/11

|8
|1231
|311
Report
AI Summary
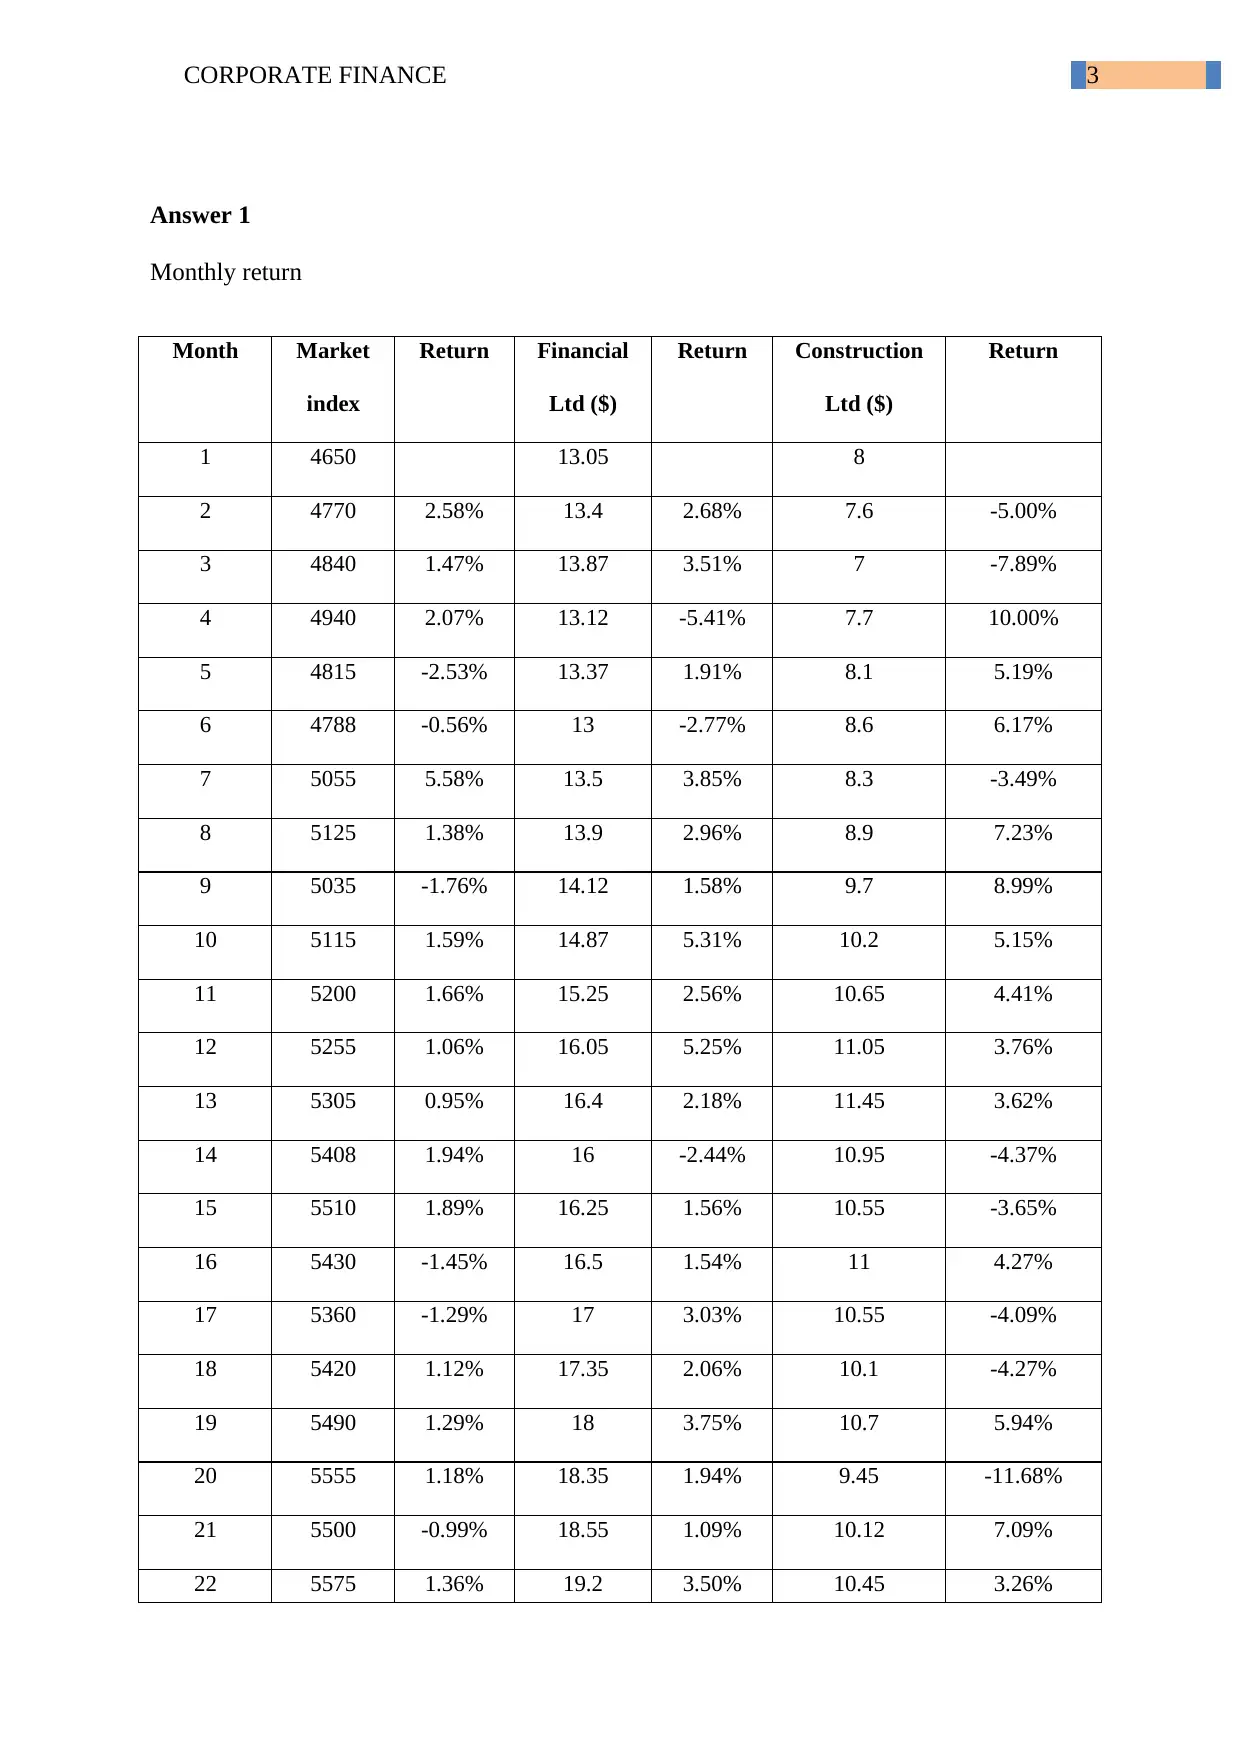
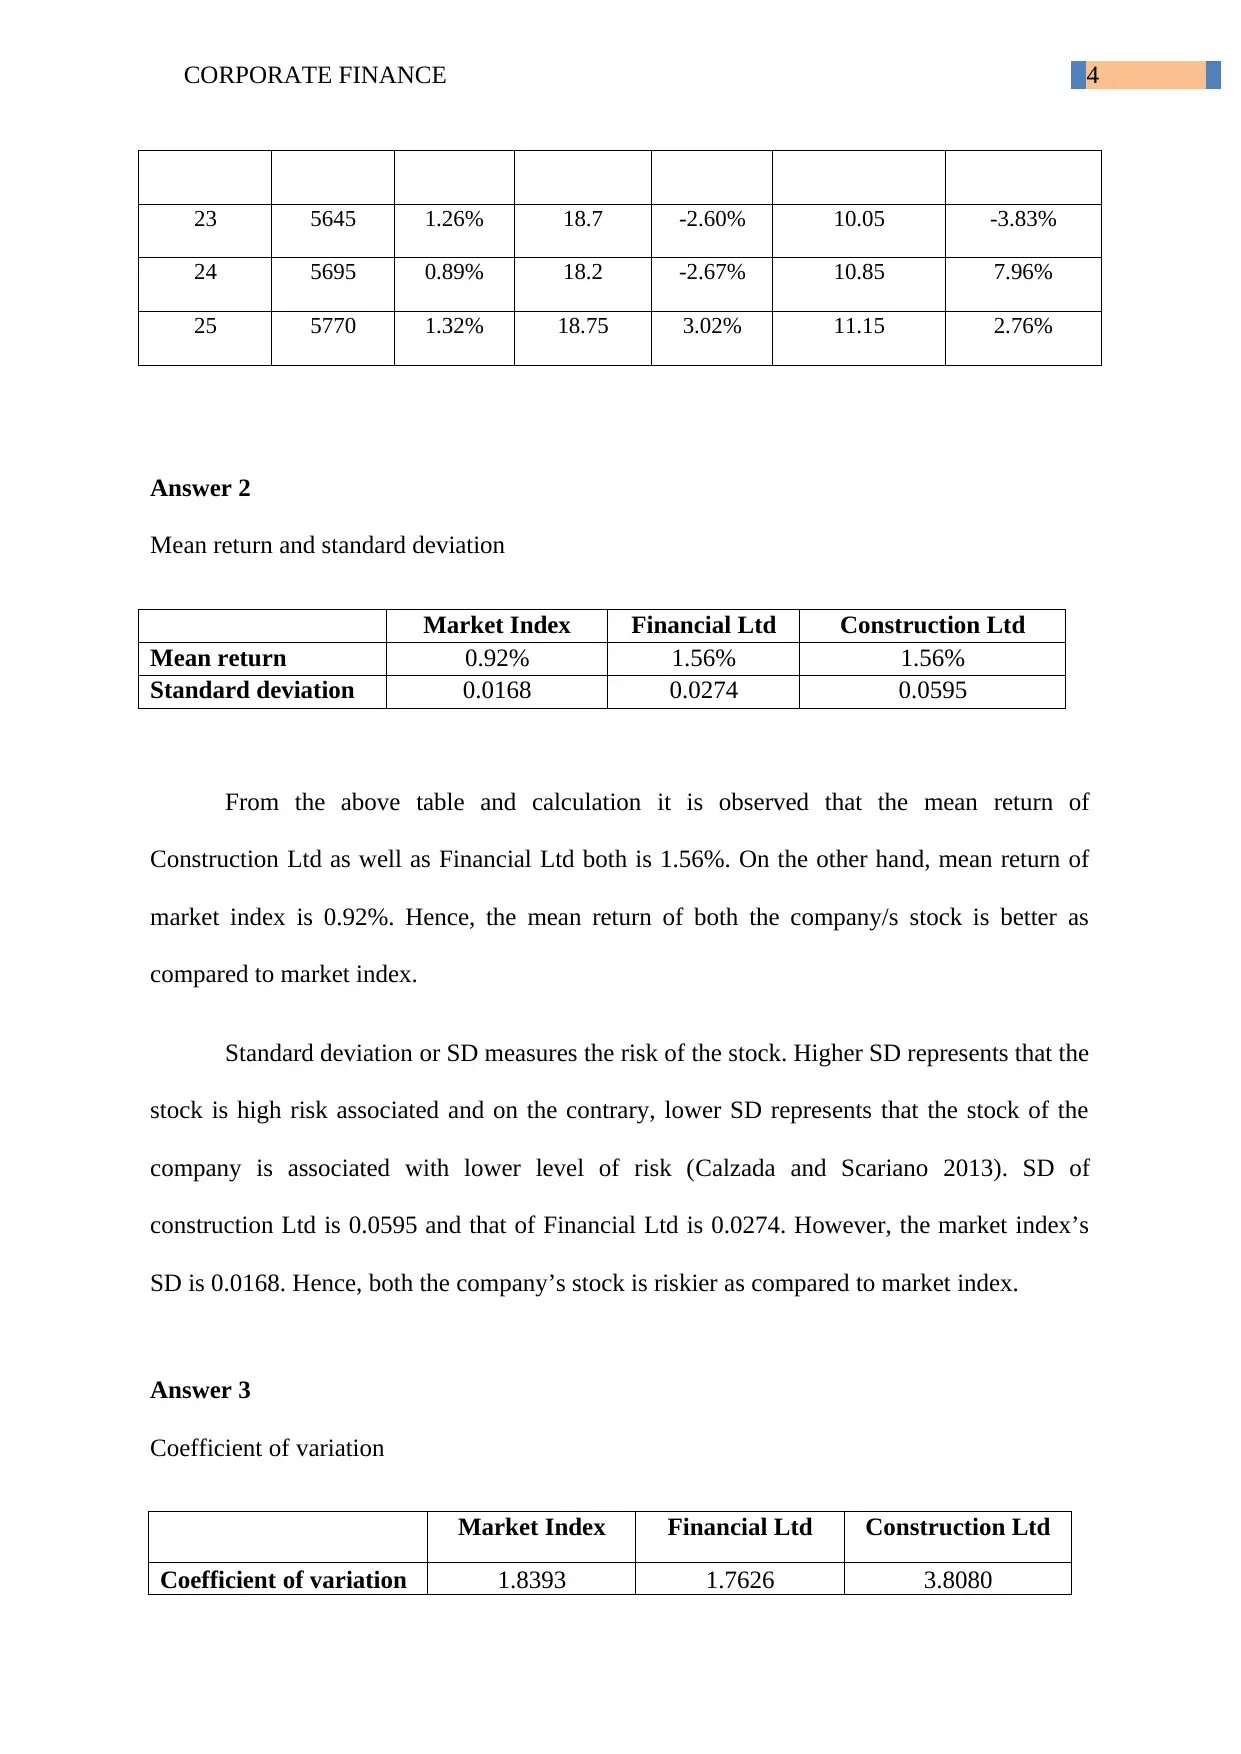
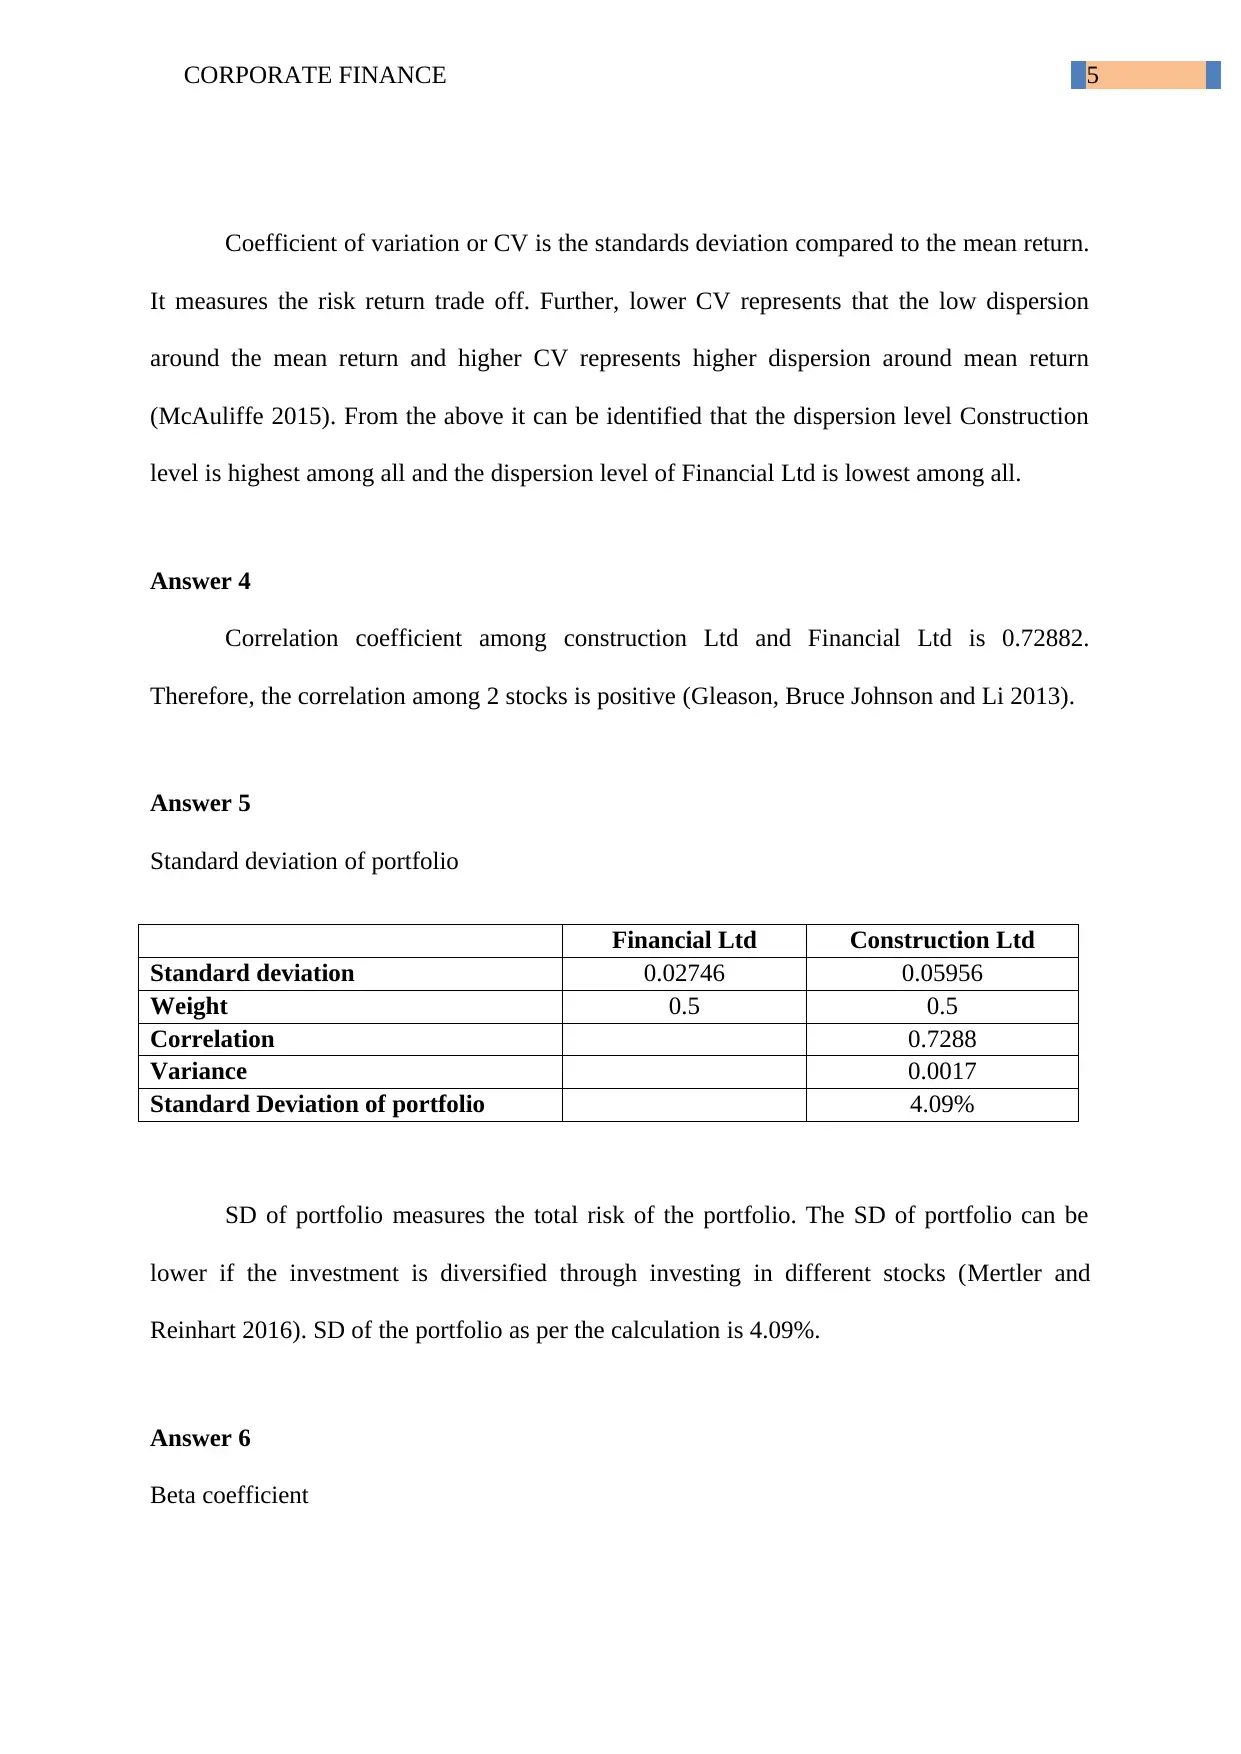
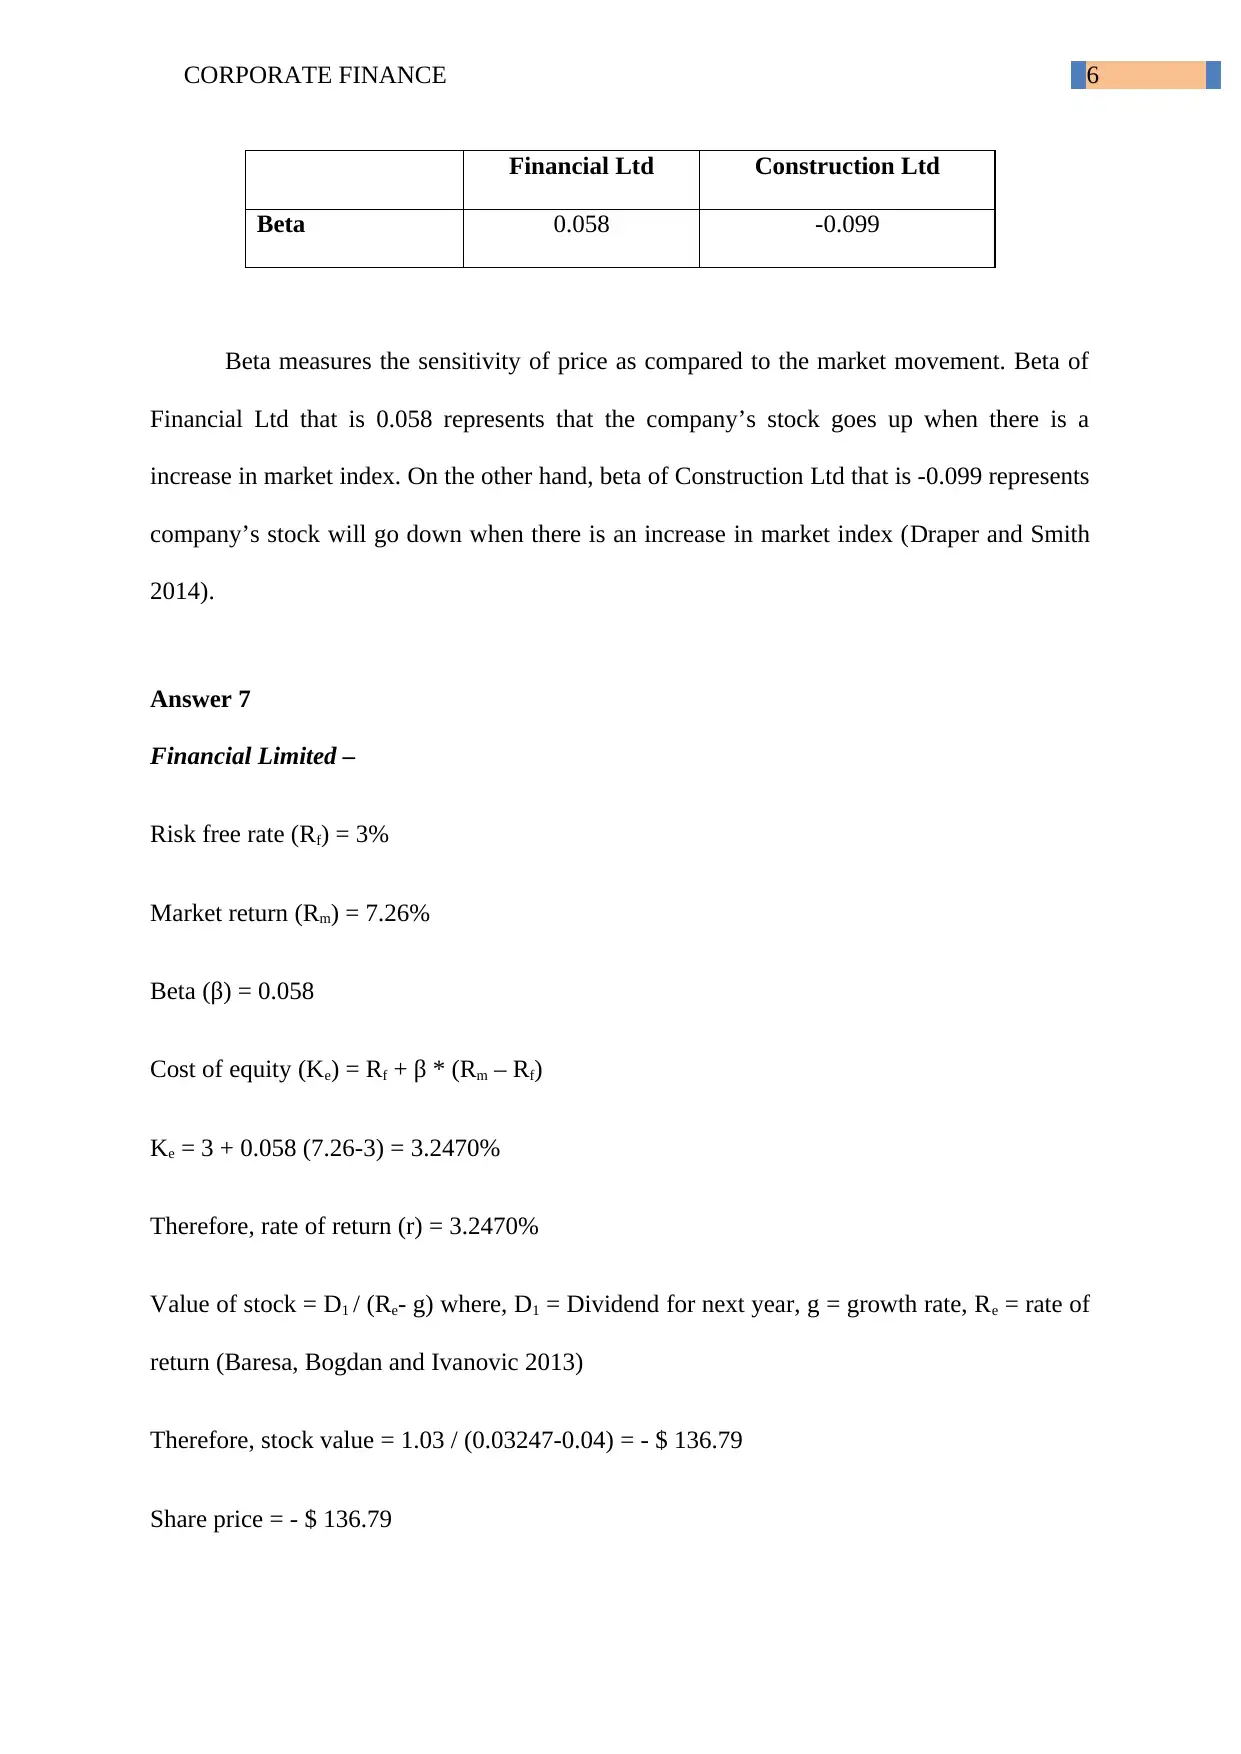
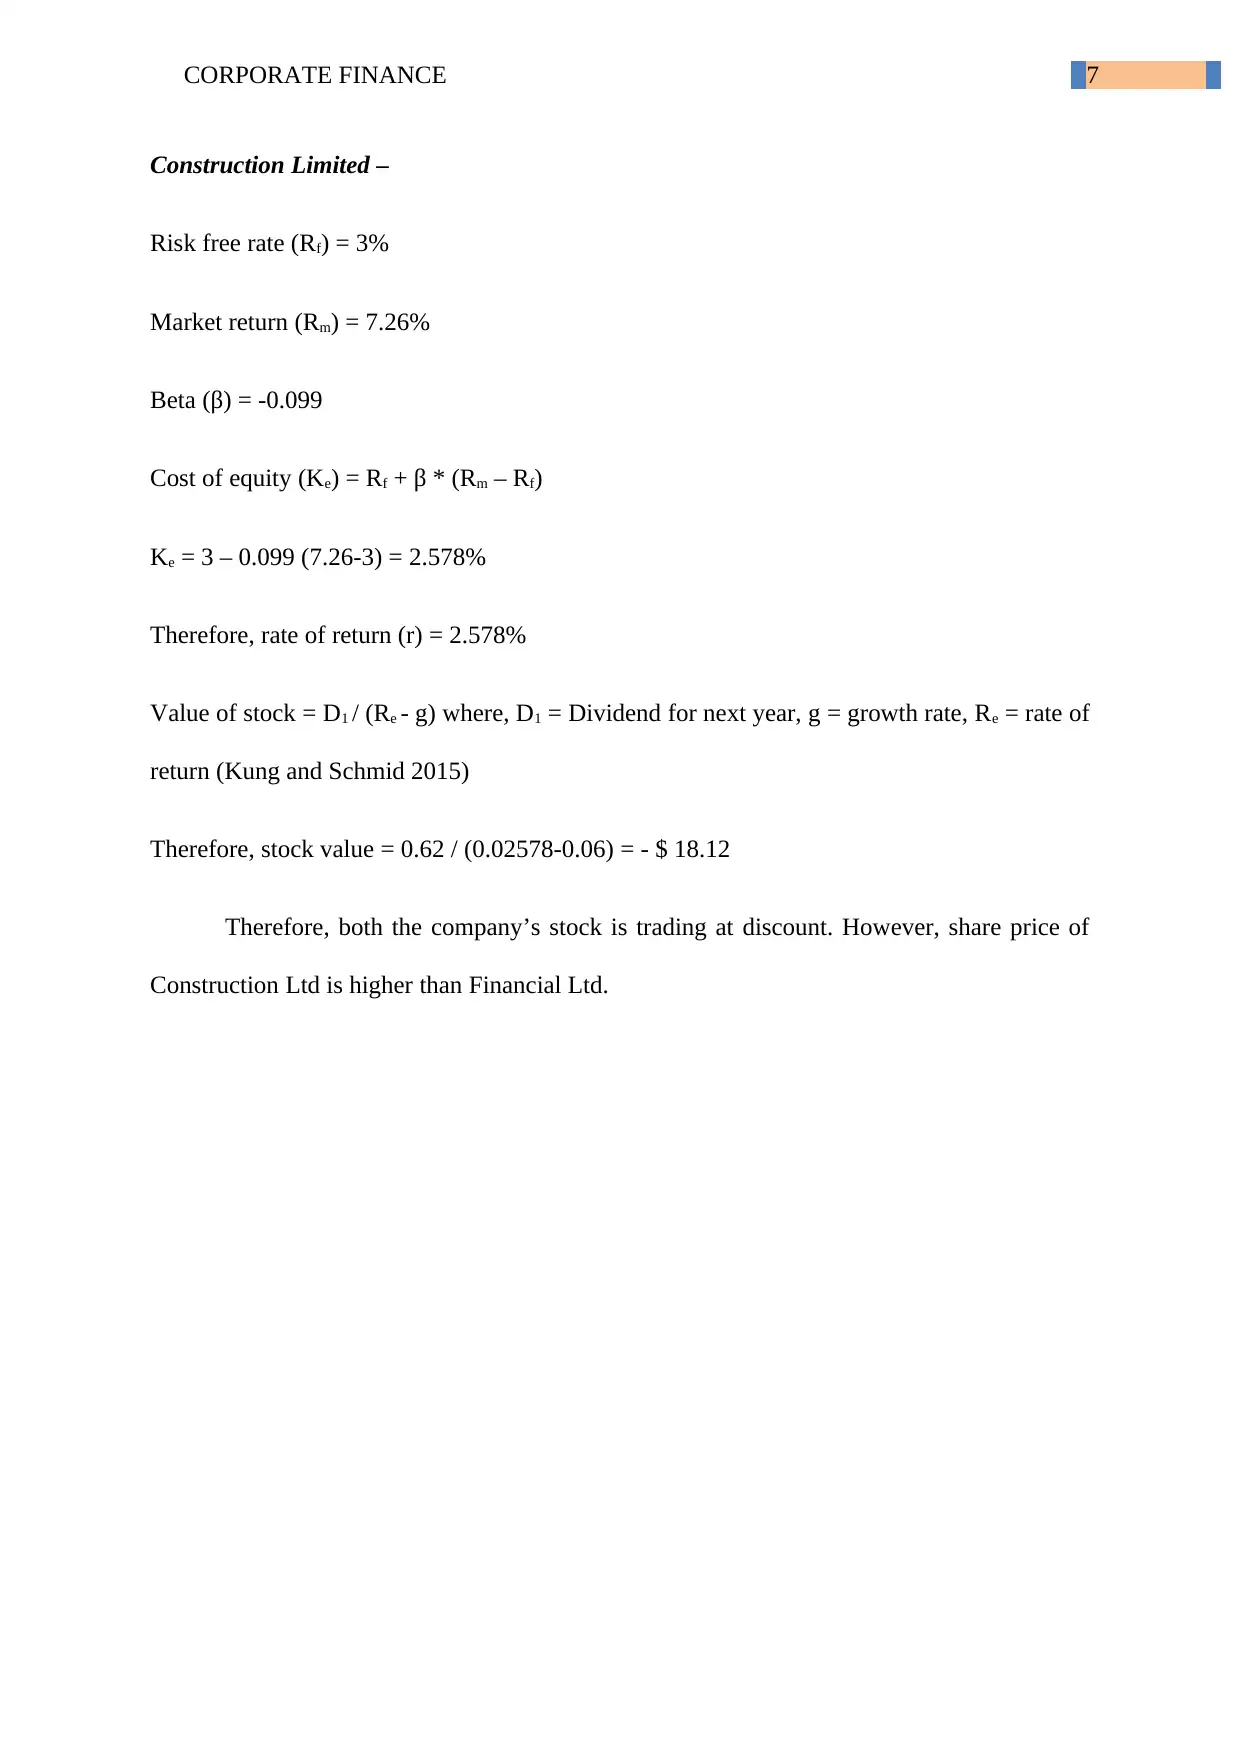
This report provides a comprehensive analysis of risk and return for Financial Ltd and Construction Ltd, utilizing monthly return data to calculate key financial metrics. The analysis includes calculations of mean return, standard deviation, and coefficient of variation for both companies and the market index, revealing that while both companies have higher mean returns than the market index, they also carry greater risk. The report further examines the correlation coefficient between the two companies' stocks, the standard deviation of a portfolio composed of these stocks, and their beta coefficients, indicating the sensitivity of each stock to market movements. Finally, the report estimates the value of each company's stock using the cost of equity and dividend discount model, concluding that both stocks are currently trading at a discount. Desklib offers a variety of resources, including similar solved assignments and past papers, to aid students in their studies.
tabler-icon-diamond-filled.svg

Contribute Materials

Your contribution can guide someone’s learning journey. Share your documents today.
Document Page
Running head: CORPORATE FINANCE
Corporate finance
Name of the student
Name of the university
Student ID
Author note
tabler-icon-diamond-filled.svg

Secure Best Marks with AI Grader

Need help grading? Try our AI Grader for instant feedback on your assignments.
Document Page
2CORPORATE FINANCE
Contents
Answer 1....................................................................................................................................3
Answer 2....................................................................................................................................4
Answer 3....................................................................................................................................4
Answer 4....................................................................................................................................5
Answer 5....................................................................................................................................5
Answer 6....................................................................................................................................5
Answer 7....................................................................................................................................6
Reference....................................................................................................................................8
Document Page
3CORPORATE FINANCE
Answer 1
Monthly return
Month Market
index
Return Financial
Ltd ($)
Return Construction
Ltd ($)
Return
1 4650 13.05 8
2 4770 2.58% 13.4 2.68% 7.6 -5.00%
3 4840 1.47% 13.87 3.51% 7 -7.89%
4 4940 2.07% 13.12 -5.41% 7.7 10.00%
5 4815 -2.53% 13.37 1.91% 8.1 5.19%
6 4788 -0.56% 13 -2.77% 8.6 6.17%
7 5055 5.58% 13.5 3.85% 8.3 -3.49%
8 5125 1.38% 13.9 2.96% 8.9 7.23%
9 5035 -1.76% 14.12 1.58% 9.7 8.99%
10 5115 1.59% 14.87 5.31% 10.2 5.15%
11 5200 1.66% 15.25 2.56% 10.65 4.41%
12 5255 1.06% 16.05 5.25% 11.05 3.76%
13 5305 0.95% 16.4 2.18% 11.45 3.62%
14 5408 1.94% 16 -2.44% 10.95 -4.37%
15 5510 1.89% 16.25 1.56% 10.55 -3.65%
16 5430 -1.45% 16.5 1.54% 11 4.27%
17 5360 -1.29% 17 3.03% 10.55 -4.09%
18 5420 1.12% 17.35 2.06% 10.1 -4.27%
19 5490 1.29% 18 3.75% 10.7 5.94%
20 5555 1.18% 18.35 1.94% 9.45 -11.68%
21 5500 -0.99% 18.55 1.09% 10.12 7.09%
22 5575 1.36% 19.2 3.50% 10.45 3.26%
Document Page
4CORPORATE FINANCE
23 5645 1.26% 18.7 -2.60% 10.05 -3.83%
24 5695 0.89% 18.2 -2.67% 10.85 7.96%
25 5770 1.32% 18.75 3.02% 11.15 2.76%
Answer 2
Mean return and standard deviation
Market Index Financial Ltd Construction Ltd
Mean return 0.92% 1.56% 1.56%
Standard deviation 0.0168 0.0274 0.0595
From the above table and calculation it is observed that the mean return of
Construction Ltd as well as Financial Ltd both is 1.56%. On the other hand, mean return of
market index is 0.92%. Hence, the mean return of both the company/s stock is better as
compared to market index.
Standard deviation or SD measures the risk of the stock. Higher SD represents that the
stock is high risk associated and on the contrary, lower SD represents that the stock of the
company is associated with lower level of risk (Calzada and Scariano 2013). SD of
construction Ltd is 0.0595 and that of Financial Ltd is 0.0274. However, the market index’s
SD is 0.0168. Hence, both the company’s stock is riskier as compared to market index.
Answer 3
Coefficient of variation
Market Index Financial Ltd Construction Ltd
Coefficient of variation 1.8393 1.7626 3.8080
tabler-icon-diamond-filled.svg

Secure Best Marks with AI Grader

Need help grading? Try our AI Grader for instant feedback on your assignments.
Document Page
5CORPORATE FINANCE
Coefficient of variation or CV is the standards deviation compared to the mean return.
It measures the risk return trade off. Further, lower CV represents that the low dispersion
around the mean return and higher CV represents higher dispersion around mean return
(McAuliffe 2015). From the above it can be identified that the dispersion level Construction
level is highest among all and the dispersion level of Financial Ltd is lowest among all.
Answer 4
Correlation coefficient among construction Ltd and Financial Ltd is 0.72882.
Therefore, the correlation among 2 stocks is positive (Gleason, Bruce Johnson and Li 2013).
Answer 5
Standard deviation of portfolio
Financial Ltd Construction Ltd
Standard deviation 0.02746 0.05956
Weight 0.5 0.5
Correlation 0.7288
Variance 0.0017
Standard Deviation of portfolio 4.09%
SD of portfolio measures the total risk of the portfolio. The SD of portfolio can be
lower if the investment is diversified through investing in different stocks (Mertler and
Reinhart 2016). SD of the portfolio as per the calculation is 4.09%.
Answer 6
Beta coefficient
Document Page
6CORPORATE FINANCE
Financial Ltd Construction Ltd
Beta 0.058 -0.099
Beta measures the sensitivity of price as compared to the market movement. Beta of
Financial Ltd that is 0.058 represents that the company’s stock goes up when there is a
increase in market index. On the other hand, beta of Construction Ltd that is -0.099 represents
company’s stock will go down when there is an increase in market index (Draper and Smith
2014).
Answer 7
Financial Limited –
Risk free rate (Rf) = 3%
Market return (Rm) = 7.26%
Beta (β) = 0.058
Cost of equity (Ke) = Rf + β * (Rm – Rf)
Ke = 3 + 0.058 (7.26-3) = 3.2470%
Therefore, rate of return (r) = 3.2470%
Value of stock = D1 / (Re- g) where, D1 = Dividend for next year, g = growth rate, Re = rate of
return (Baresa, Bogdan and Ivanovic 2013)
Therefore, stock value = 1.03 / (0.03247-0.04) = - $ 136.79
Share price = - $ 136.79
Document Page
7CORPORATE FINANCE
Construction Limited –
Risk free rate (Rf) = 3%
Market return (Rm) = 7.26%
Beta (β) = -0.099
Cost of equity (Ke) = Rf + β * (Rm – Rf)
Ke = 3 – 0.099 (7.26-3) = 2.578%
Therefore, rate of return (r) = 2.578%
Value of stock = D1 / (Re - g) where, D1 = Dividend for next year, g = growth rate, Re = rate of
return (Kung and Schmid 2015)
Therefore, stock value = 0.62 / (0.02578-0.06) = - $ 18.12
Therefore, both the company’s stock is trading at discount. However, share price of
Construction Ltd is higher than Financial Ltd.
tabler-icon-diamond-filled.svg

Paraphrase This Document

Need a fresh take? Get an instant paraphrase of this document with our AI Paraphraser
Document Page
8CORPORATE FINANCE
Reference
Calzada, M.E. and Scariano, S.M., 2013. A synthetic control chart for the coefficient of
variation. Journal of Statistical Computation and Simulation, 83(5), pp.853-867.
Draper, N.R. and Smith, H., 2014. Applied regression analysis(Vol. 326). John Wiley &
Sons.
Gleason, C.A., Bruce Johnson, W. and Li, H., 2013. Valuation model use and the price target
performance of sellside equity analysts. Contemporary Accounting Research, 30(1), pp.80-
115.
Kung, H. and Schmid, L., 2015. Innovation, growth, and asset prices. The Journal of
Finance, 70(3), pp.1001-1037.
McAuliffe, R.E., 2015. Coefficient of variation. Wiley Encyclopedia of Management.
Mertler, C.A. and Reinhart, R.V., 2016. Advanced and multivariate statistical methods:
Practical application and interpretation. Taylor & Francis.
chevron_up_icon
1 out of 8
circle_padding
hide_on_mobile
zoom_out_icon
logo.png

Your All-in-One AI-Powered Toolkit for Academic Success.

Available 24*7 on WhatsApp / Email

[object Object]