Business Finance Assignment: MAF203 - Risk and Valuation Analysis

Verified

Added on  2022/11/25

|9
|1632
|447
Homework Assignment
AI Summary
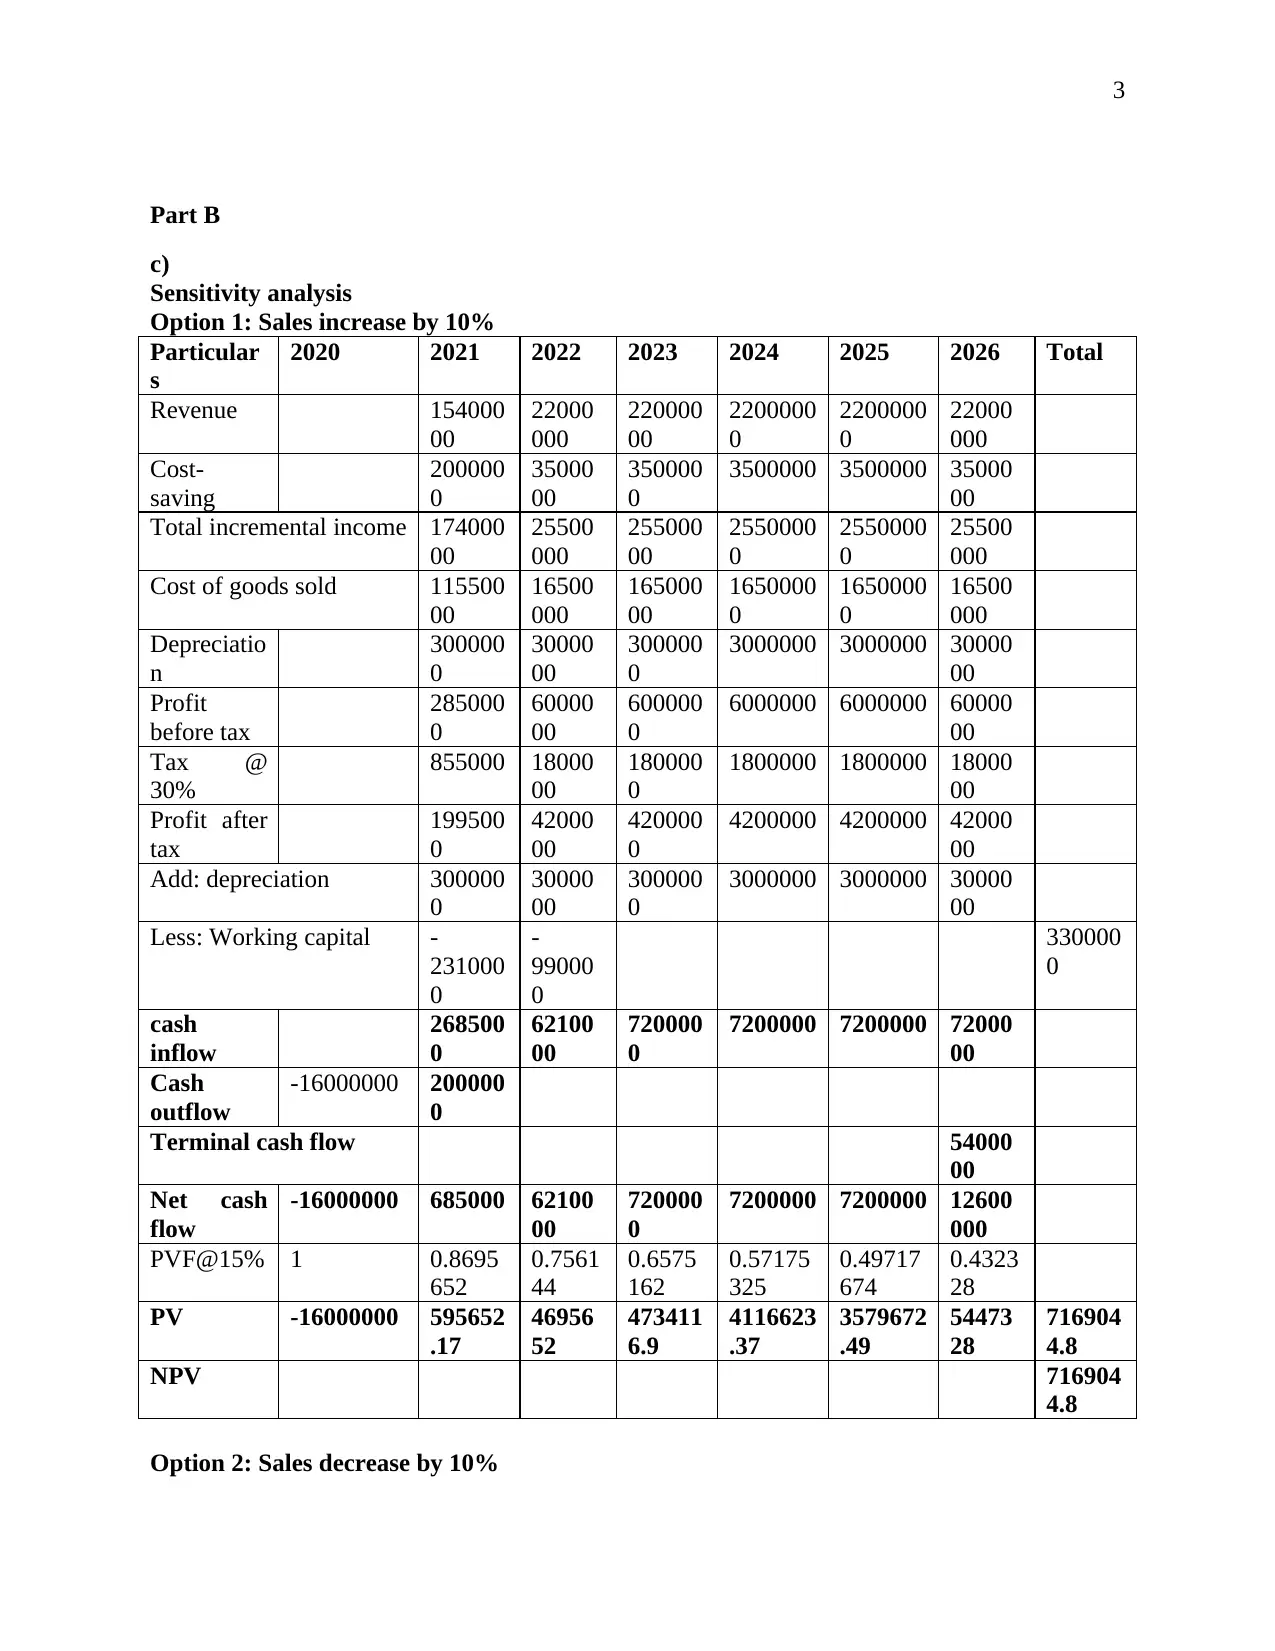
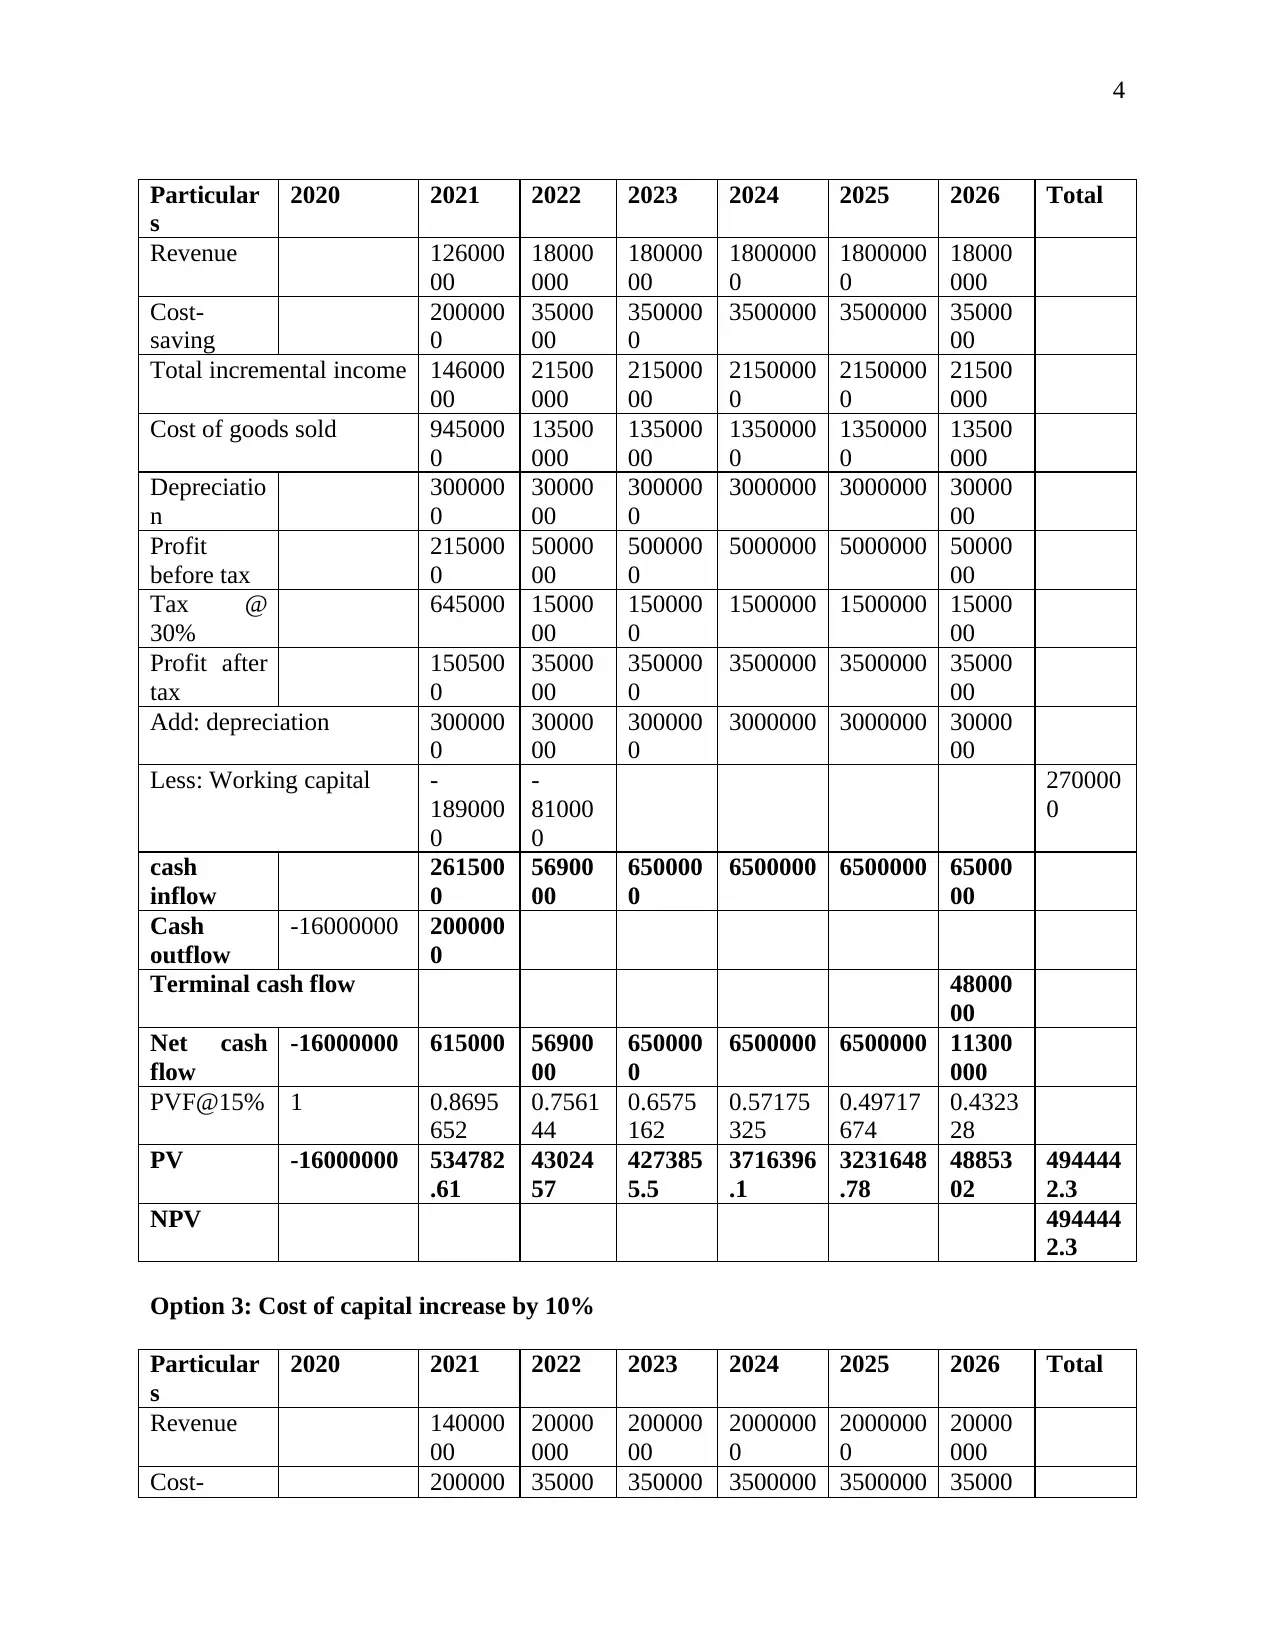
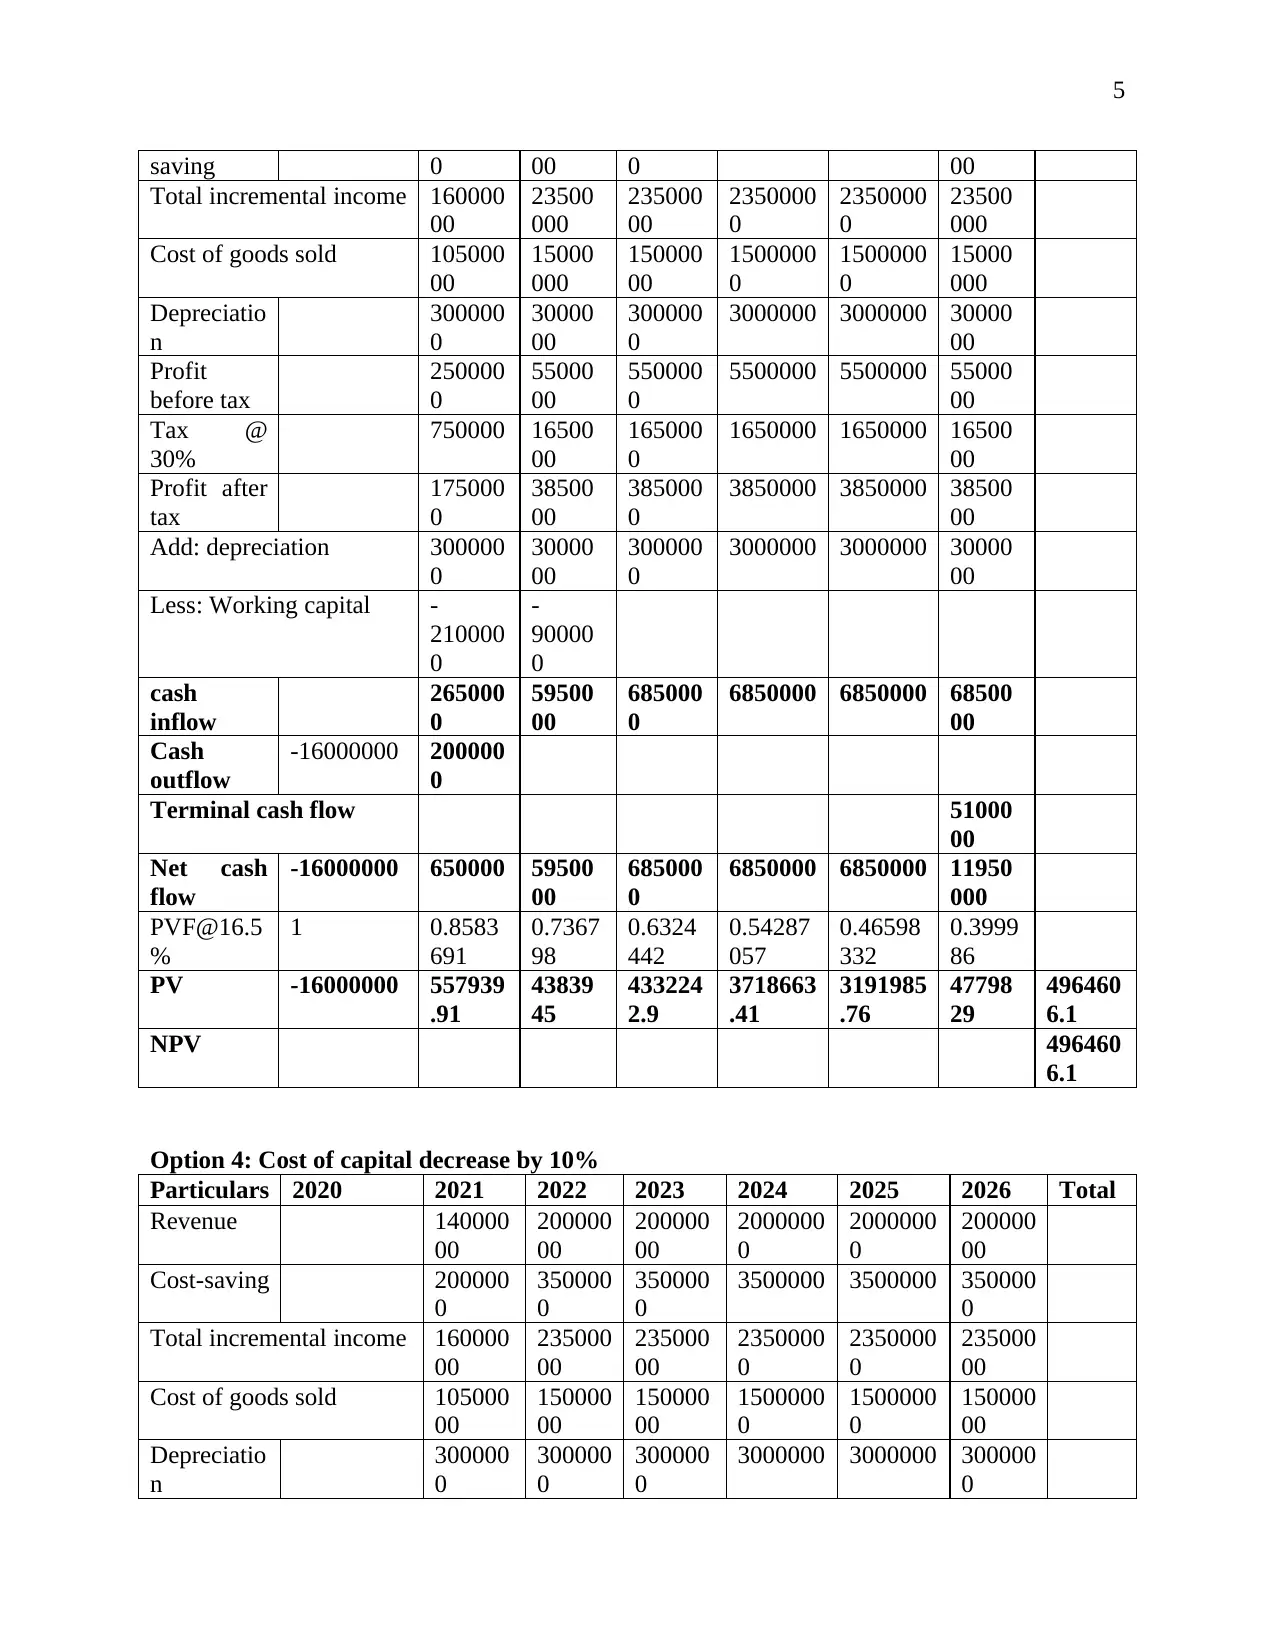
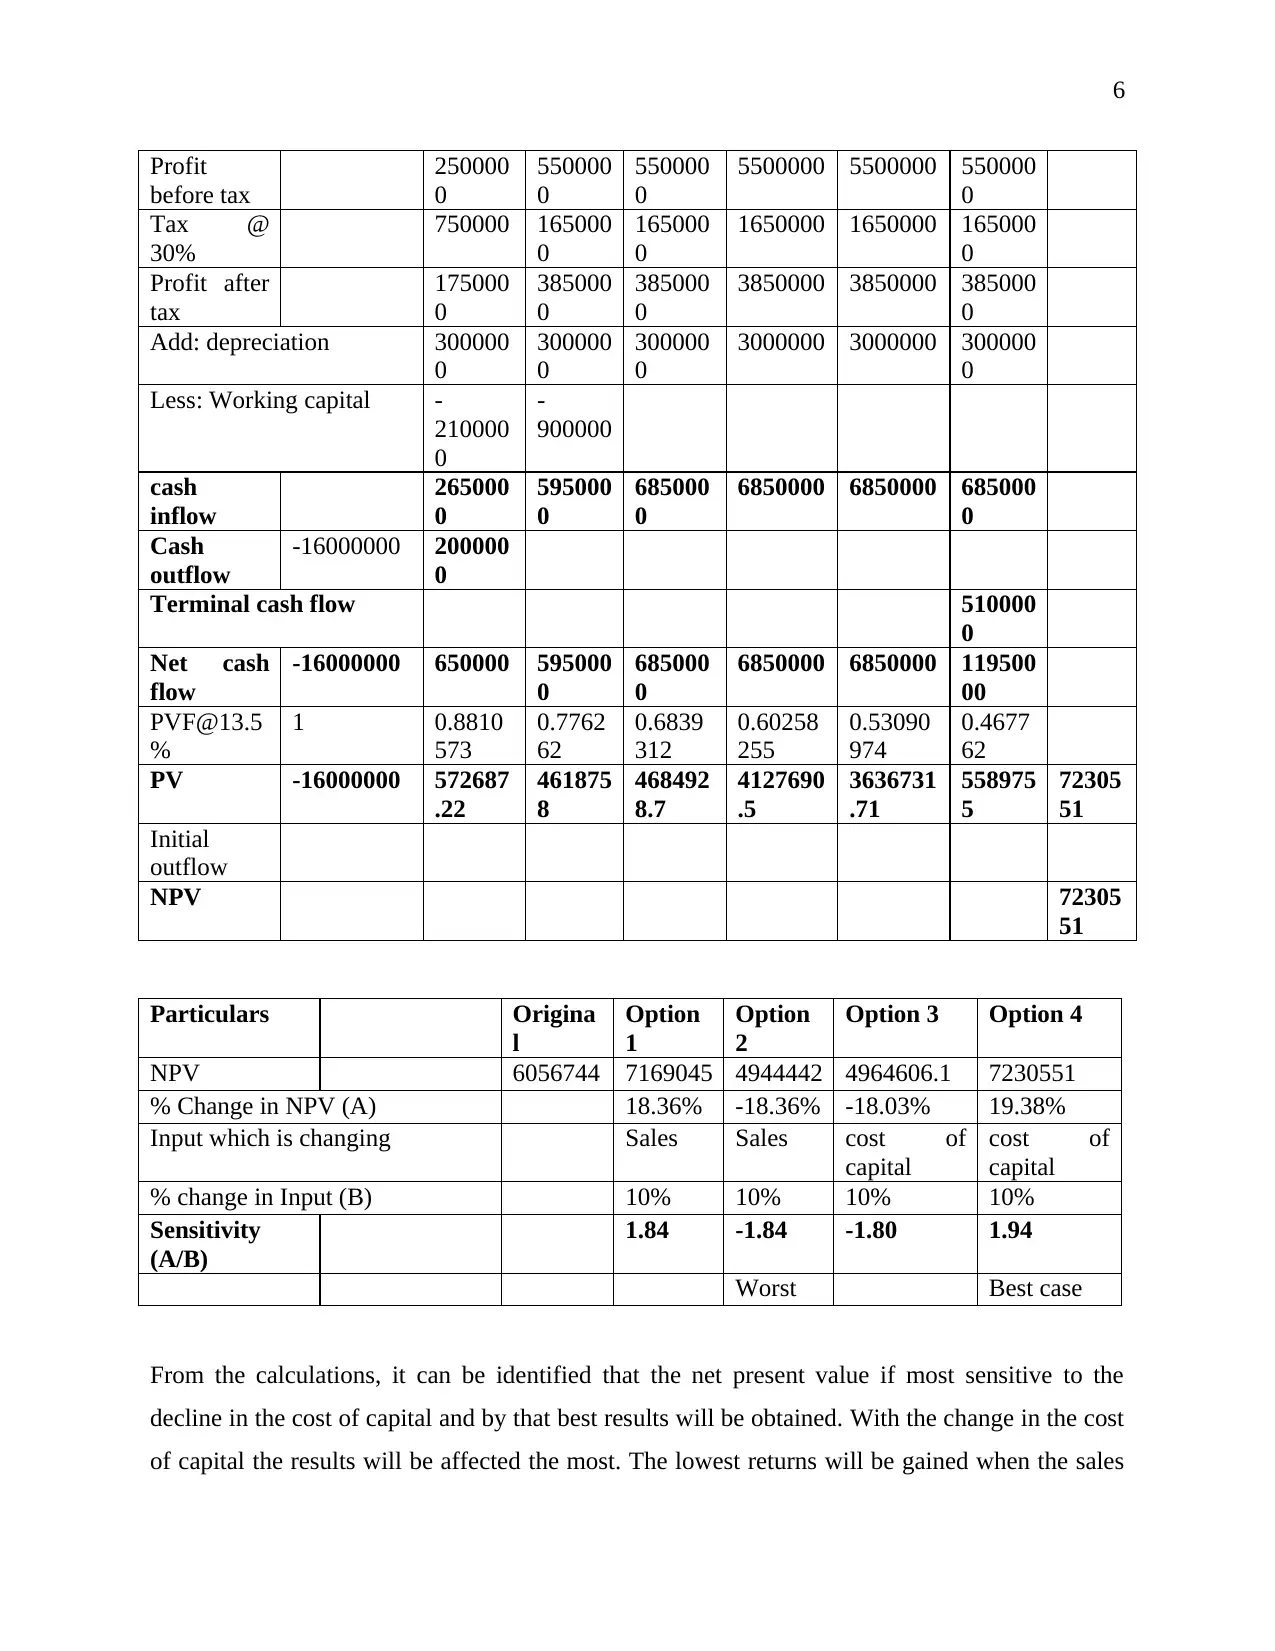
This assignment solution for MAF203 Business Finance covers sensitivity analysis, net present value (NPV) calculations, and risk assessment in the context of a business investment. The document presents detailed financial projections, including revenue, cost of goods sold, and depreciation, to determine profit before and after tax. It explores various scenarios, such as changes in sales and cost of capital, to evaluate their impact on NPV. The analysis includes a discussion of industry risks, particularly those affecting the paper and pulp industry, such as climate change, environmental regulations, and technological advancements. The document provides a comprehensive understanding of financial decision-making and risk management, making it a valuable resource for students studying business finance. The solution presents an assessment of various factors including climatic changes, government regulations, and technological advancements influencing the pulp and paper industry.
tabler-icon-diamond-filled.svg

Contribute Materials

Your contribution can guide someone’s learning journey. Share your documents today.
Document Page
1
Business finance
tabler-icon-diamond-filled.svg

Secure Best Marks with AI Grader

Need help grading? Try our AI Grader for instant feedback on your assignments.
Document Page
2
Table of Contents
Part B...............................................................................................................................................3
c)..................................................................................................................................................3
d)..................................................................................................................................................7
References........................................................................................................................................9
Document Page
3
Part B
c)
Sensitivity analysis
Option 1: Sales increase by 10%
Particular
s
2020 2021 2022 2023 2024 2025 2026 Total
Revenue 154000
00
22000
000
220000
00
2200000
0
2200000
0
22000
000
Cost-
saving
200000
0
35000
00
350000
0
3500000 3500000 35000
00
Total incremental income 174000
00
25500
000
255000
00
2550000
0
2550000
0
25500
000
Cost of goods sold 115500
00
16500
000
165000
00
1650000
0
1650000
0
16500
000
Depreciatio
n
300000
0
30000
00
300000
0
3000000 3000000 30000
00
Profit
before tax
285000
0
60000
00
600000
0
6000000 6000000 60000
00
Tax @
30%
855000 18000
00
180000
0
1800000 1800000 18000
00
Profit after
tax
199500
0
42000
00
420000
0
4200000 4200000 42000
00
Add: depreciation 300000
0
30000
00
300000
0
3000000 3000000 30000
00
Less: Working capital -
231000
0
-
99000
0
330000
0
cash
inflow
268500
0
62100
00
720000
0
7200000 7200000 72000
00
Cash
outflow
-16000000 200000
0
Terminal cash flow 54000
00
Net cash
flow
-16000000 685000 62100
00
720000
0
7200000 7200000 12600
000
PVF@15% 1 0.8695
652
0.7561
44
0.6575
162
0.57175
325
0.49717
674
0.4323
28
PV -16000000 595652
.17
46956
52
473411
6.9
4116623
.37
3579672
.49
54473
28
716904
4.8
NPV 716904
4.8
Option 2: Sales decrease by 10%
Document Page
4
Particular
s
2020 2021 2022 2023 2024 2025 2026 Total
Revenue 126000
00
18000
000
180000
00
1800000
0
1800000
0
18000
000
Cost-
saving
200000
0
35000
00
350000
0
3500000 3500000 35000
00
Total incremental income 146000
00
21500
000
215000
00
2150000
0
2150000
0
21500
000
Cost of goods sold 945000
0
13500
000
135000
00
1350000
0
1350000
0
13500
000
Depreciatio
n
300000
0
30000
00
300000
0
3000000 3000000 30000
00
Profit
before tax
215000
0
50000
00
500000
0
5000000 5000000 50000
00
Tax @
30%
645000 15000
00
150000
0
1500000 1500000 15000
00
Profit after
tax
150500
0
35000
00
350000
0
3500000 3500000 35000
00
Add: depreciation 300000
0
30000
00
300000
0
3000000 3000000 30000
00
Less: Working capital -
189000
0
-
81000
0
270000
0
cash
inflow
261500
0
56900
00
650000
0
6500000 6500000 65000
00
Cash
outflow
-16000000 200000
0
Terminal cash flow 48000
00
Net cash
flow
-16000000 615000 56900
00
650000
0
6500000 6500000 11300
000
PVF@15% 1 0.8695
652
0.7561
44
0.6575
162
0.57175
325
0.49717
674
0.4323
28
PV -16000000 534782
.61
43024
57
427385
5.5
3716396
.1
3231648
.78
48853
02
494444
2.3
NPV 494444
2.3
Option 3: Cost of capital increase by 10%
Particular
s
2020 2021 2022 2023 2024 2025 2026 Total
Revenue 140000
00
20000
000
200000
00
2000000
0
2000000
0
20000
000
Cost- 200000 35000 350000 3500000 3500000 35000
tabler-icon-diamond-filled.svg

Secure Best Marks with AI Grader

Need help grading? Try our AI Grader for instant feedback on your assignments.
Document Page
5
saving 0 00 0 00
Total incremental income 160000
00
23500
000
235000
00
2350000
0
2350000
0
23500
000
Cost of goods sold 105000
00
15000
000
150000
00
1500000
0
1500000
0
15000
000
Depreciatio
n
300000
0
30000
00
300000
0
3000000 3000000 30000
00
Profit
before tax
250000
0
55000
00
550000
0
5500000 5500000 55000
00
Tax @
30%
750000 16500
00
165000
0
1650000 1650000 16500
00
Profit after
tax
175000
0
38500
00
385000
0
3850000 3850000 38500
00
Add: depreciation 300000
0
30000
00
300000
0
3000000 3000000 30000
00
Less: Working capital -
210000
0
-
90000
0
cash
inflow
265000
0
59500
00
685000
0
6850000 6850000 68500
00
Cash
outflow
-16000000 200000
0
Terminal cash flow 51000
00
Net cash
flow
-16000000 650000 59500
00
685000
0
6850000 6850000 11950
000
PVF@16.5
%
1 0.8583
691
0.7367
98
0.6324
442
0.54287
057
0.46598
332
0.3999
86
PV -16000000 557939
.91
43839
45
433224
2.9
3718663
.41
3191985
.76
47798
29
496460
6.1
NPV 496460
6.1
Option 4: Cost of capital decrease by 10%
Particulars 2020 2021 2022 2023 2024 2025 2026 Total
Revenue 140000
00
200000
00
200000
00
2000000
0
2000000
0
200000
00
Cost-saving 200000
0
350000
0
350000
0
3500000 3500000 350000
0
Total incremental income 160000
00
235000
00
235000
00
2350000
0
2350000
0
235000
00
Cost of goods sold 105000
00
150000
00
150000
00
1500000
0
1500000
0
150000
00
Depreciatio
n
300000
0
300000
0
300000
0
3000000 3000000 300000
0
Document Page
6
Profit
before tax
250000
0
550000
0
550000
0
5500000 5500000 550000
0
Tax @
30%
750000 165000
0
165000
0
1650000 1650000 165000
0
Profit after
tax
175000
0
385000
0
385000
0
3850000 3850000 385000
0
Add: depreciation 300000
0
300000
0
300000
0
3000000 3000000 300000
0
Less: Working capital -
210000
0
-
900000
cash
inflow
265000
0
595000
0
685000
0
6850000 6850000 685000
0
Cash
outflow
-16000000 200000
0
Terminal cash flow 510000
0
Net cash
flow
-16000000 650000 595000
0
685000
0
6850000 6850000 119500
00
PVF@13.5
%
1 0.8810
573
0.7762
62
0.6839
312
0.60258
255
0.53090
974
0.4677
62
PV -16000000 572687
.22
461875
8
468492
8.7
4127690
.5
3636731
.71
558975
5
72305
51
Initial
outflow
NPV 72305
51
Particulars Origina
l
Option
1
Option
2
Option 3 Option 4
NPV 6056744 7169045 4944442 4964606.1 7230551
% Change in NPV (A) 18.36% -18.36% -18.03% 19.38%
Input which is changing Sales Sales cost of
capital
cost of
capital
% change in Input (B) 10% 10% 10% 10%
Sensitivity
(A/B)
1.84 -1.84 -1.80 1.94
Worst Best case
From the calculations, it can be identified that the net present value if most sensitive to the
decline in the cost of capital and by that best results will be obtained. With the change in the cost
of capital the results will be affected the most. The lowest returns will be gained when the sales
Document Page
7
will be declined by 10% and so the situation shall be avoided.
d)
In the global environment, there are various industries which are operating and one of them is
paper and pulp industry. It has been identified that the industry does not maintain high growth
and there is very low level at which the growth is made. It is required that there shall be
improvement in the position of the industry and for that appropriate steps are required to be
undertaken. All of the risks which are not measurable and are affecting the industry in adverse
manner are identified below in proper manner.
There are various risks which are involved and in the paper and pulp industry and out of them the
most important is the climatic changes which are taking place in the current environment. It has
been noted that due to the changing circumstances the forests are reducing and that affects the
wood availability (Environmental paper, 2018). There is an impact on the wildlife also which is
faced as they do not get the required habitat and also the issue of food shortage is faced by them.
They are not able to survive in such conditions and by that the species are declined. In this way
both are affected adversely and also affect the industry in negative manner. The climate is
affected by various such reasons which cannot be controlled and that leads to the continuance of
the situation.
The companies’ are required to follow all the laws which are made applicable by the
government. In the changing scenario, there are several such laws which are made for the
protection of the environment and that affects the overall performance. There are various
restrictions which are imposed and by that companies are not able to operate in the manner
required (Lane and Rosewall, 2015). They will not be allowed to cut the trees or hunt for the
animals which will be affecting their production as they will not be getting the required amount
of the raw material. The demand will be left unattended and that is leading to the declined
growth in the industry. This way the complete performance is affected by the interference of the
government and so the appropriate actions shall be taken to deal with the situation.
The changing world faces technological development which is required to be incorporated in the
business to fulfill the requirements. There are many changes but the industry is not taking them
tabler-icon-diamond-filled.svg

Paraphrase This Document

Need a fresh take? Get an instant paraphrase of this document with our AI Paraphraser
Document Page
8
in account and due to that lacks behind in this respect. All the work which is performed by it
takes more time and also the raw material which is available is at high cost (Obidzinski and
Dermawan, 2012). The slow production is made possible and due to that the demand is not met
in proper manner. It becomes a time-consuming process and in that there is slow development
which takes place. This situation arises because of the difficulty in identifying and implementing
all the new approaches which come in the market.
The feasibility of the project will be determined with the help of these aspects as they will be
affecting the success of the project. The company will be required to check the location at which
the project is undertaken and with that, the climatic conditions of that place are to be considered.
this will help in determining whether the climate is in favor of the company or not (Toppinen et
al., 2017). The availability of the raw material will also be evaluated and it will be determined
before making any decision. By that any hindrance which may be faced because of the same will
be identified in advance and steps will be taken accordingly. The supply conditions of the place
will also be identified by which it will be identified that the material will be available on time or
not. The forests are the main source of the raw material and so that forests in that area will have
to be identified and then the decision will be made accordingly.
Document Page
9
References
Environmental paper. (2018) The state of global paper industry. [Online] Available at:
https://environmentalpaper.org/wp-content/uploads/2018/04/StateOfTheGlobalPaperIndustry201
8_FullReport-Final-1.pdf [Accessed 9 September 2019]
Lane, K. and Rosewall, T. (2015) Firms’ investment decisions and interest rates. Firms’
Investment Decisions and Interest Rates 1 Why Is Wage Growth So Low? 9 Developments in
Thermal Coal Markets 19 Potential Growth and Rebalancing in China 29 Banking Fees in
Australia 39, p.1.
Obidzinski, K. and Dermawan, A. (2012) Pulp industry and environment in Indonesia: is there
sustainable future?. Regional Environmental Change, 12(4), pp.961-966.
Toppinen, A., Pätäri, S., Tuppura, A. and Jantunen, A. (2017) The European pulp and paper
industry in the transition to a bio-economy: A Delphi study. Futures, 88, pp.1-14.
chevron_up_icon
1 out of 9
circle_padding
hide_on_mobile
zoom_out_icon
logo.png

Your All-in-One AI-Powered Toolkit for Academic Success.

Available 24*7 on WhatsApp / Email

[object Object]