In-depth Report on Corporate Finance: SML, CML, MVP and CAPM Analysis
VerifiedAdded on 2023/06/08
|12
|2984
|83
Report
AI Summary
This report provides a detailed analysis of key corporate finance concepts including the Security Market Line (SML), Capital Market Line (CML), Minimum Variance Portfolio (MVP), and Capital Asset Pricing Model (CAPM). It elucidates the differences between SML and CML in terms of risk consideration, investment analysis methods, and result interpretation, highlighting the strengths of CML in analyzing portfolio risk. The significance of MVP in identifying low-risk portfolios and shielding investors from market volatility is explored. Furthermore, the report discusses the application of CAPM in determining the required rate of return for investors, weighing its ease of use against its limitations related to assumptions. The report concludes by emphasizing the importance of these models in informing investment decisions and managing risk.

Running head: CORPORATE FINANCE
Corporate Finance
Name of the Student:
Name of the University:
Authors Note:
Corporate Finance
Name of the Student:
Name of the University:
Authors Note:
Paraphrase This Document
Need a fresh take? Get an instant paraphrase of this document with our AI Paraphraser
CORPORATE FINANCE
1
Table of Contents
Introduction:...............................................................................................................................2
Exploring the difference between security market line (SML) and capital market line (CML):
....................................................................................................................................................2
Exploring the significance of Minimum Variance Portfolio (MVP):........................................5
Exploring why CAPM calculation is used for identifying the required rate of return by
investors:....................................................................................................................................7
Conclusion:................................................................................................................................9
References and Bibliography:..................................................................................................10
CORPORATE FINANCE
2
Introduction:
The assessment evaluates the significance of Security market line, capital market line,
minimum variance portfolio and Capital Asset pricing model. In addition, the investors
intends to formulate the portfolio, which has returns and low risk from investment. The
assessment sheds light on the difference between the security market line and capital market
line, which is used for understanding the risk and return attributes of an investment.
Minimum variance portfolio is considered to be one of the viable approaches, which is used
by investors for contemplating the future returns and risk associated with investment.
Furthermore, the belief of investors on CAPM Model is relatively high, as the technique has
allowed the investors to detect the minimum returns that should be provided by investment in
comparison to its risk attribute.
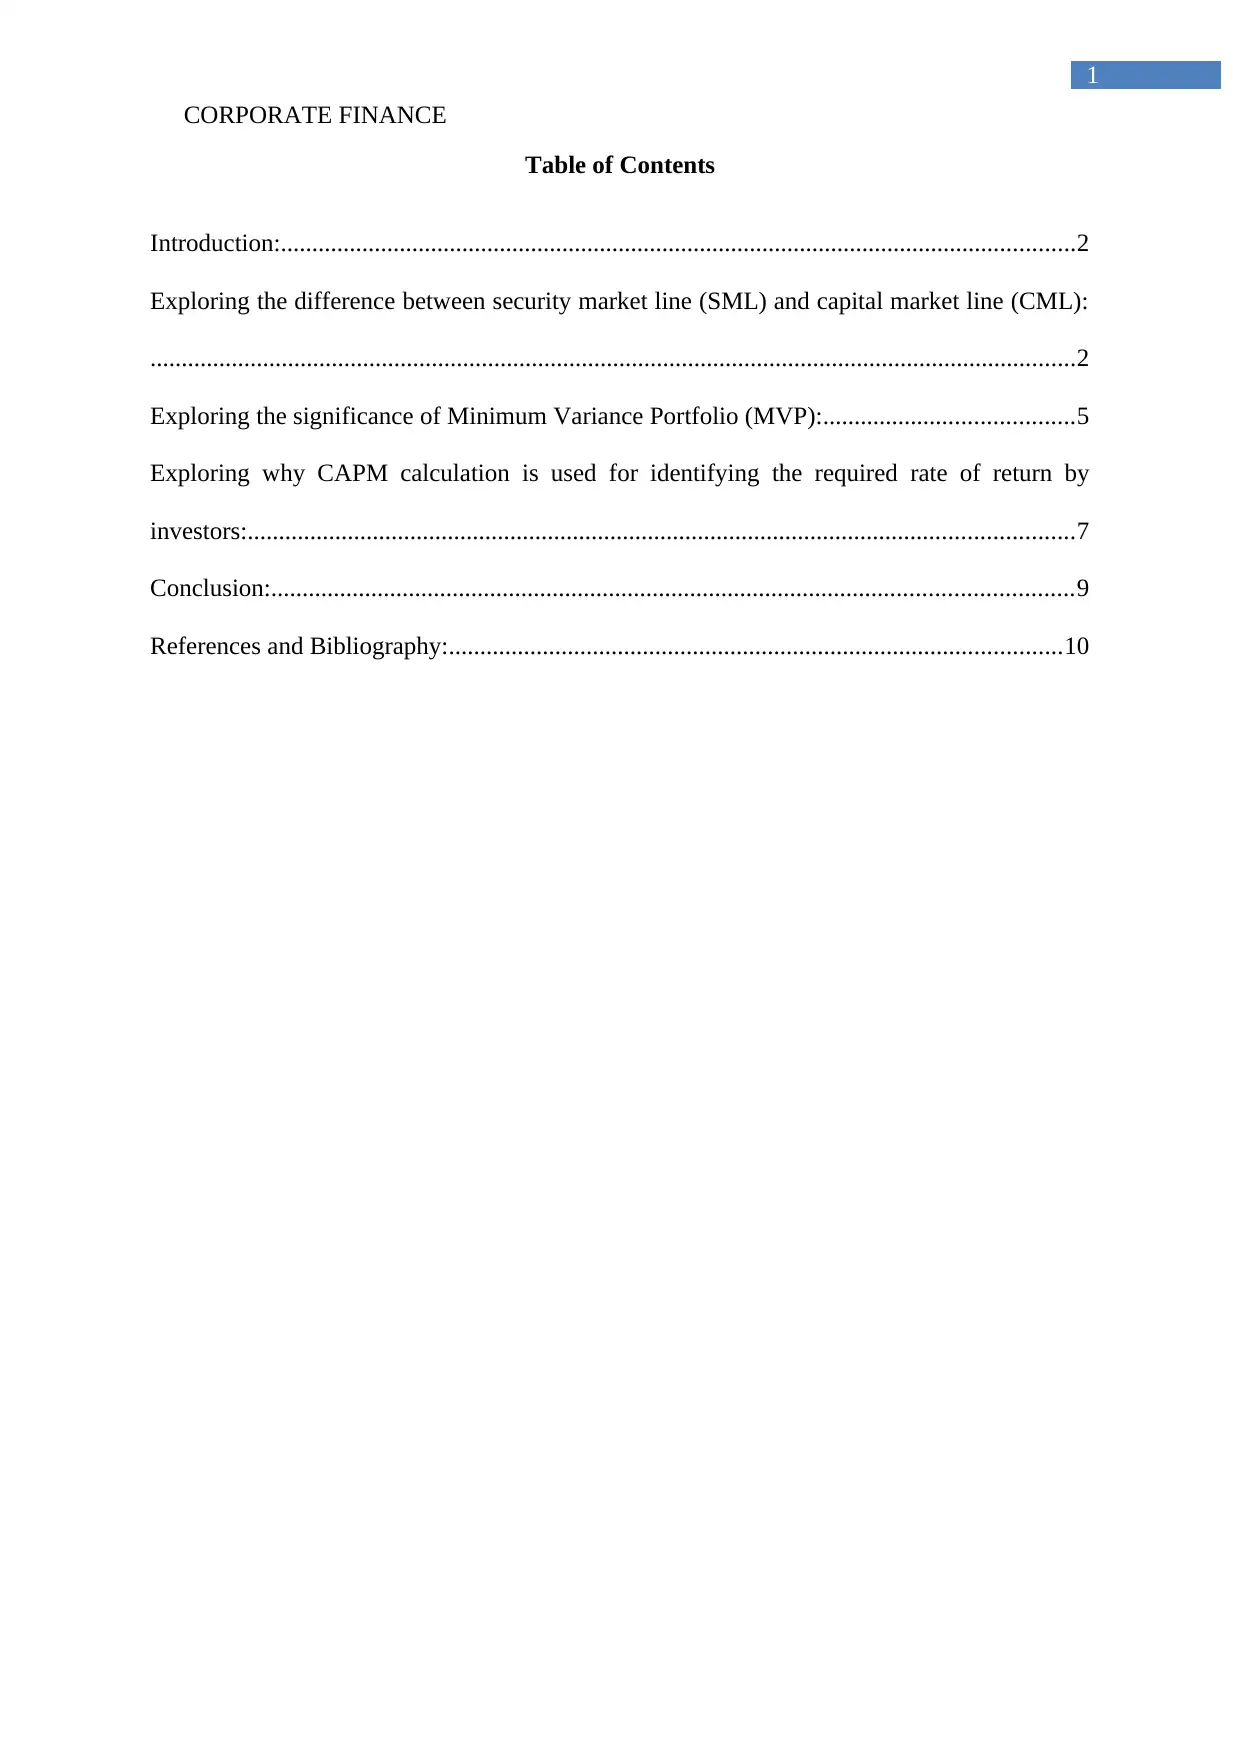
Exploring the difference between security market line (SML) and capital market line
(CML):
Figure 1: Security Market Line (SML) Graph
(Source: Brooks and Mukherjee 2013)
2
Introduction:
The assessment evaluates the significance of Security market line, capital market line,
minimum variance portfolio and Capital Asset pricing model. In addition, the investors
intends to formulate the portfolio, which has returns and low risk from investment. The
assessment sheds light on the difference between the security market line and capital market
line, which is used for understanding the risk and return attributes of an investment.
Minimum variance portfolio is considered to be one of the viable approaches, which is used
by investors for contemplating the future returns and risk associated with investment.
Furthermore, the belief of investors on CAPM Model is relatively high, as the technique has
allowed the investors to detect the minimum returns that should be provided by investment in
comparison to its risk attribute.
Exploring the difference between security market line (SML) and capital market line
(CML):
Figure 1: Security Market Line (SML) Graph
(Source: Brooks and Mukherjee 2013)
⊘ This is a preview!⊘
Do you want full access?
Subscribe today to unlock all pages.
Trusted by 1+ million students worldwide
CORPORATE FINANCE
3
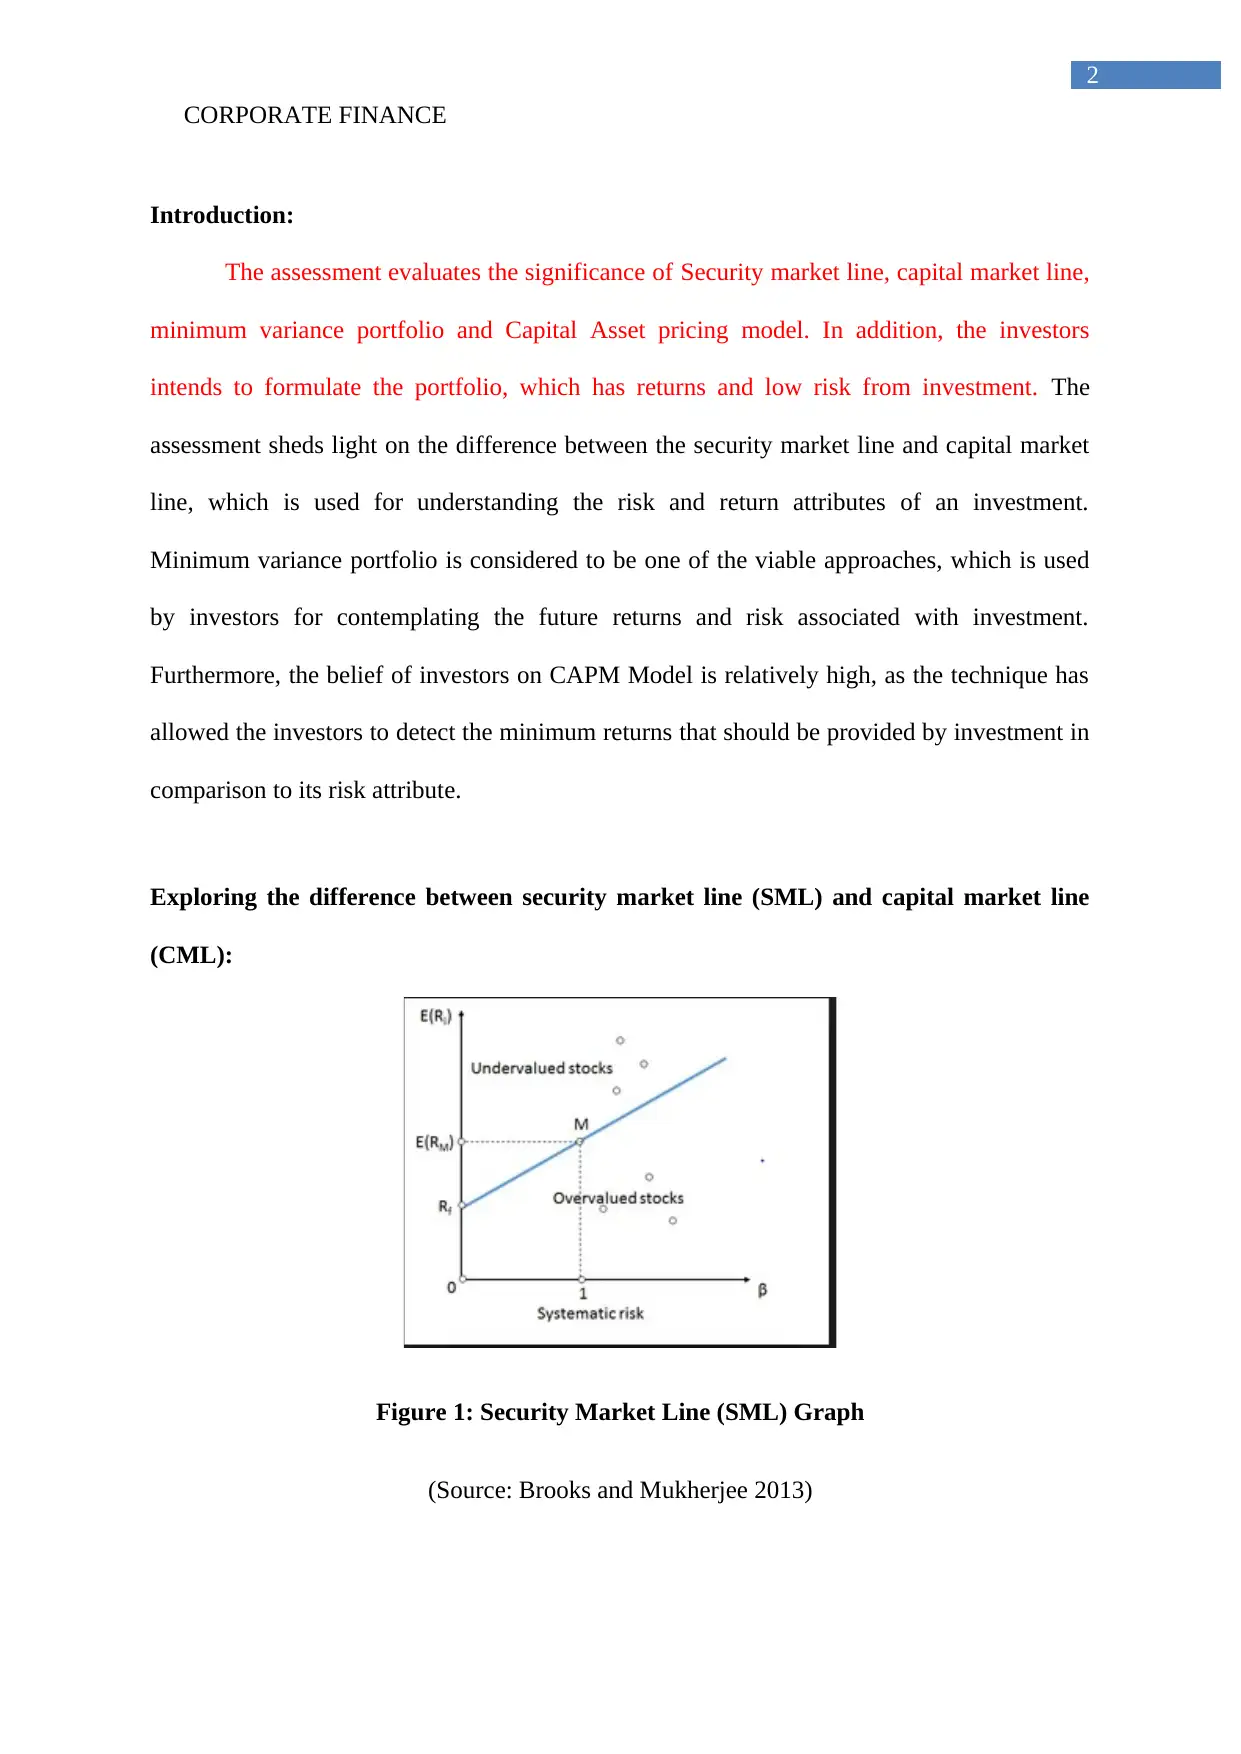
Figure 2: Capital Market Line (CML) Graph
(Source: Christensen, Hail and Leuz 2016)
The above figure 1 and 2 relatively depict the SML and CML graph, which could be
used by investor for analyzing the current trajectory of the stocks and determine its return and
risk attribute. Furthermore, the graph adequately indicates that with the help of security
market line the investors are able to understand the level of relationship between the
systematic risk and return from investment. This is mainly contemplated by using the
expected return and beta of the stock to determine the minimum returns that it needs to
provide during the investment phase. On the other hand, figure 2 depict the curve, which is
created by using different portfolio weights that helps in detecting the minimum risk that
could be generated from a particular portfolio. The further differences between the capital
SML and CML are elaborated as follows.
Difference is risk consideration:
There are different risk attributes associated with the capital market line and security
market line, which is detected in the calculation of risk and reward section of the
investment. This alteration in the risk consideration directly alters the way which an investor
3
Figure 2: Capital Market Line (CML) Graph
(Source: Christensen, Hail and Leuz 2016)
The above figure 1 and 2 relatively depict the SML and CML graph, which could be
used by investor for analyzing the current trajectory of the stocks and determine its return and
risk attribute. Furthermore, the graph adequately indicates that with the help of security
market line the investors are able to understand the level of relationship between the
systematic risk and return from investment. This is mainly contemplated by using the
expected return and beta of the stock to determine the minimum returns that it needs to
provide during the investment phase. On the other hand, figure 2 depict the curve, which is
created by using different portfolio weights that helps in detecting the minimum risk that
could be generated from a particular portfolio. The further differences between the capital
SML and CML are elaborated as follows.
Difference is risk consideration:
There are different risk attributes associated with the capital market line and security
market line, which is detected in the calculation of risk and reward section of the
investment. This alteration in the risk consideration directly alters the way which an investor
Paraphrase This Document
Need a fresh take? Get an instant paraphrase of this document with our AI Paraphraser
CORPORATE FINANCE
4
can understand the systematic and unsystematic risk of an investment. The evaluation
directly indicates that capital market line uses standard deviation method for determining the
risk of an investment. On the other hand, security market line directly used as beta, as the risk
attribute for a particular investment. Therefore, with the help of Beta adequate this attribute
of a particular stock is calculated by security market line, while the standard deviation of
capital market line is used to detect the risk attribute of the portfolio (Epstein and Zin 2013).
Method of analyzing the investment:
The method of analyzing an investment is relatively different for both capital market
line and security market, which adequately helps the investor to detect the risk and return
attribute. Furthermore, the measures used by capital market line used to evaluate and analyze
different strokes, which combined in a particular portfolio. The risk and return attributes of
the portfolio is considered, which adequately allows the investors to detect a curve indicating
risk and return attributes of the portfolio. Nevertheless, SML analysis only one stock and
detect the return and risk attributes of the investment. Therefore, it can be understood that
investors looking for portfolio investment can use capital market line, while security market
line would help in choosing the return capability of a particular stock.
Alternating results:
The calculations conducted by capital market line relatively help in detecting an
efficient Frontier curve, which can help investors to understand the implication of different
weight class that can be used to formulate the portfolio. Capital market line eventually allows
the investors to create an adequate portfolio, which can generate higher returns while
engulfing low risk from investment. Nevertheless, SML eventually allows the investor to
understand the risk and return attributes of a particular stock by evaluating risk free rate and
market returns (Gagliardini and Gourieroux 2013).
Superiority in analyzing risk factors:
CORPORATE FINANCE
5
Furthermore, capital market line has a security in analyzing the risk factor in
comparison to security market line, as it helps in drafting an adequate weightage, which could
be used for investment purposes. The security market line only evaluates the risk factors and
returns for the particular stock, which does not help in diversifying the disk attributes of the
investor. On the other hand, capital market line adequately evaluates different stocks to detect
the risk attribute of the total portfolio, which might allow the investor to detect the actual risk
factors affecting its investment.
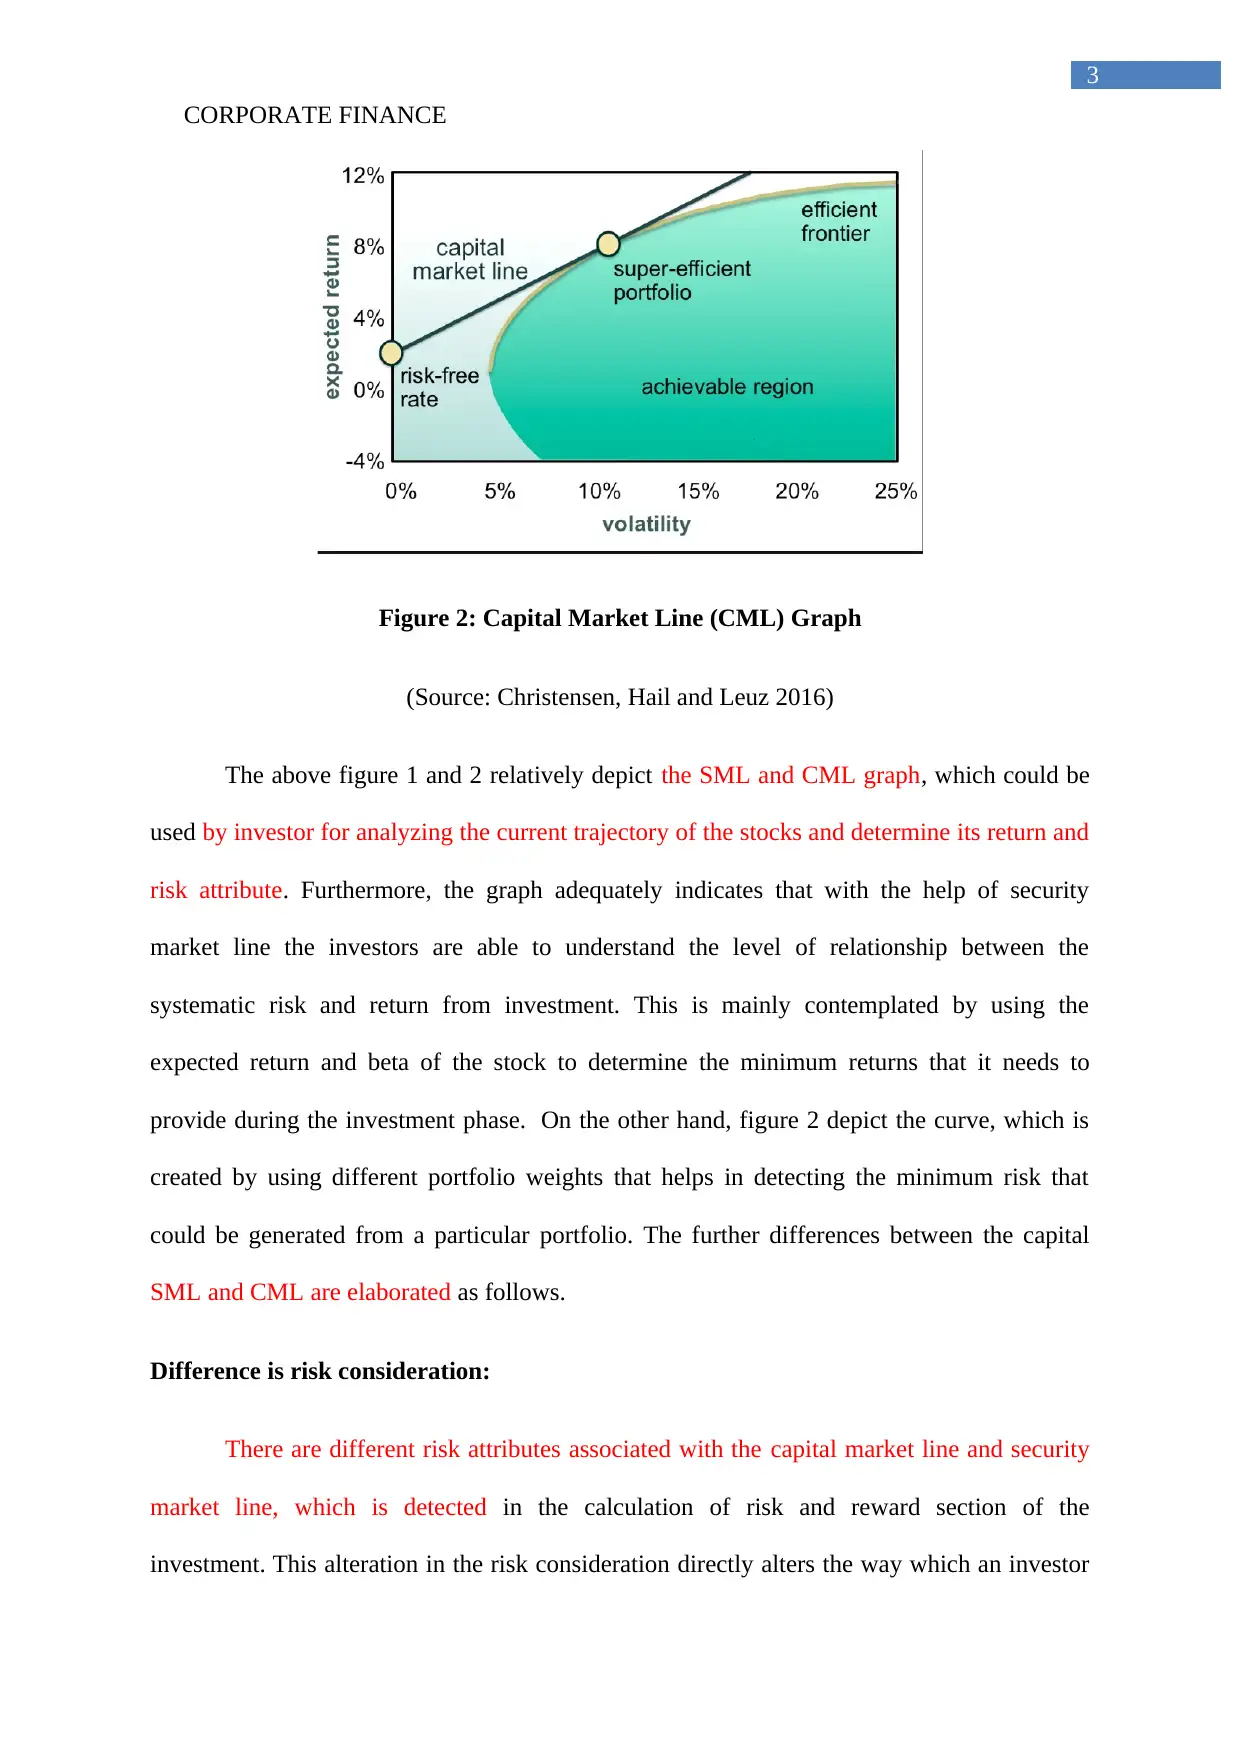
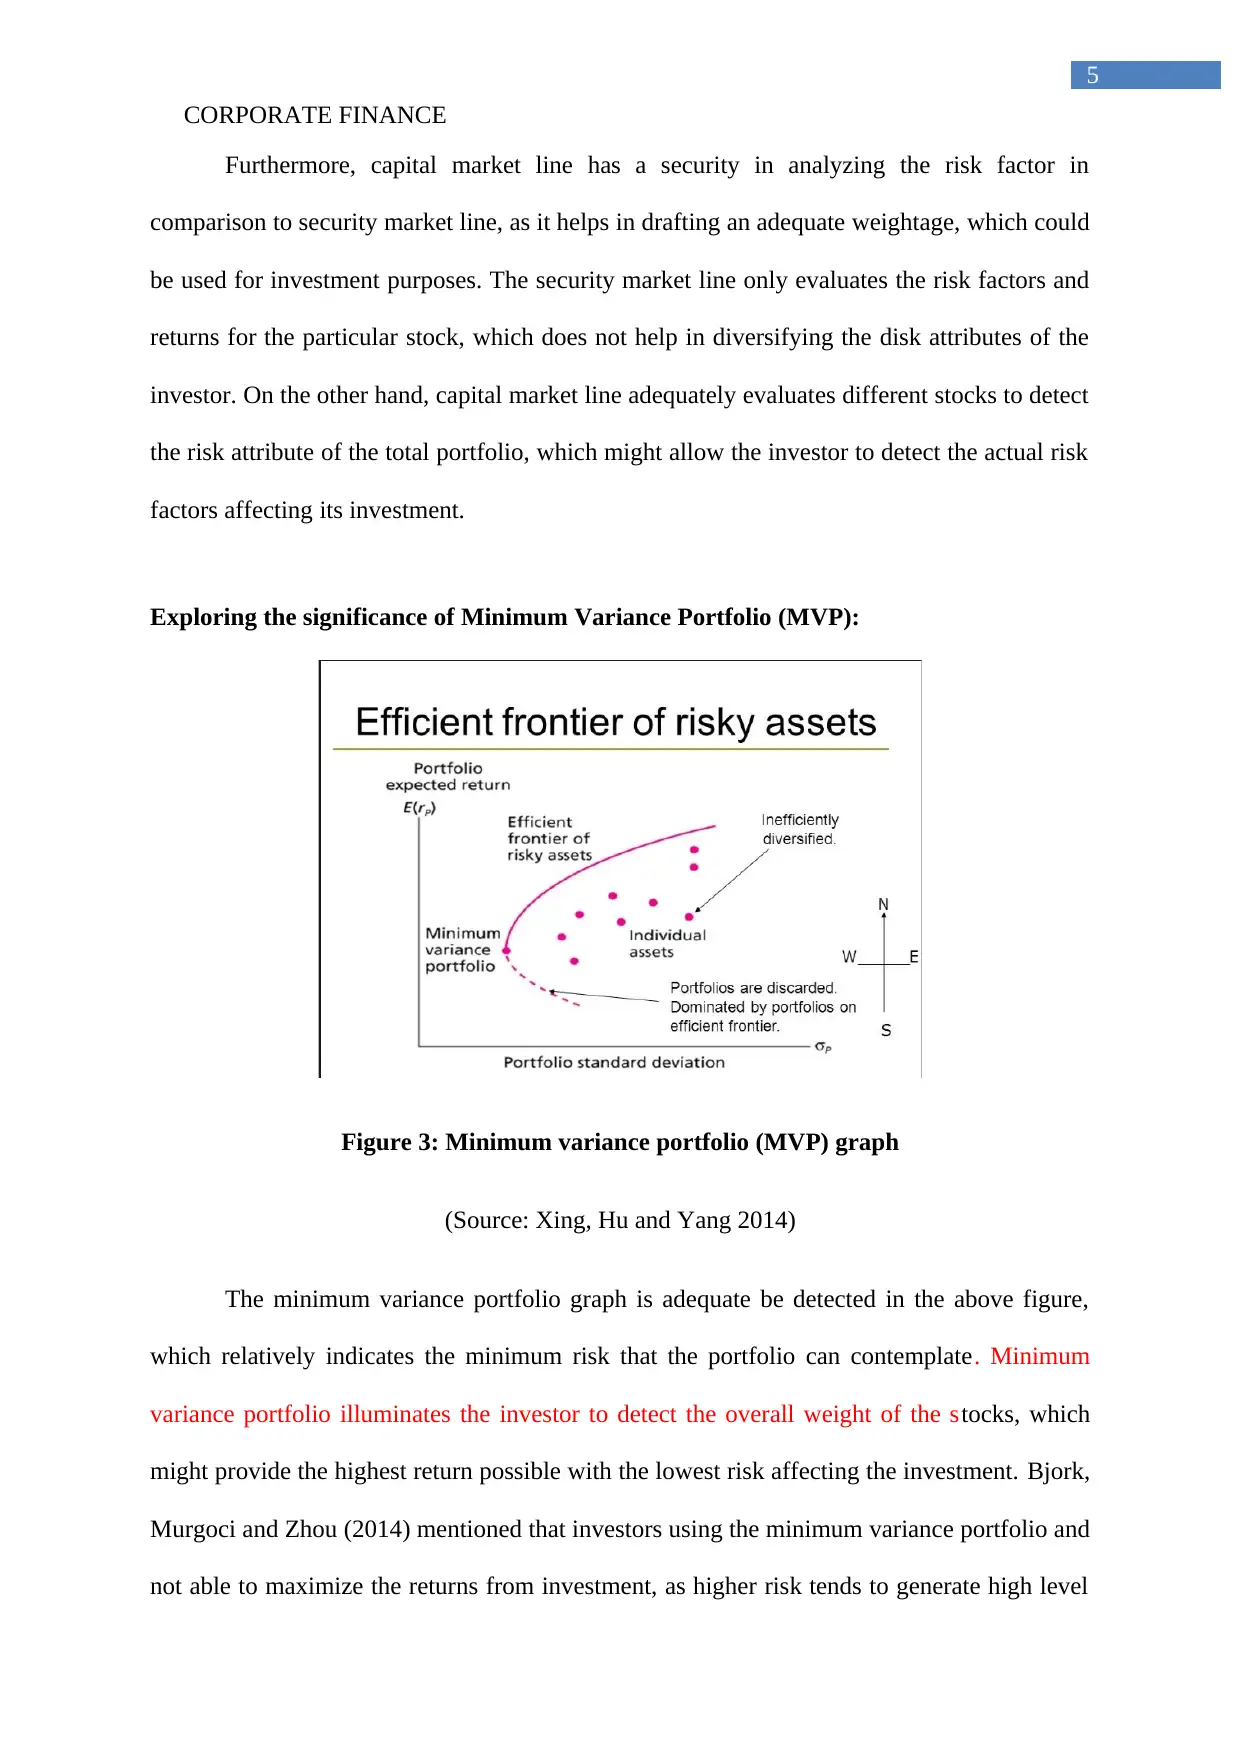
Exploring the significance of Minimum Variance Portfolio (MVP):
Figure 3: Minimum variance portfolio (MVP) graph
(Source: Xing, Hu and Yang 2014)
The minimum variance portfolio graph is adequate be detected in the above figure,
which relatively indicates the minimum risk that the portfolio can contemplate. Minimum
variance portfolio illuminates the investor to detect the overall weight of the stocks, which
might provide the highest return possible with the lowest risk affecting the investment. Bjork,
Murgoci and Zhou (2014) mentioned that investors using the minimum variance portfolio and
not able to maximize the returns from investment, as higher risk tends to generate high level
5
Furthermore, capital market line has a security in analyzing the risk factor in
comparison to security market line, as it helps in drafting an adequate weightage, which could
be used for investment purposes. The security market line only evaluates the risk factors and
returns for the particular stock, which does not help in diversifying the disk attributes of the
investor. On the other hand, capital market line adequately evaluates different stocks to detect
the risk attribute of the total portfolio, which might allow the investor to detect the actual risk
factors affecting its investment.
Exploring the significance of Minimum Variance Portfolio (MVP):
Figure 3: Minimum variance portfolio (MVP) graph
(Source: Xing, Hu and Yang 2014)
The minimum variance portfolio graph is adequate be detected in the above figure,
which relatively indicates the minimum risk that the portfolio can contemplate. Minimum
variance portfolio illuminates the investor to detect the overall weight of the stocks, which
might provide the highest return possible with the lowest risk affecting the investment. Bjork,
Murgoci and Zhou (2014) mentioned that investors using the minimum variance portfolio and
not able to maximize the returns from investment, as higher risk tends to generate high level
⊘ This is a preview!⊘
Do you want full access?
Subscribe today to unlock all pages.
Trusted by 1+ million students worldwide
CORPORATE FINANCE
6
of returns. On the other hand, Yang et al. (2015) mentioned that minimum variance portfolio
is used by investors having a conservative investment attitude, as it comes in reducing the
risk level of investment, which does not let the investor to generate higher returns from
investment.
The significance of minimum variance portfolio is depicted as follows.
Identifying the lowest risk-generating portfolio:
The minimum variance portfolio adequately allows the investor to detect the low risk-
generating portfolio, which eventually helps in securing the overall investment capital. The
minimum variance portfolio directly values the different conditions in which an investment
can be conducted for reducing the total risk of the portfolio and maximizes its returns.
Moreover, the method directly uses a combination of different weights to improve returns
that could be generated from an investment. Consequently, investors with the conservative
outlook can use the minimum variance portfolio for securing the investment and maximizing
the level of returns, which could be generated from the particular risk exposure.
Minimizes the risk attributes of investment:
Furthermore, investors using the minimum variance portfolio are able to reduce the
level of risk attributes from the investment by combining different level of stocks. This
combination eventually supports the conservative investors to maximize the returns on a
given level of risk. The calculations conducted in the minimum variance portfolio directly
combine the stocks with different weights, where the investors are able to generate the lowest
risk from their investment by using the above method. Lehutova, Krizanova and Kliestik
(2013) argued that minimum variance portfolio loses its friction and value when an economic
crisis occurs, as the whole capital market is negatively affected.
Shielding investors from volatile capital market fluctuations:
Paraphrase This Document
Need a fresh take? Get an instant paraphrase of this document with our AI Paraphraser
CORPORATE FINANCE
7
Moreover, minimum variance portfolio also Shields the investors from volatile capital
market fluctuations, which occur frequently due to the presence of continuous demand and
supply. The fluctuations in capital market directly respond to the improvements and the
growth obtained by organizations, which are listed in the index. The changes in value
eventually fluctuates the prices of a particular stock and hampers the investment scope.
Therefore, implementation of MVP investors are able to diversify the investment, which
reduces the level of negative impact that capital market can have on the portfolio returns.
Hence, it could be identified that minimum variance portfolio acts as an insurance for the
investors, which allows them to generate high returns from investment.
Combining both low risk and high-risk stocks:
The major significance of the minimum variance portfolio is its capability to combine
both lowest and highest stock in a particular investment portfolio to generate high returns.
The calculations conducted in the minimum variance portfolio directly allow the investor to
understand the level of risk attribute that is affecting their Investments. Hence, the
combination of both lowest and highest stocks directly helps in improving the level of returns
valued using the risk attributes from investment.
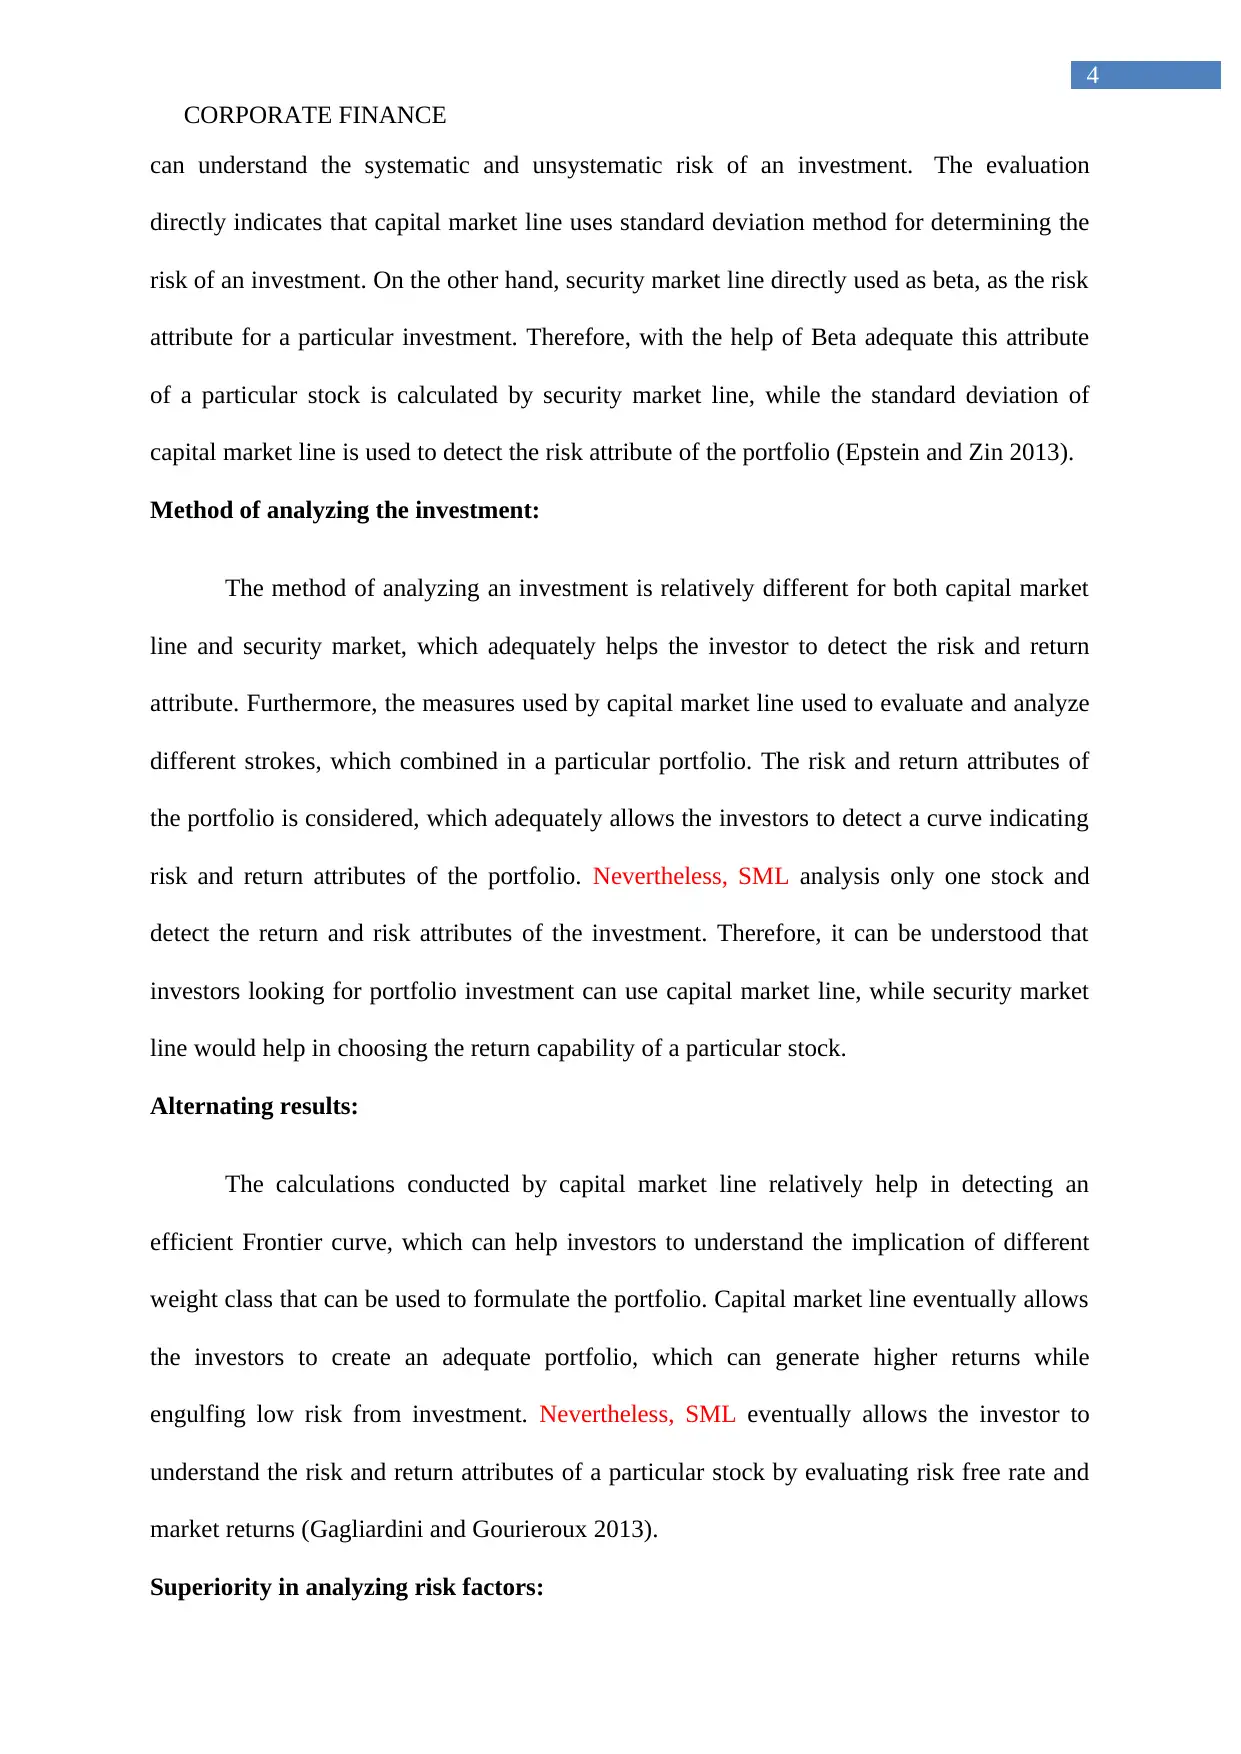
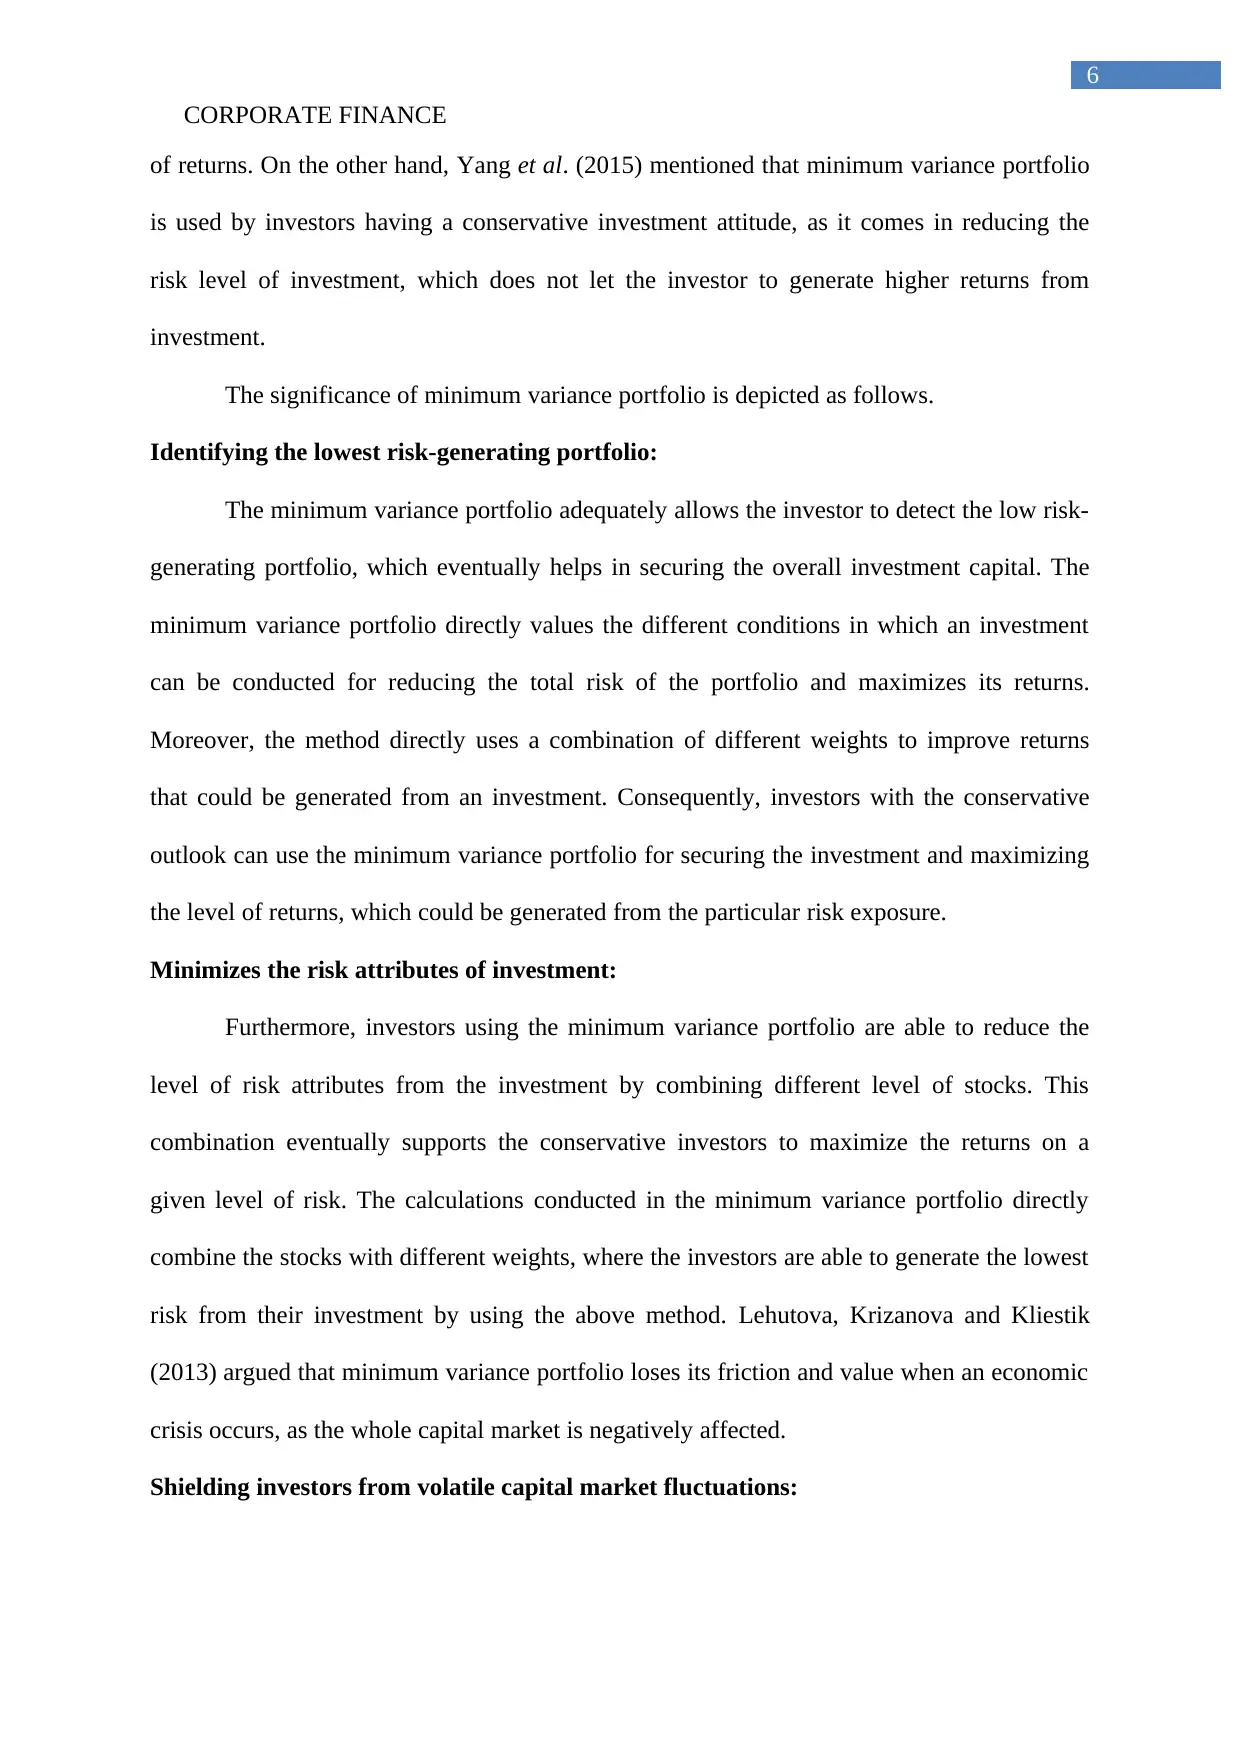
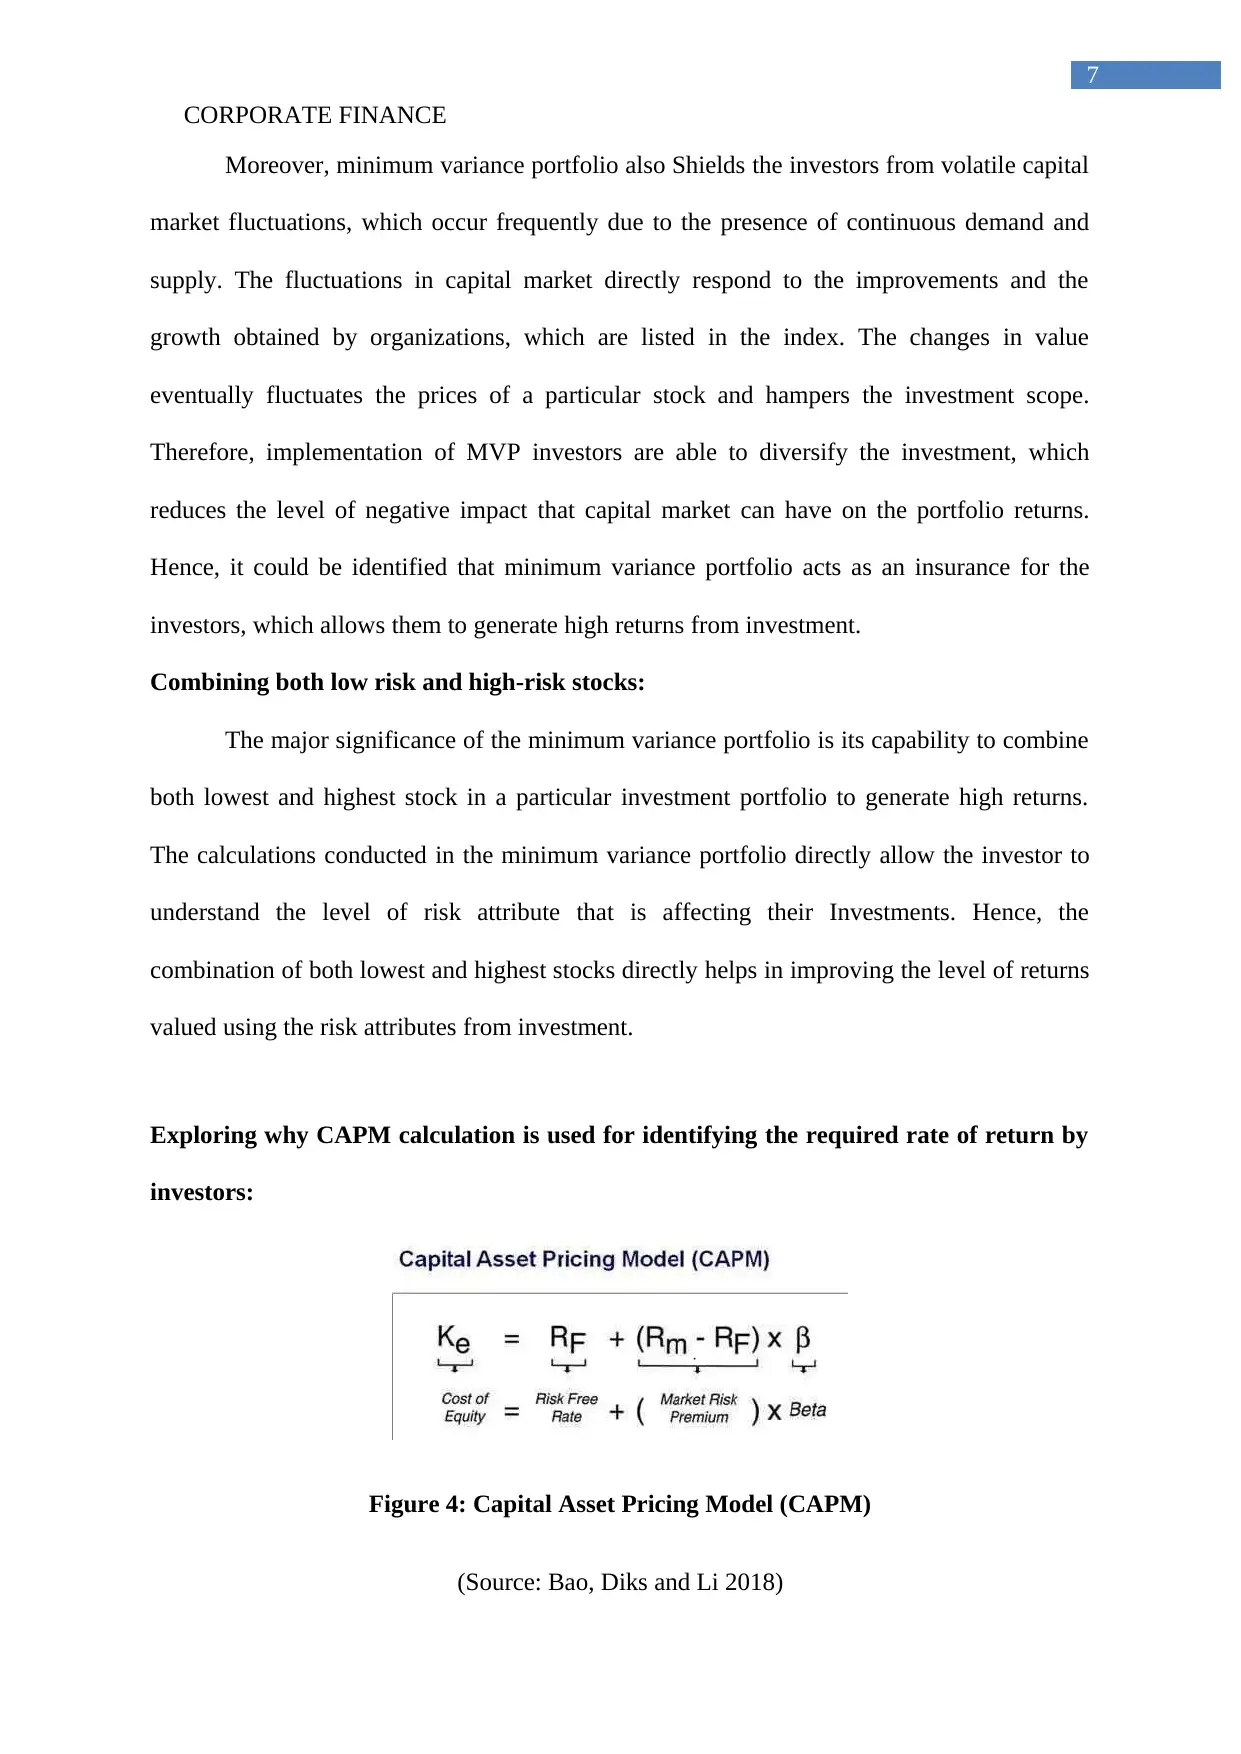
Exploring why CAPM calculation is used for identifying the required rate of return by
investors:
Figure 4: Capital Asset Pricing Model (CAPM)
(Source: Bao, Diks and Li 2018)
7
Moreover, minimum variance portfolio also Shields the investors from volatile capital
market fluctuations, which occur frequently due to the presence of continuous demand and
supply. The fluctuations in capital market directly respond to the improvements and the
growth obtained by organizations, which are listed in the index. The changes in value
eventually fluctuates the prices of a particular stock and hampers the investment scope.
Therefore, implementation of MVP investors are able to diversify the investment, which
reduces the level of negative impact that capital market can have on the portfolio returns.
Hence, it could be identified that minimum variance portfolio acts as an insurance for the
investors, which allows them to generate high returns from investment.
Combining both low risk and high-risk stocks:
The major significance of the minimum variance portfolio is its capability to combine
both lowest and highest stock in a particular investment portfolio to generate high returns.
The calculations conducted in the minimum variance portfolio directly allow the investor to
understand the level of risk attribute that is affecting their Investments. Hence, the
combination of both lowest and highest stocks directly helps in improving the level of returns
valued using the risk attributes from investment.
Exploring why CAPM calculation is used for identifying the required rate of return by
investors:
Figure 4: Capital Asset Pricing Model (CAPM)
(Source: Bao, Diks and Li 2018)
CORPORATE FINANCE
8
The formula for CAPM is adequately depicted in the above figure, which is used by
investors to identify the level of expected returns from and investment. Moreover, the
calculation also depicts that the expected return and the identified as cost of equity for
deriving the overall value of WACC (Weighted Average Cost of Capital) of the organization.
WACC is one of the measures that CAPM allows the investors to identify and detect the level
of investments that needs to be conducted in a particular stock. Furthermore, the assumptions
made by the Capital Asset pricing model such as risk free rate and market premium directly
allows the investor to detect the level of expected returns, which needs to be provided by the
company. On the other hand, Bornholt (2013) argued that CAPM only allows the investor to
analyze only one stock and does not increase its reach in evaluating the whole portfolio.
There are other models which has been used by investors for identifying the return
and risk capability of a particular stock. Model such as Fama French Three Factor Model and
Modified Fama French model are used in the absence of Capital Asset pricing model. These
measures are relatively used for improving enhancing the output result, which is not possible
by the simple Capital Asset pricing model method. However, different theories and methods
used for calculating the expected return needs high-end calculations and statistical data,
which is not used in the simple Capital Asset pricing model. The simplicity of the model
relatively makes it more attractive for investors to analyze the level of risk and return
attributes of a particular stock (Dempsey 2013).
The simplicity relatively makes the Capital Asset pricing model to be one of the
adequate methods, which can be used by investors to understand the expected returns from a
particular stock. However, there are certain advantages and disadvantages towards the use of
Capital Asset pricing model, which can increase or reduce the problems of an investor.
Ease of use (Significance):
⊘ This is a preview!⊘
Do you want full access?
Subscribe today to unlock all pages.
Trusted by 1+ million students worldwide
CORPORATE FINANCE
9
Capital Asset pricing model is an adequate measure, which allows investor to use
three different factors to detect the expected returns from investment. The method is
relatively simple and can be used by investors without the need for statistical calculations.
The simplicity of the Capital Asset pricing model actually appeals to the investors and allows
them to detect the level of returns, which could be generated from a stock at a certain beta.
Wide range of assumptions (Limitations):
However, there are certain limitations to the Capital Asset pricing model, which are is
used by investors while calculating the returns. The calculation adequately assumes the level
of market returns and risk free rate, which is used for calculating the expected return of the
stock. The investors can ignore the identified limitations, as it provides an adequate gist of
the total returns that a stock should provide from investment (Dzaja and Aljinovic 2013).
Conclusion:
The evaluation of minimum variance portfolio, capital market line, security market
line, and Capital Asset pricing model has helped in depicting the level of measures that needs
to be taken by the investors creating their portfolio. Investors to improve their investment
scope and reduce the level of risk from investment relatively use the above-depicted theories.
The difference between security market line and capital market line has illuminated the
significance of an adequate portfolio creation method. The minimum variance portfolio
actually depicts the level of risk attribute an investor can provide while creating a portfolio.
Lastly, the everlasting presence of Capital Asset pricing model has allowed the investors to
analyze the stock for investment and detect the level of returns, which it should provide in
future. Therefore, understanding the level of measures that is considered by the above
theories, it can be detected that formulating an adequate portfolio for investment is a viable
option, which could allow investors to maximize their returns.
Paraphrase This Document
Need a fresh take? Get an instant paraphrase of this document with our AI Paraphraser
CORPORATE FINANCE
10
References and Bibliography:
Bao, T., Diks, C. and Li, H., 2018. A generalized CAPM model with asymmetric power
distributed errors with an application to portfolio construction. Economic Modelling, 68,
pp.611-621.
Björk, T., Murgoci, A. and Zhou, X.Y., 2014. Mean–variance portfolio optimization with
state‐dependent risk aversion. Mathematical Finance: An International Journal of
Mathematics, Statistics and Financial Economics, 24(1), pp.1-24.
Bornholt, G., 2013. The failure of the Capital Asset Pricing Model (CAPM): An update and
discussion. Abacus, 49, pp.36-43.
Brooks, R. and Mukherjee, A.K., 2013. Financial management: core concepts. Pearson.
Christensen, H.B., Hail, L. and Leuz, C., 2016. Capital-market effects of securities
regulation: Prior conditions, implementation, and enforcement. The Review of Financial
Studies, 29(11), pp.2885-2924.
Dempsey, M., 2013. The capital asset pricing model (CAPM): the history of a failed
revolutionary idea in finance?. Abacus, 49, pp.7-23.
Džaja, J. and Aljinović, Z., 2013. Testing CAPM model on the emerging markets of the
Central and Southeastern Europe. Croatian Operational Research Review, 4(1), pp.164-175.
Epstein, L.G. and Zin, S.E., 2013. Substitution, risk aversion and the temporal behavior of
consumption and asset returns: A theoretical framework. In Handbook Of The Fundamentals
Of Financial Decision Making: Part I(pp. 207-239).
Gagliardini, P. and Gouriéroux, C., 2013. Granularity adjustment for risk measures:
Systematic vs unsystematic risks. Int. J. Approx. Reasoning, 54(6), pp.717-747.
CORPORATE FINANCE
11
Horváthová, J. and Mokrišová, M., 2014. Determination of Cost of Equity for Selected
Enterprises of the Energy Industry Applying the CAPM Model and its Comparison with the
Model with Gradual Counting Risk Premium. Journal of Management and Business:
Research and Practice, 6(1), pp.43-54.
Hur, S.K. and Chung, C.Y., 2017. Revisiting CAPM betas in an incomplete market: Evidence
from the Korean stock market. Finance Research Letters, 21, pp.241-248.
Lal, I., Mubeen, M., Hussain, A. and Zubair, M., 2016. An empirical analysis of higher
moment capital asset pricing model for Karachi stock exchange (KSE). Open Journal of
Social Sciences, 4(06), p.53.
Lehutova, K., Krizanova, A. and Kliestik, T., 2013. Quantification of equity and debt capital
costs in the specific conditions of transport enterprises. In 17th International Conference on
Transport Means, Transport Means., Kaunas Univ Technol, Kaunas, Lithuania (pp. 258-
261).
Nasiri, M., Alishah, A.Y., Sayyahmelli, S.A.S. and Karimi, A., 2017. Estimating Expected
Return based on Capital Asset Pricing Model compared with Stock Interest Rate at Tehran
Stock Exchange. HELIX, 7(2), pp.1406-1415.
Xing, X., Hu, J. and Yang, Y., 2014. Robust minimum variance portfolio with L-infinity
constraints. Journal of Banking & Finance, 46, pp.107-117.
Yang, L., Couillet, R. and McKay, M.R., 2015. A robust statistics approach to minimum
variance portfolio optimization. IEEE Transactions on Signal Processing, 63(24), pp.6684-
6697.
⊘ This is a preview!⊘
Do you want full access?
Subscribe today to unlock all pages.
Trusted by 1+ million students worldwide
1 out of 12
Related Documents


Your All-in-One AI-Powered Toolkit for Academic Success.
+13062052269
info@desklib.com
Available 24*7 on WhatsApp / Email
![[object Object]](/_next/static/media/star-bottom.7253800d.svg)
Unlock your academic potential
Copyright © 2020–2026 A2Z Services. All Rights Reserved. Developed and managed by ZUCOL.