Statistics for Business and Finance Assignment - Analysis Report
VerifiedAdded on 2020/05/11
|13
|1441
|182
Homework Assignment
AI Summary
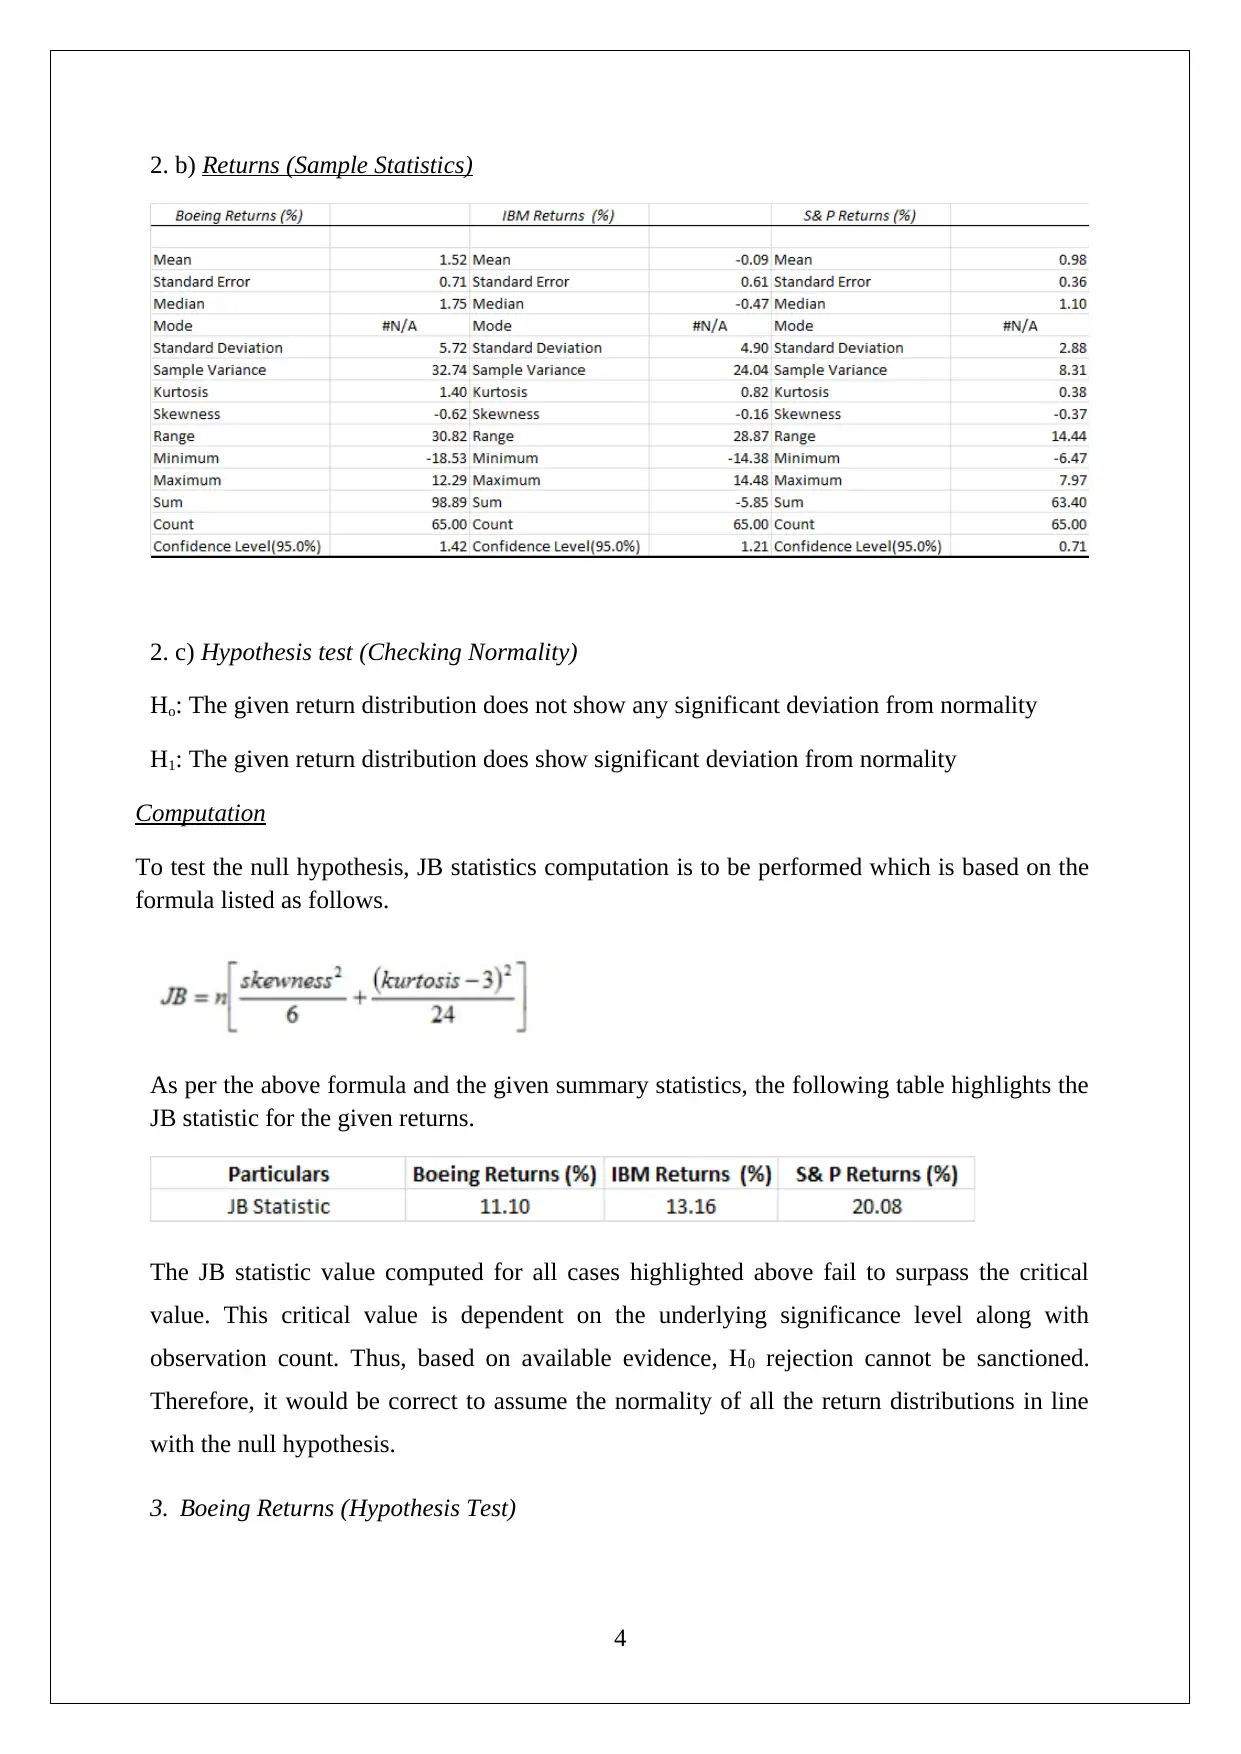
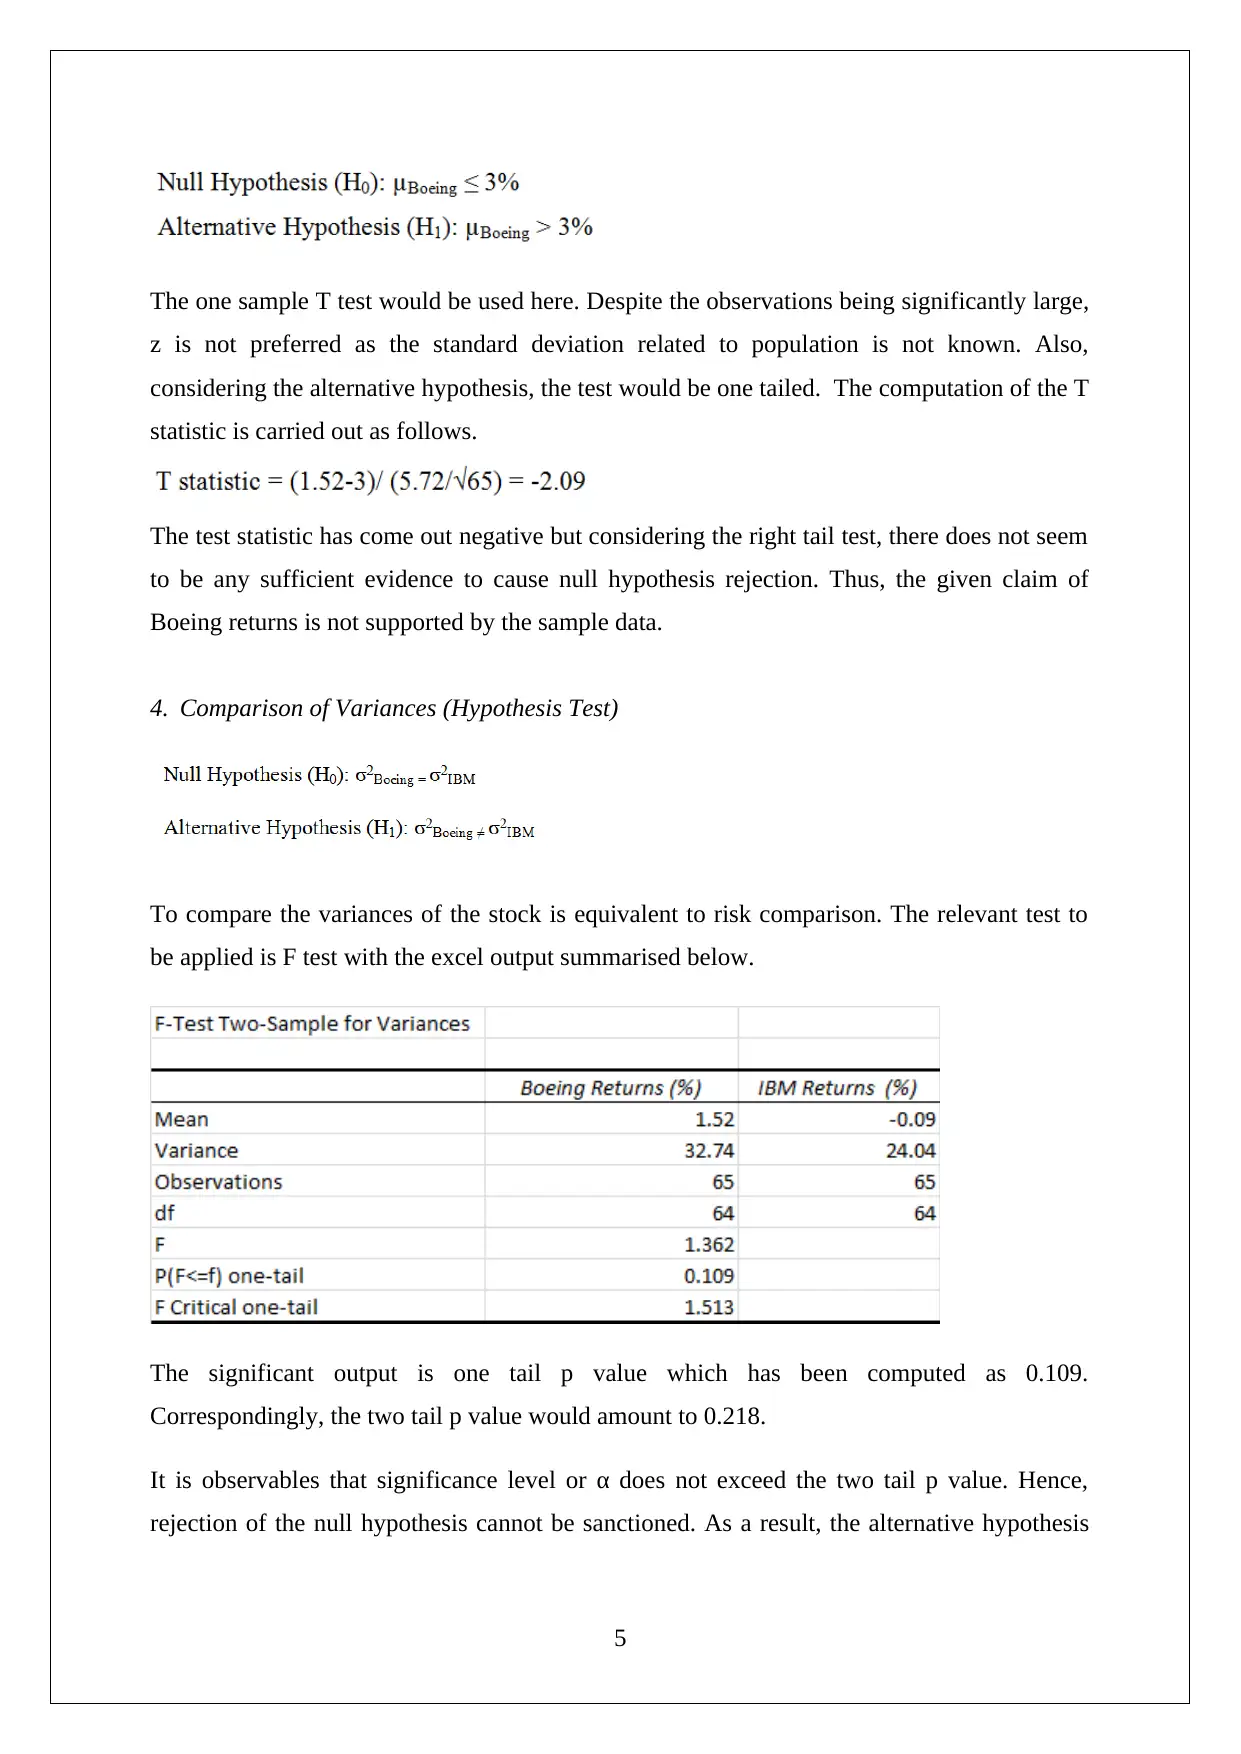
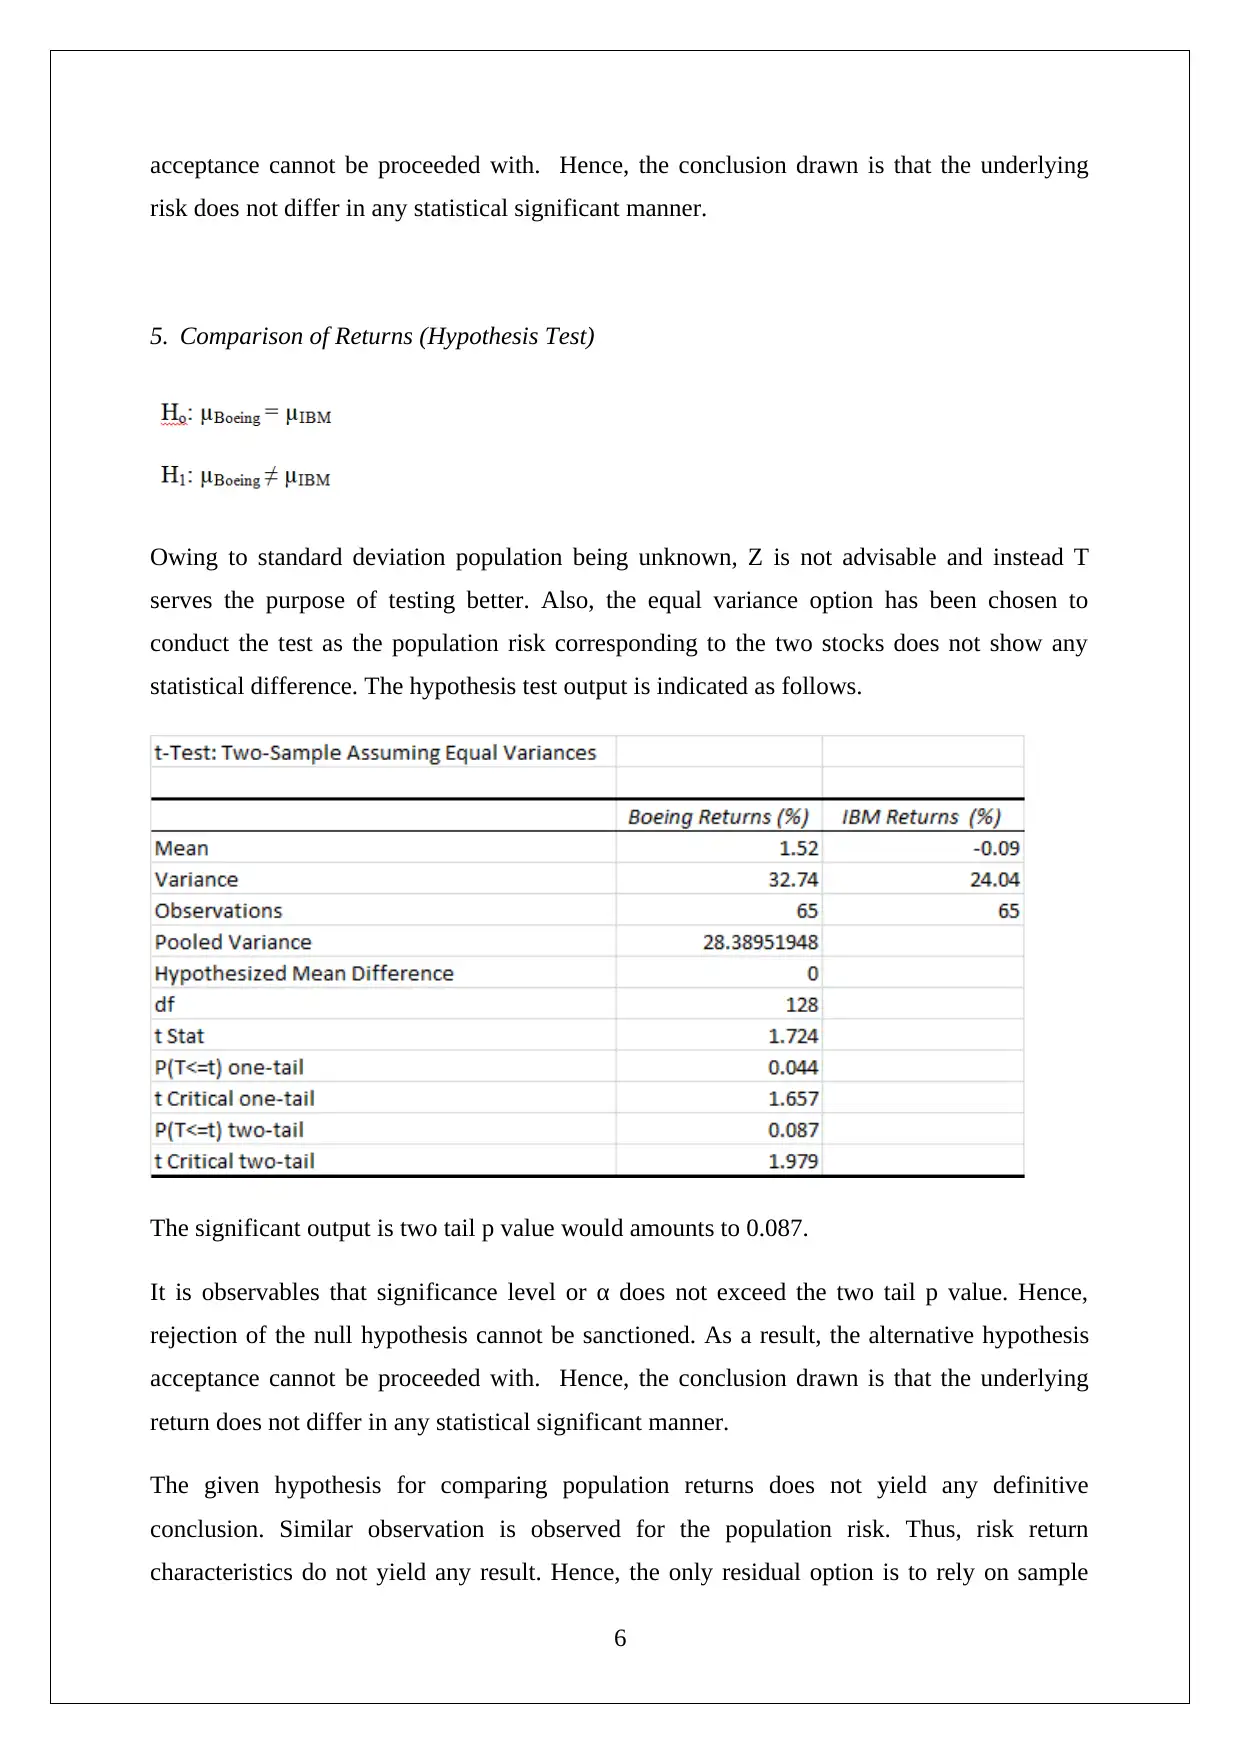
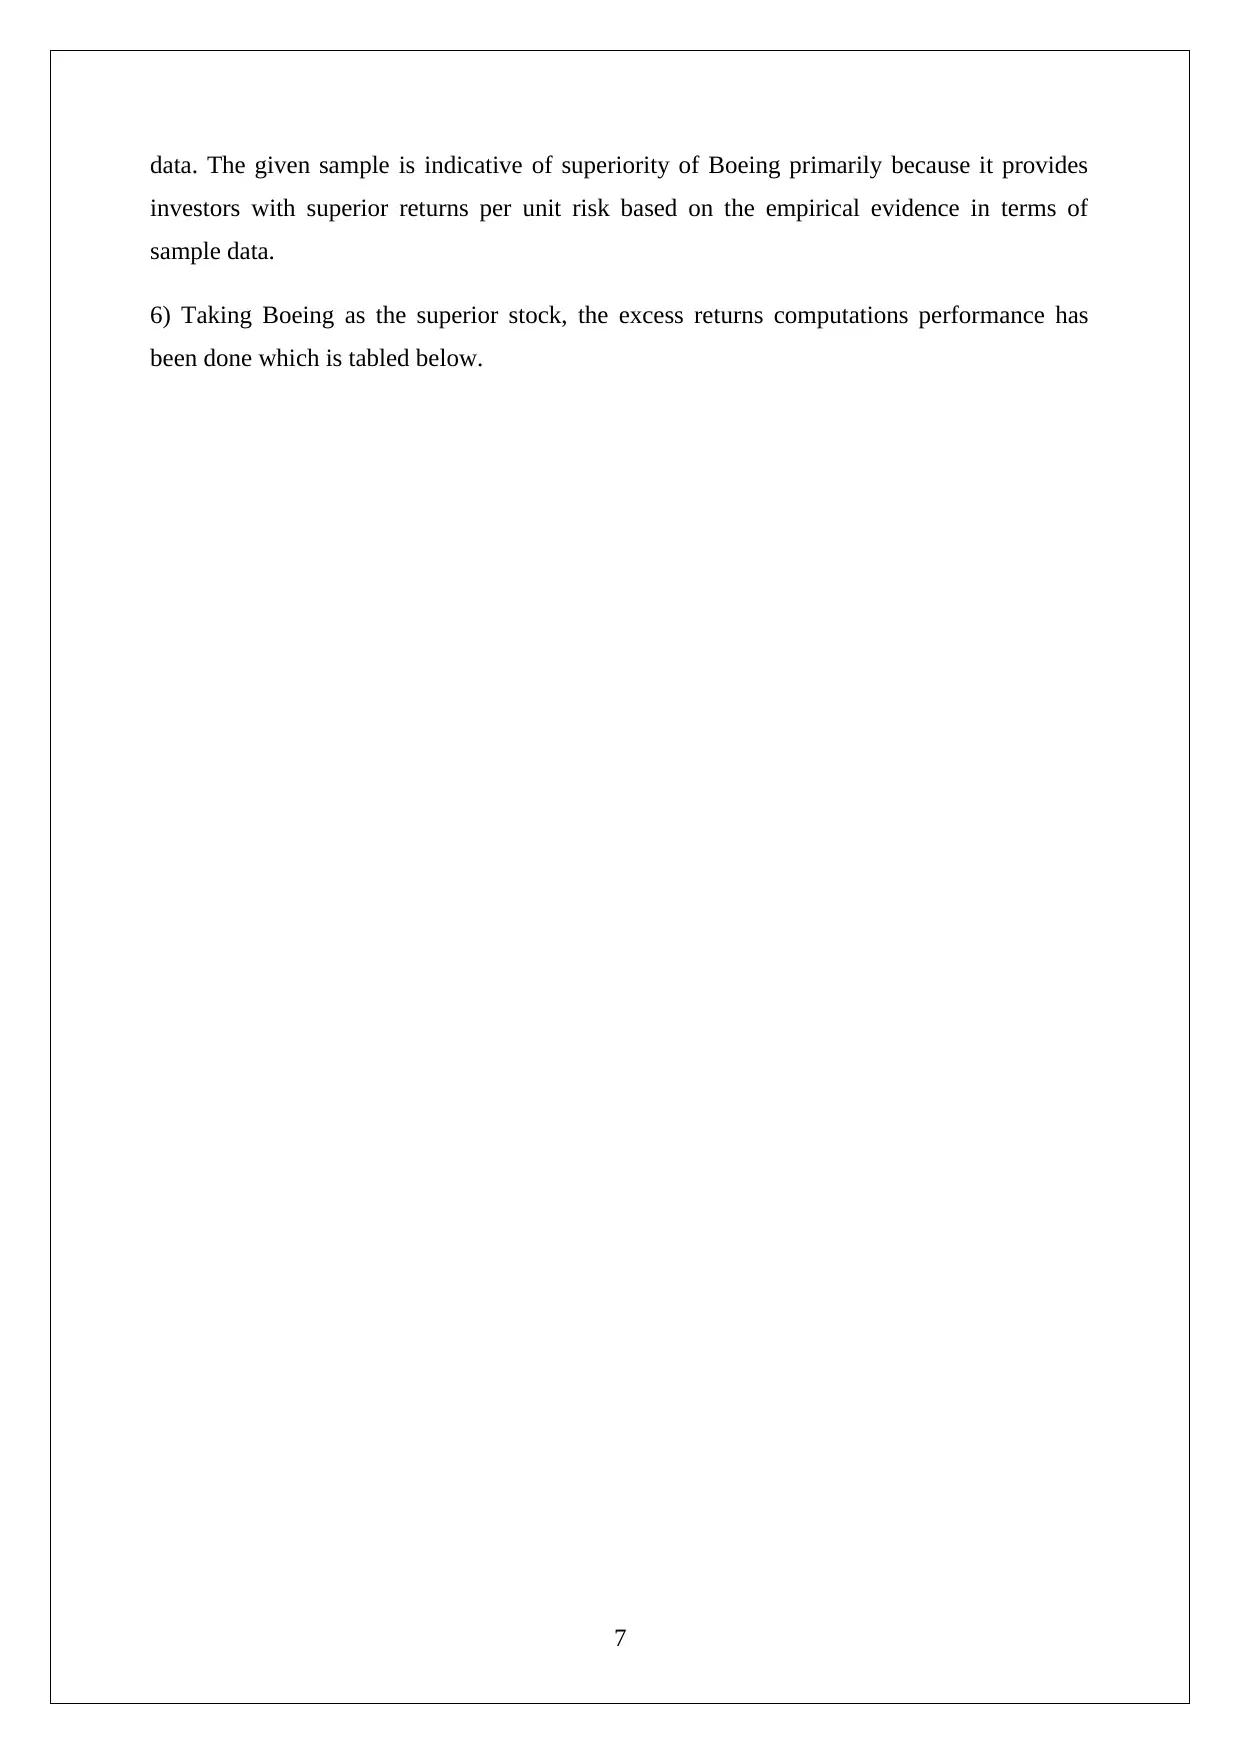
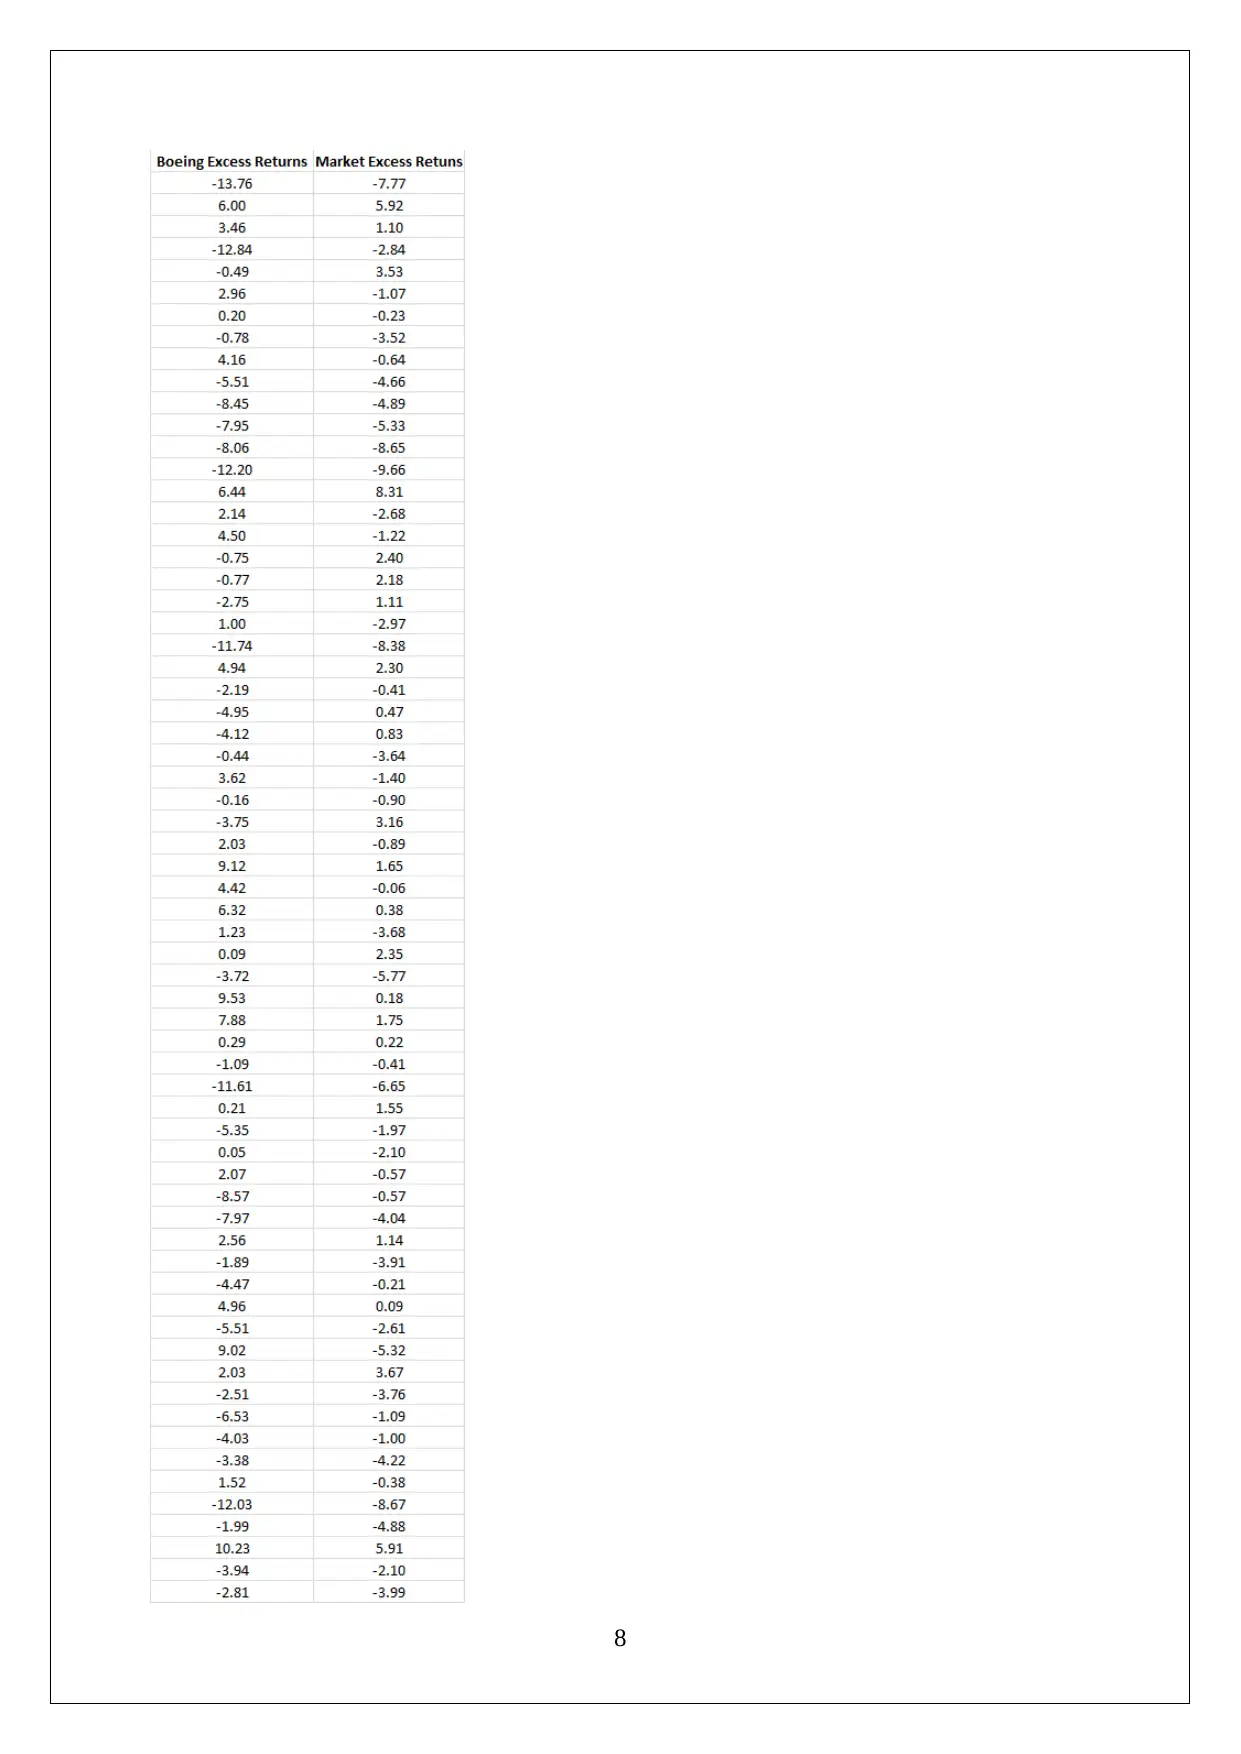
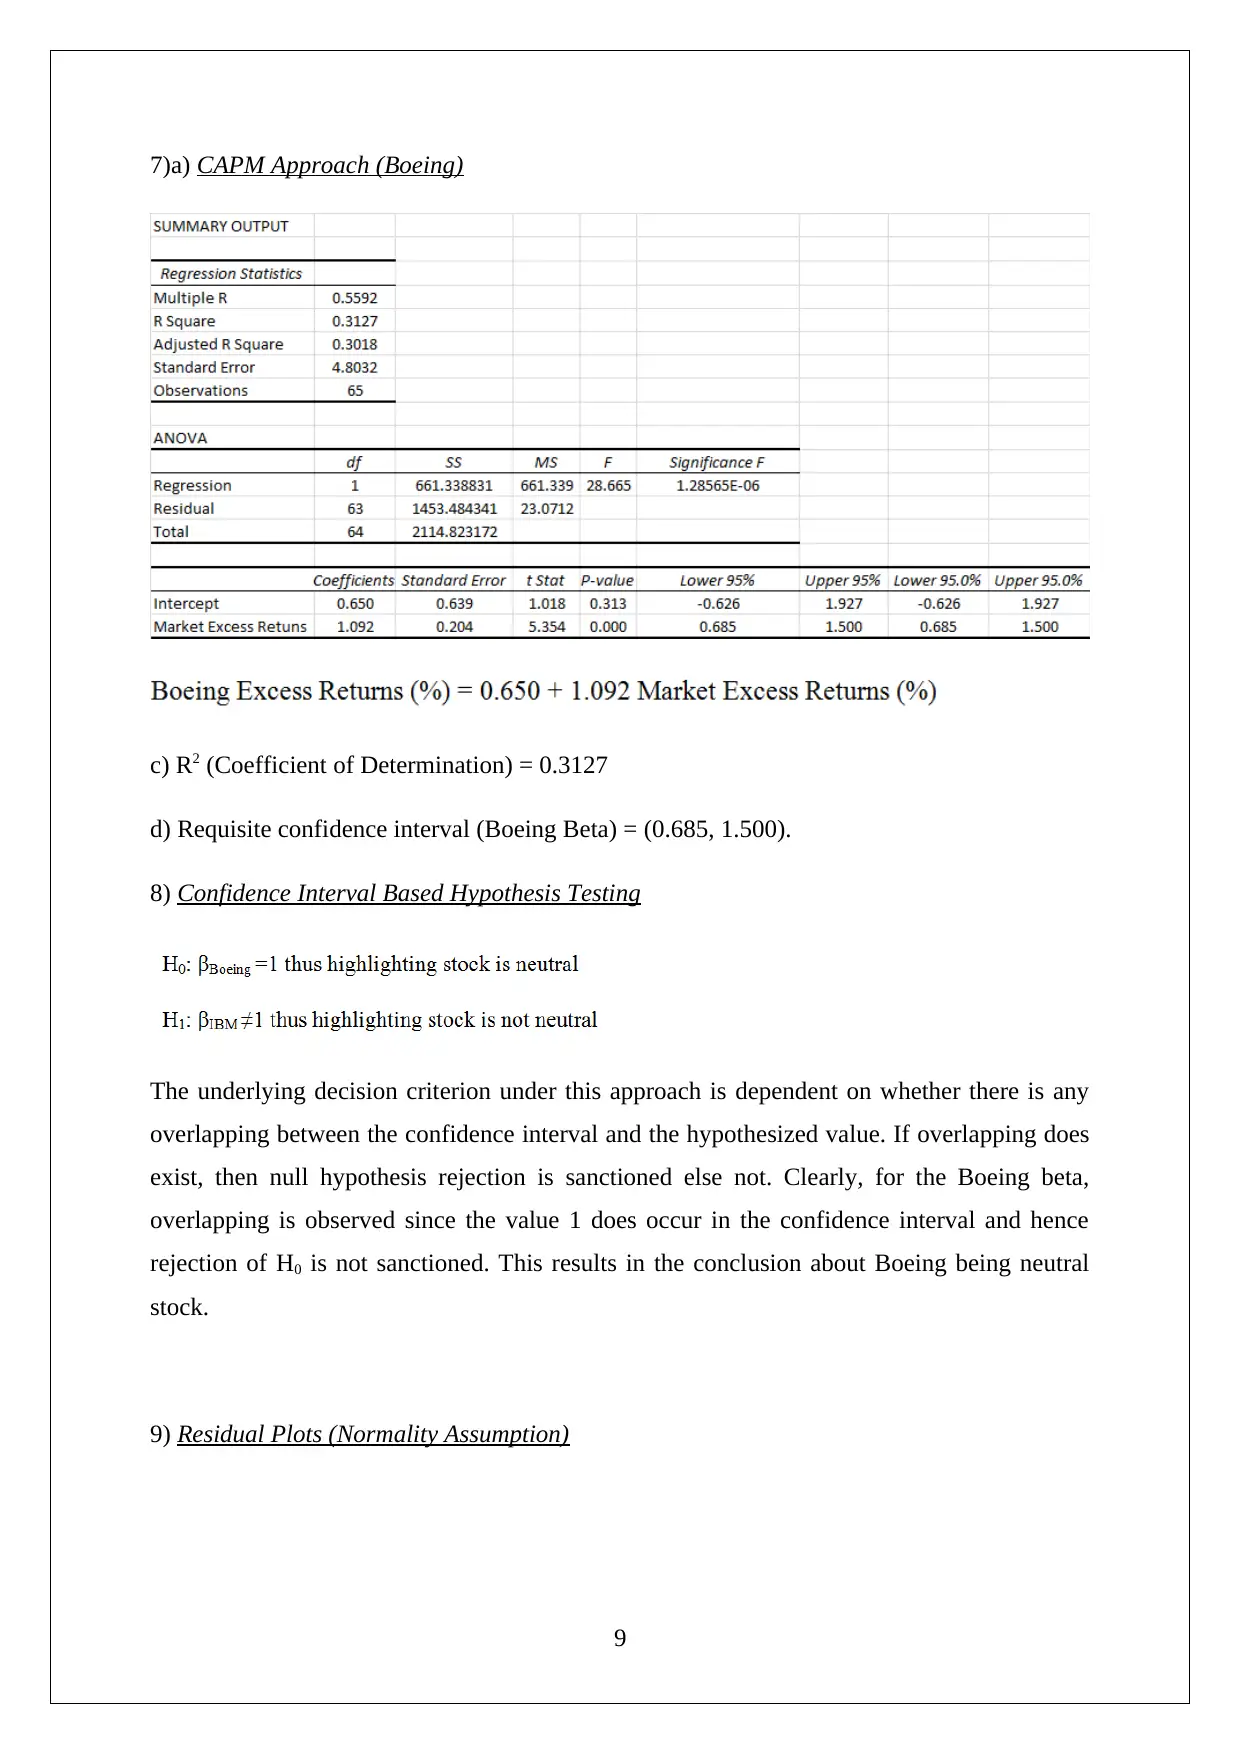
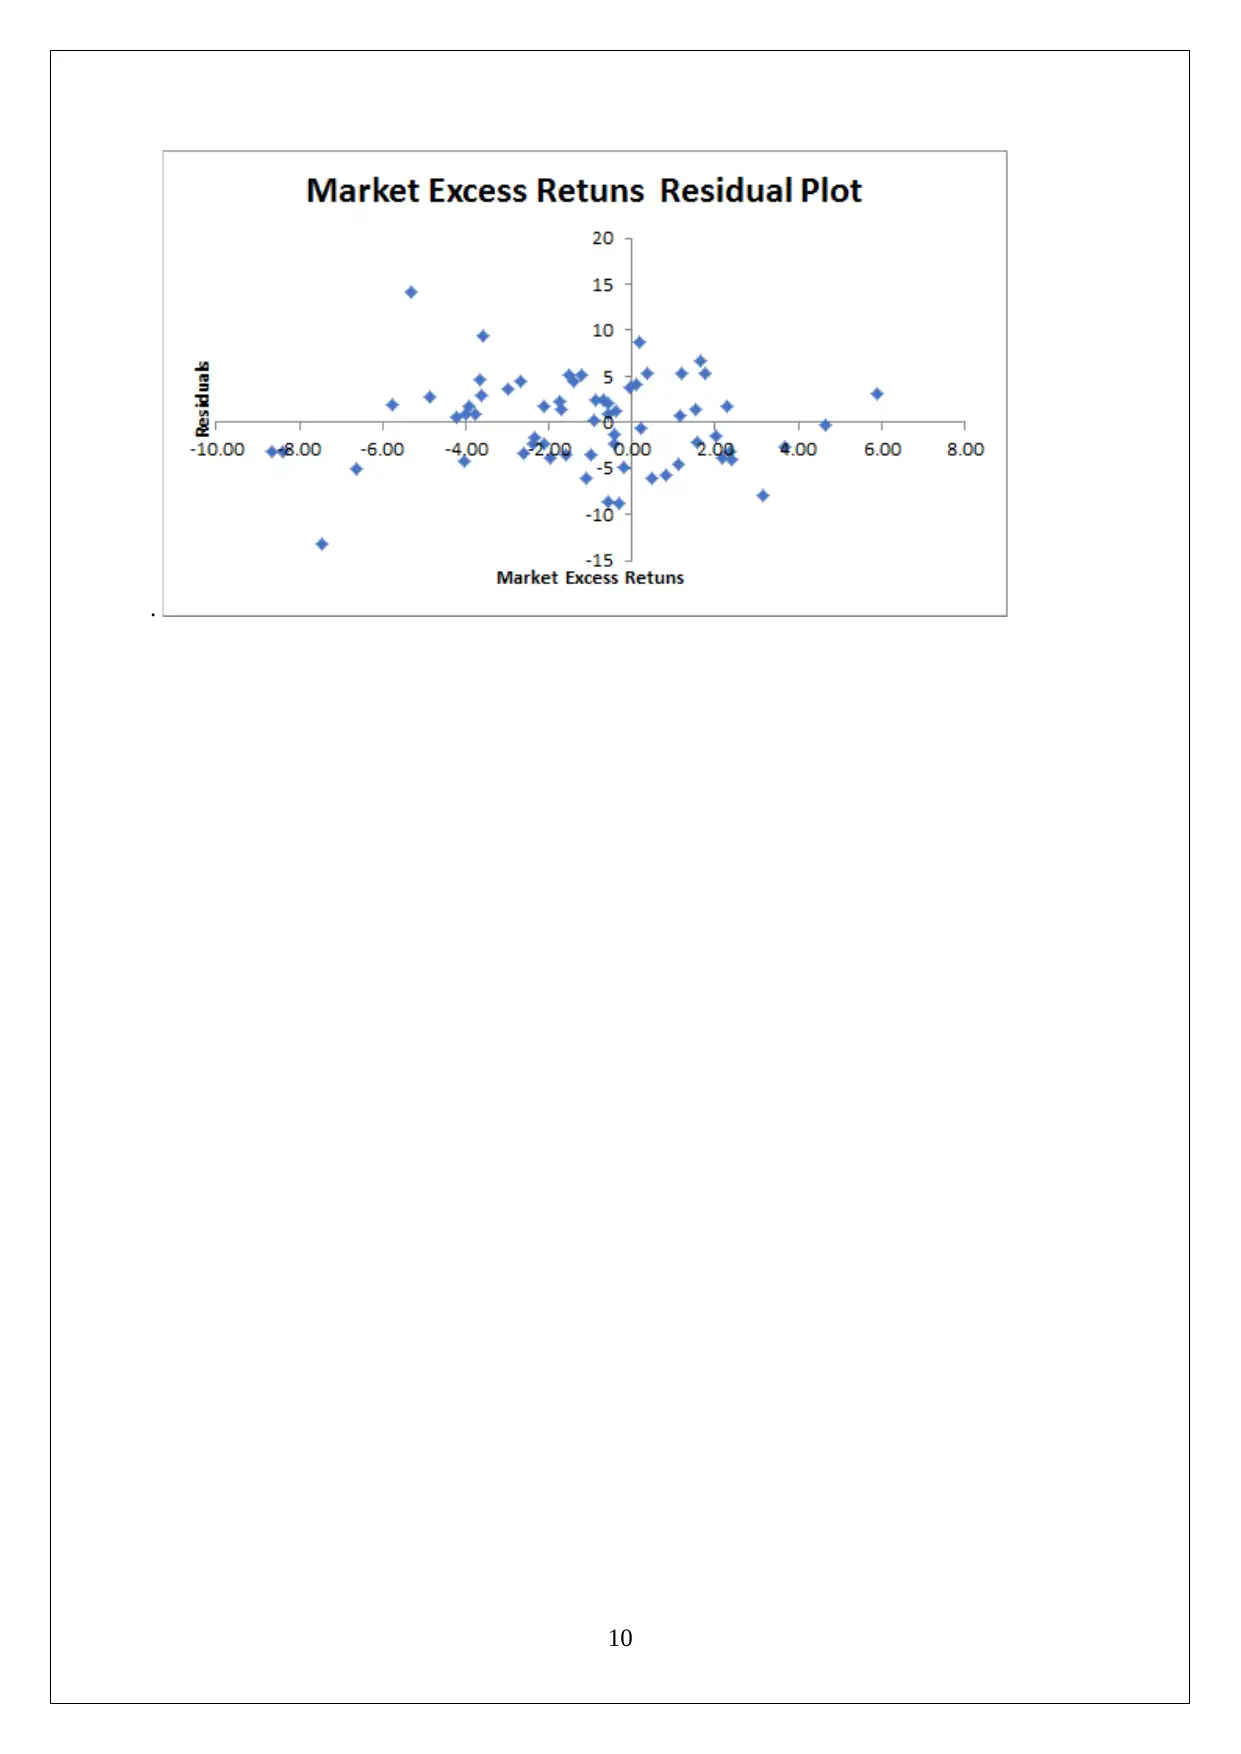
This assignment delves into the application of statistical methods in business and finance, specifically focusing on the analysis of stock data. It includes calculations of monthly gains, sample statistics, and hypothesis tests to check for normality and compare stock variances and returns. The analysis involves the use of the Jarque-Bera statistic, one-sample T-tests, and F-tests to evaluate the performance of Boeing and IBM stocks, along with the S&P 500 index. The assignment also covers the Capital Asset Pricing Model (CAPM) approach to determine Boeing's beta and confidence intervals, as well as residual plots to assess the normality of errors. The interpretation section provides insights into stock price trends and risk-return characteristics, concluding with the superiority of Boeing based on sample data. Furthermore, it highlights the importance of normality testing for hypothesis testing and other inferential statistical techniques.

STATISTICS FOR BUSINESS & FINANCE
[Type the document subtitle]
STUDENT ID
[Pick the date]
[Type the document subtitle]
STUDENT ID
[Pick the date]
Paraphrase This Document
Need a fresh take? Get an instant paraphrase of this document with our AI Paraphraser

PART A: Calculations
1. Graphs (Closing Prices)
1
1. Graphs (Closing Prices)
1

2. a) The formula for computation of monthly gains has been provided and the same has
been applied on the above prices so as to compute the monthly gains for the stocks and
index as highlighted below.
2
been applied on the above prices so as to compute the monthly gains for the stocks and
index as highlighted below.
2
⊘ This is a preview!⊘
Do you want full access?
Subscribe today to unlock all pages.

Trusted by 1+ million students worldwide

3
Paraphrase This Document
Need a fresh take? Get an instant paraphrase of this document with our AI Paraphraser

2. b) Returns (Sample Statistics)
2. c) Hypothesis test (Checking Normality)
Ho: The given return distribution does not show any significant deviation from normality
H1: The given return distribution does show significant deviation from normality
Computation
To test the null hypothesis, JB statistics computation is to be performed which is based on the
formula listed as follows.
As per the above formula and the given summary statistics, the following table highlights the
JB statistic for the given returns.
The JB statistic value computed for all cases highlighted above fail to surpass the critical
value. This critical value is dependent on the underlying significance level along with
observation count. Thus, based on available evidence, H0 rejection cannot be sanctioned.
Therefore, it would be correct to assume the normality of all the return distributions in line
with the null hypothesis.
3. Boeing Returns (Hypothesis Test)
4

The one sample T test would be used here. Despite the observations being significantly large,
z is not preferred as the standard deviation related to population is not known. Also,
considering the alternative hypothesis, the test would be one tailed. The computation of the T
statistic is carried out as follows.
The test statistic has come out negative but considering the right tail test, there does not seem
to be any sufficient evidence to cause null hypothesis rejection. Thus, the given claim of
Boeing returns is not supported by the sample data.
4. Comparison of Variances (Hypothesis Test)
To compare the variances of the stock is equivalent to risk comparison. The relevant test to
be applied is F test with the excel output summarised below.
The significant output is one tail p value which has been computed as 0.109.
Correspondingly, the two tail p value would amount to 0.218.
It is observables that significance level or α does not exceed the two tail p value. Hence,
rejection of the null hypothesis cannot be sanctioned. As a result, the alternative hypothesis
5
⊘ This is a preview!⊘
Do you want full access?
Subscribe today to unlock all pages.

Trusted by 1+ million students worldwide

acceptance cannot be proceeded with. Hence, the conclusion drawn is that the underlying
risk does not differ in any statistical significant manner.
5. Comparison of Returns (Hypothesis Test)
Owing to standard deviation population being unknown, Z is not advisable and instead T
serves the purpose of testing better. Also, the equal variance option has been chosen to
conduct the test as the population risk corresponding to the two stocks does not show any
statistical difference. The hypothesis test output is indicated as follows.
The significant output is two tail p value would amounts to 0.087.
It is observables that significance level or α does not exceed the two tail p value. Hence,
rejection of the null hypothesis cannot be sanctioned. As a result, the alternative hypothesis
acceptance cannot be proceeded with. Hence, the conclusion drawn is that the underlying
return does not differ in any statistical significant manner.
The given hypothesis for comparing population returns does not yield any definitive
conclusion. Similar observation is observed for the population risk. Thus, risk return
characteristics do not yield any result. Hence, the only residual option is to rely on sample
6
Paraphrase This Document
Need a fresh take? Get an instant paraphrase of this document with our AI Paraphraser

data. The given sample is indicative of superiority of Boeing primarily because it provides
investors with superior returns per unit risk based on the empirical evidence in terms of
sample data.
6) Taking Boeing as the superior stock, the excess returns computations performance has
been done which is tabled below.
7
investors with superior returns per unit risk based on the empirical evidence in terms of
sample data.
6) Taking Boeing as the superior stock, the excess returns computations performance has
been done which is tabled below.
7

8
⊘ This is a preview!⊘
Do you want full access?
Subscribe today to unlock all pages.

Trusted by 1+ million students worldwide

7)a) CAPM Approach (Boeing)
c) R2 (Coefficient of Determination) = 0.3127
d) Requisite confidence interval (Boeing Beta) = (0.685, 1.500).
8) Confidence Interval Based Hypothesis Testing
The underlying decision criterion under this approach is dependent on whether there is any
overlapping between the confidence interval and the hypothesized value. If overlapping does
exist, then null hypothesis rejection is sanctioned else not. Clearly, for the Boeing beta,
overlapping is observed since the value 1 does occur in the confidence interval and hence
rejection of H0 is not sanctioned. This results in the conclusion about Boeing being neutral
stock.
9) Residual Plots (Normality Assumption)
9
Paraphrase This Document
Need a fresh take? Get an instant paraphrase of this document with our AI Paraphraser

.
10
10

Part B: Interpretation
1) Boeing Stock – From the beginning to February 2013, the stock remained caught in a
limited price range. But, this changed when in March 2013, there was a breakout which
led the stock to assume a value of $ 140 during next one year. After a brief consolidation
period, the stock has commenced the upward journey in June 2016 to reach $ 180 levels.
IBM Stock – For the initial two years, a movement of stock within a limited price range
was observed. However, a downtrend was then witnessed which by February 2016 took
the stock to below the 150 level. But in the next one year, there was a trend reversal and
some of the losses have been recovered.
S&P 500 – During the complete assessment period, the index has been on a uptrend as it
has increased from 1250 level to more than 2250 by the end of the period. Limited
correction has been observed in 2015 and 2016.
2) b) The stock with the higher risk would essentially have a higher standard deviation and
hence it is Boeing. But, a positive aspect of Boeing is that it tends to deliver a superior
return when compared with IBM stock. Infact for the consideration period IBM has a
negative average returns and the S&P 500 index has significantly outperformed the IBM
stock.
c) The test for normality has wide applications particularly related to testing of hypothesis
along with application of other inferential statistics techniques. For these, the underlying
distribution of the sample is a critical input as the various tests are based on certain
assumptions with normality being one of the basic ones. Hence, normality testing ensures
that appropriate testing techniques are used for deriving conclusions.
5) The superiority of Boeing has already been established on the basis of the sample data.
This is because the hypothesis testing did not lead to any conclusion. Hence, the risk per unit
return was computed which was found to be lesser in magnitude for Boeing which led to
establishment of investor preference for this stock.
.
11
⊘ This is a preview!⊘
Do you want full access?
Subscribe today to unlock all pages.

Trusted by 1+ million students worldwide
1 out of 13
Related Documents

Your All-in-One AI-Powered Toolkit for Academic Success.
+13062052269
info@desklib.com
Available 24*7 on WhatsApp / Email
Unlock your academic potential
Copyright © 2020–2025 A2Z Services. All Rights Reserved. Developed and managed by ZUCOL.