Finance Statistics Report: API Share Price Trend Analysis (2012-2017)
VerifiedAdded on 2023/06/14
|6
|1242
|143
Report
AI Summary
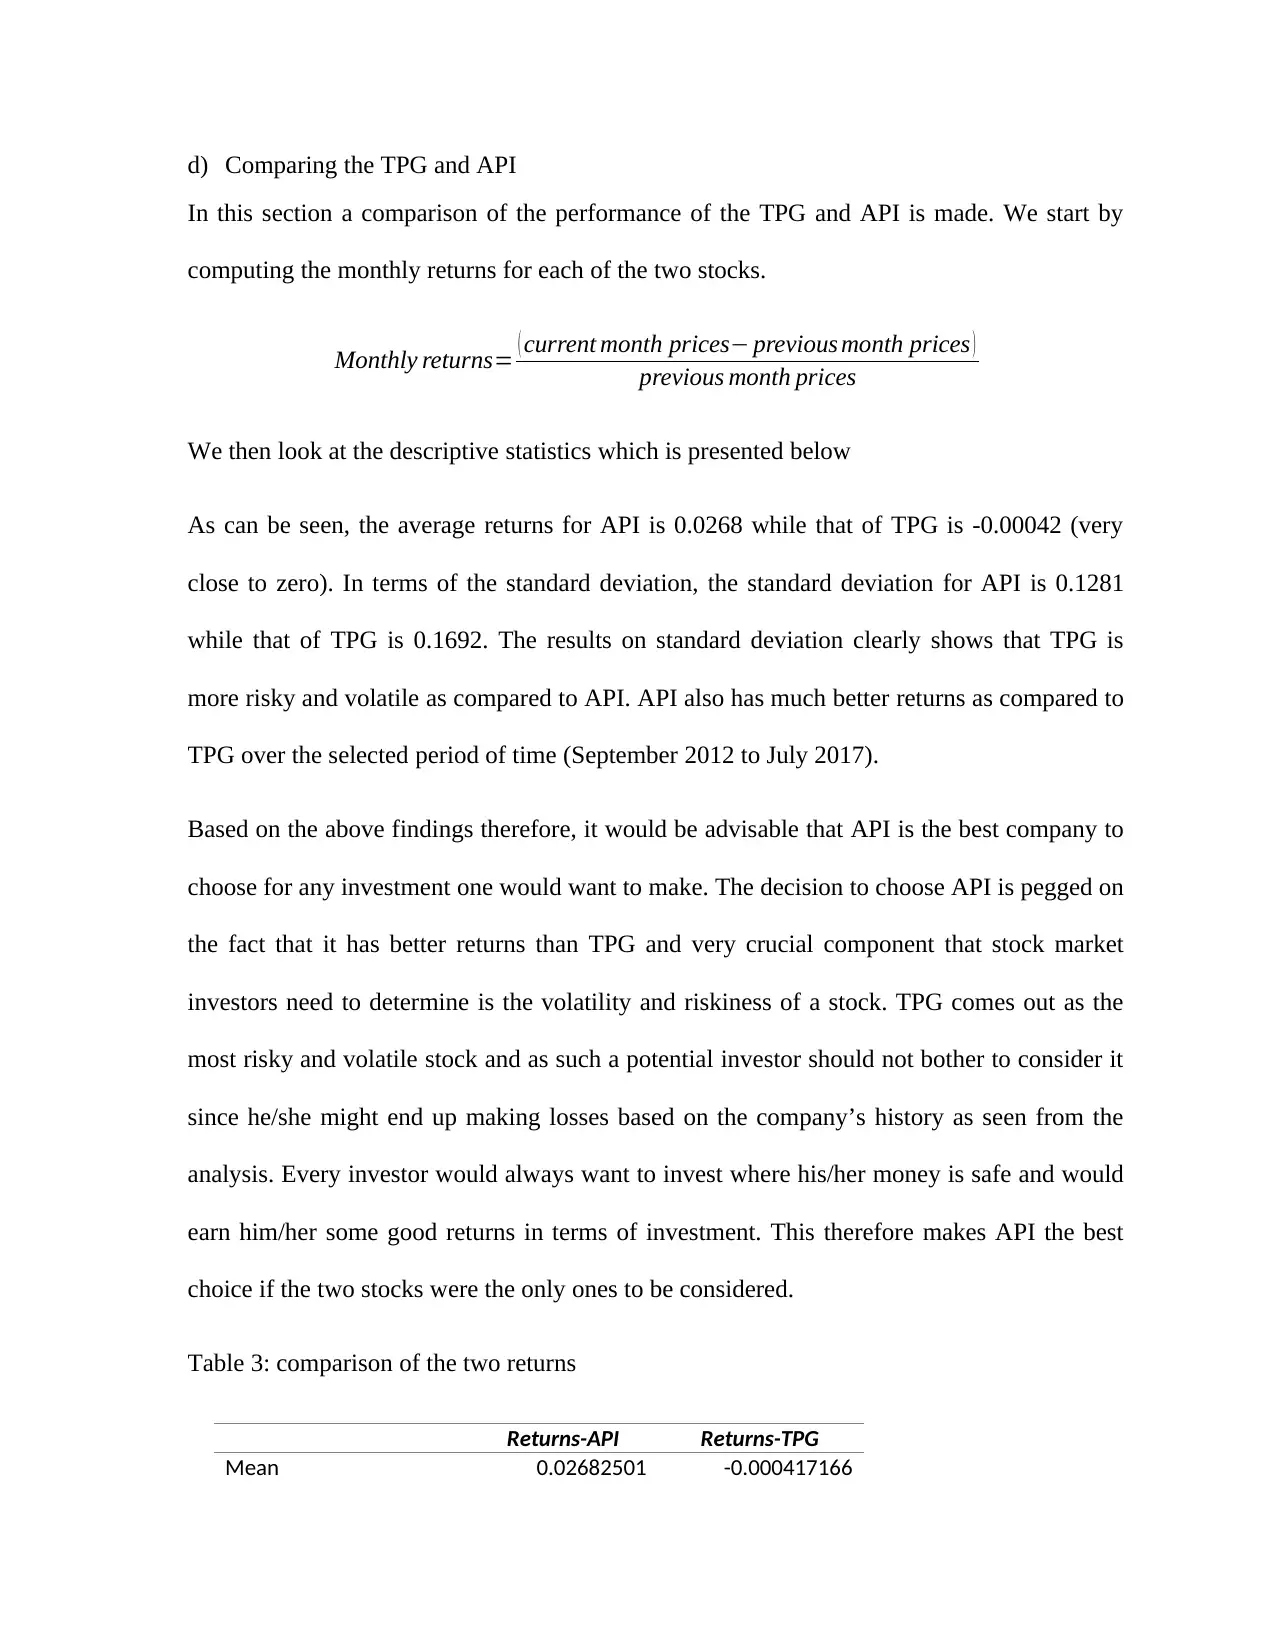
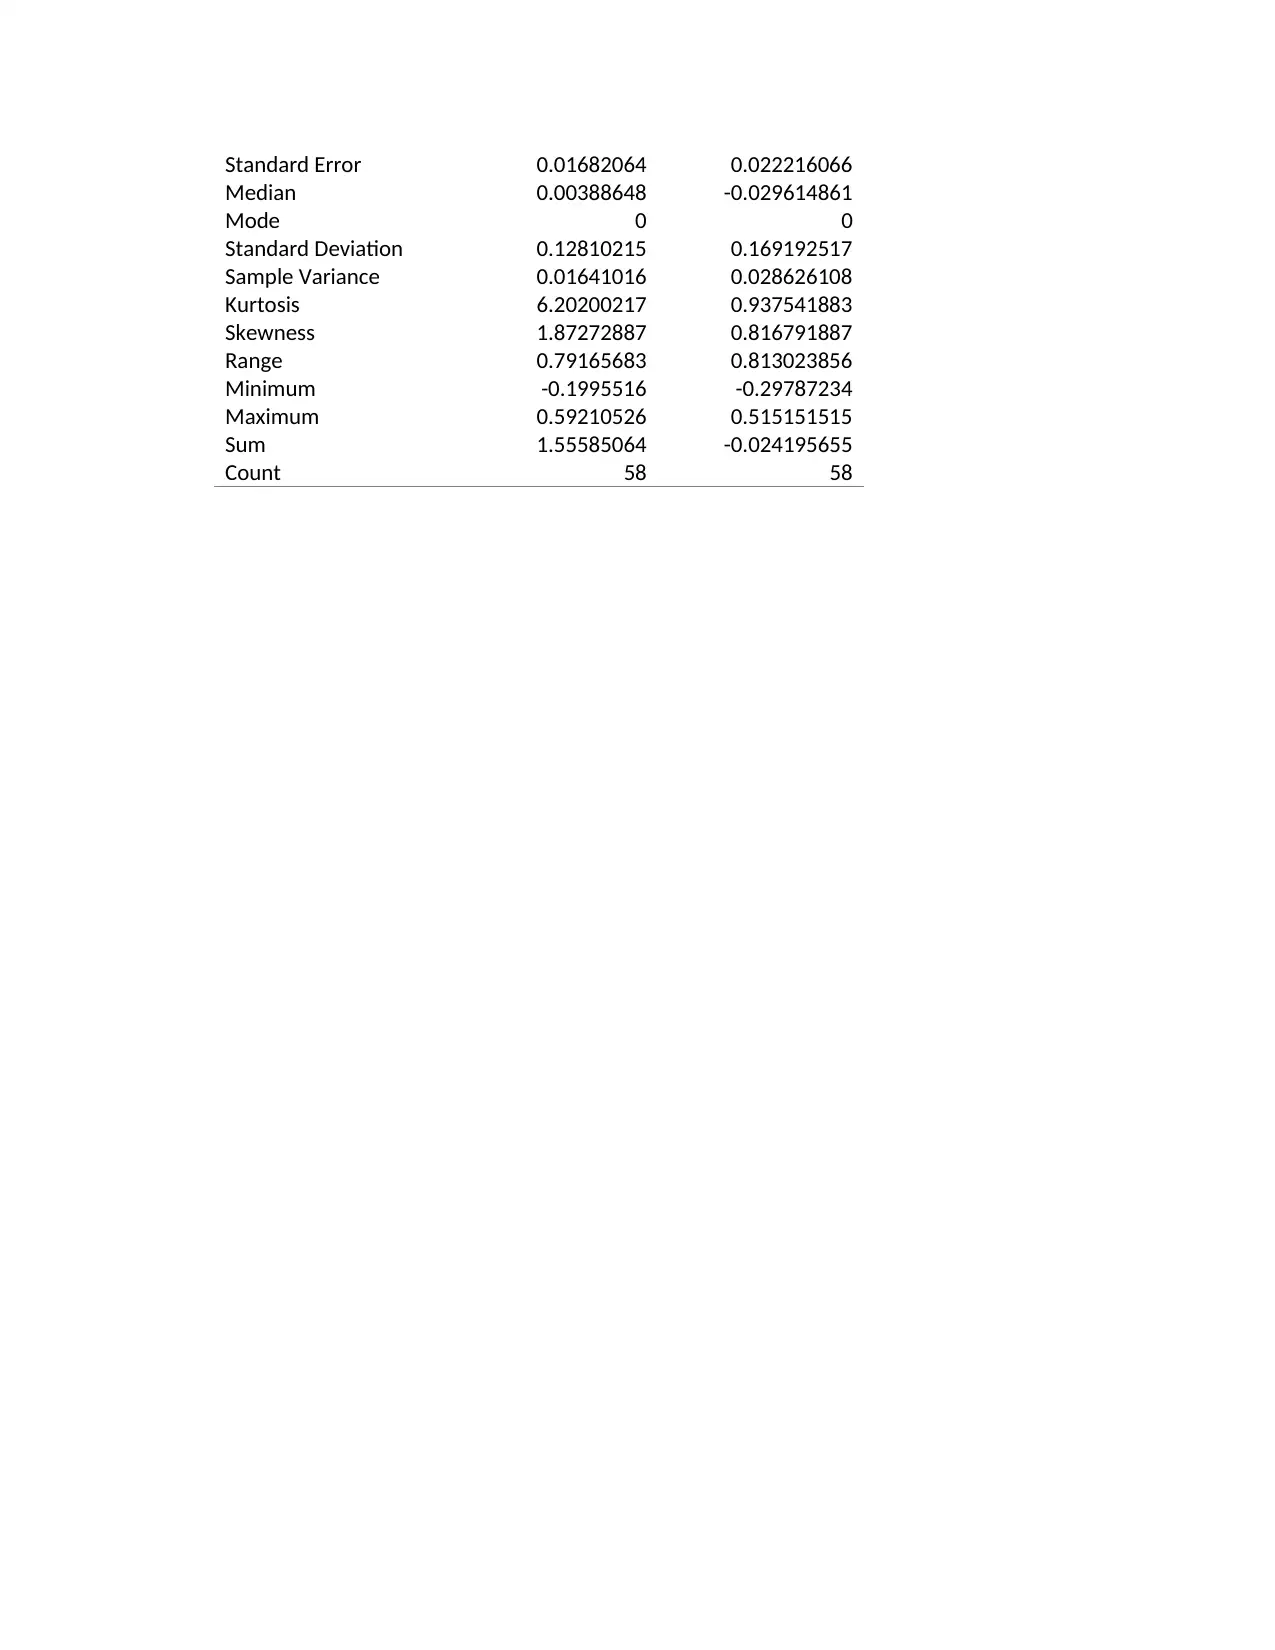
This report analyzes the share price trends of Australian Pharmaceutical (API) from September 2012 to July 2017, utilizing finance statistics to understand the company's performance. The analysis includes descriptive statistics such as mean, median, mode, standard deviation, and range of the share pri...

Finance statistics
Name:
Institution:
27th March 2018
Name:
Institution:
27th March 2018
Paraphrase This Document
Need a fresh take? Get an instant paraphrase of this document with our AI Paraphraser

Question 8
We chose to look at the shares of Australian Pharmaceutical (API). A period of 59 months was
considered spanning from September 2012 to July 2017. The aim is to try to understand the trend
analysis of this company for the selected period which has 59 observations (59 monthly share
prices listed).
The following is the dataset;
Table 1: Data
Date Peri
od
Clos
e
xy x^2 y^2 Date Peri
od
Clos
e
xy x^2 y^2
9/30/201
2
1 0.47 0.47 1 0.2209 3/31/201
5
31 1.67
5
51.925 961 2.8056
25
10/31/20
12
2 0.46
5
0.93 4 0.2162
25
4/30/201
5
32 1.79
5
57.44 1024 3.2220
25
11/30/20
12
3 0.47 1.41 9 0.2209 5/31/201
5
33 1.5 49.5 1089 2.25
12/31/20
12
4 0.45
5
1.82 16 0.2070
25
6/30/201
5
34 1.59 54.06 1156 2.5281
1/31/201
3
5 0.43
5
2.175 25 0.1892
25
7/31/201
5
35 1.62
5
56.875 1225 2.6406
25
2/28/201
3
6 0.44 2.64 36 0.1936 8/31/201
5
36 1.51
5
54.54 1296 2.2952
25
3/31/201
3
7 0.48
5
3.395 49 0.2352
25
9/30/201
5
37 1.98 73.26 1369 3.9204
4/30/201
3
8 0.45 3.6 64 0.2025 10/31/20
15
38 2.05 77.9 1444 4.2025
5/31/201
3
9 0.44
5
4.005 81 0.1980
25
11/30/20
15
39 1.93 75.27 1521 3.7249
6/30/201
3
10 0.44
5
4.45 100 0.1980
25
12/31/20
15
40 2.09 83.6 1600 4.3681
7/31/201
3
11 0.48
5
5.335 121 0.2352
25
1/31/201
6
41 1.94
5
79.745 1681 3.7830
25
8/31/201
3
12 0.48 5.76 144 0.2304 2/29/201
6
42 1.95
5
82.11 1764 3.8220
25
9/30/201
3
13 0.64
5
8.385 169 0.4160
25
3/31/201
6
43 1.96 84.28 1849 3.8416
10/31/20
13
14 0.61 8.54 196 0.3721 4/30/201
6
44 1.86
5
82.06 1936 3.4782
25
11/30/20
13
15 0.6 9 225 0.36 5/31/201
6
45 1.68 75.6 2025 2.8224
12/31/20
13
16 0.59
5
9.52 256 0.3540
25
6/30/201
6
46 1.92 88.32 2116 3.6864
1/31/201
4
17 0.59
5
10.115 289 0.3540
25
7/31/201
6
47 1.77
5
83.425 2209 3.1506
25
2/28/201
4
18 0.56
5
10.17 324 0.3192
25
8/31/201
6
48 1.93 92.64 2304 3.7249
3/31/201
4
19 0.58 11.02 361 0.3364 9/30/201
6
49 1.9 93.1 2401 3.61

4/30/201
4
20 0.51
5
10.3 400 0.2652
25
10/31/20
16
50 1.90
5
95.25 2500 3.6290
25
5/31/201
4
21 0.59 12.39 441 0.3481 11/30/20
16
51 2.06 105.06 2601 4.2436
6/30/201
4
22 0.6 13.2 484 0.36 12/31/20
16
52 1.88
5
98.02 2704 3.5532
25
7/31/201
4
23 0.58
5
13.455 529 0.3422
25
1/31/201
7
53 1.9 100.7 2809 3.61
8/31/201
4
24 0.67
5
16.2 576 0.4556
25
2/28/201
7
54 2.04 110.16 2916 4.1616
9/30/201
4
25 0.80
5
20.125 625 0.6480
25
3/31/201
7
55 2.23 122.65 3025 4.9729
10/31/20
14
26 0.84 21.84 676 0.7056 4/30/201
7
56 1.78
5
99.96 3136 3.1862
25
11/30/20
14
27 0.86 23.22 729 0.7396 5/31/201
7
57 1.90
5
108.58
5
3249 3.6290
25
12/31/20
14
28 0.91 25.48 784 0.8281 6/30/201
7
58 1.75
5
101.79 3364 3.0800
25
1/31/201
5
29 1.14 33.06 841 1.2996 7/31/201
7
59 1.46
5
86.435 3481 2.1462
25
2/28/201
5
30 1.81
5
54.45 900 3.2942
25
Descriptive statistics of the data
In this section, we present the summary statistics for the data which include the mean, median
standard deviation, mode of the data, range, maximum and minimum share prices among others.
Table 2: Descriptive statistics
As can be seen in table 1 above, the average
closing prices for the Australian Pharmaceutical
(API) was found to be 1.2315 with a median price
of 1.465 over a period of 59 months. The most
common price (mode) was found to be 0.47 while
the stock had a standard deviation of 0.6559
indicating a less widely data. The maximum price over the period was found to be 2.23 while the
lowest price was 0.435.
a) The least squares equation
Close
Mean 1.231525
Standard Error 0.08539
Median 1.465
Mode 0.47
Standard Deviation 0.655893
Sample Variance 0.430195
Kurtosis -1.83799
Skewness -0.00509
Range 1.795
Minimum 0.435
Maximum 2.23
Sum 72.66
Count 59
4
20 0.51
5
10.3 400 0.2652
25
10/31/20
16
50 1.90
5
95.25 2500 3.6290
25
5/31/201
4
21 0.59 12.39 441 0.3481 11/30/20
16
51 2.06 105.06 2601 4.2436
6/30/201
4
22 0.6 13.2 484 0.36 12/31/20
16
52 1.88
5
98.02 2704 3.5532
25
7/31/201
4
23 0.58
5
13.455 529 0.3422
25
1/31/201
7
53 1.9 100.7 2809 3.61
8/31/201
4
24 0.67
5
16.2 576 0.4556
25
2/28/201
7
54 2.04 110.16 2916 4.1616
9/30/201
4
25 0.80
5
20.125 625 0.6480
25
3/31/201
7
55 2.23 122.65 3025 4.9729
10/31/20
14
26 0.84 21.84 676 0.7056 4/30/201
7
56 1.78
5
99.96 3136 3.1862
25
11/30/20
14
27 0.86 23.22 729 0.7396 5/31/201
7
57 1.90
5
108.58
5
3249 3.6290
25
12/31/20
14
28 0.91 25.48 784 0.8281 6/30/201
7
58 1.75
5
101.79 3364 3.0800
25
1/31/201
5
29 1.14 33.06 841 1.2996 7/31/201
7
59 1.46
5
86.435 3481 2.1462
25
2/28/201
5
30 1.81
5
54.45 900 3.2942
25
Descriptive statistics of the data
In this section, we present the summary statistics for the data which include the mean, median
standard deviation, mode of the data, range, maximum and minimum share prices among others.
Table 2: Descriptive statistics
As can be seen in table 1 above, the average
closing prices for the Australian Pharmaceutical
(API) was found to be 1.2315 with a median price
of 1.465 over a period of 59 months. The most
common price (mode) was found to be 0.47 while
the stock had a standard deviation of 0.6559
indicating a less widely data. The maximum price over the period was found to be 2.23 while the
lowest price was 0.435.
a) The least squares equation
Close
Mean 1.231525
Standard Error 0.08539
Median 1.465
Mode 0.47
Standard Deviation 0.655893
Sample Variance 0.430195
Kurtosis -1.83799
Skewness -0.00509
Range 1.795
Minimum 0.435
Maximum 2.23
Sum 72.66
Count 59
You're viewing a preview
Unlock full access by subscribing today!

Using excel, we were able to compute for the linear regression equation utilizing the following
formula;
a=∑ y ∑ x2−∑ x ∑ x y
n ( ∑ x2 ) − ( ∑ x ) 2 = ( 73 ×70210 ) − ( 1770× 2771 )
( 59× 70210 ) −17702 =0.1954
b= n∑ xy−∑ x ∑ x y
n (∑ x2 )− (∑ x )2 = (59 × 2771 )− ( 1770 ×2771 )
( 59 ×70210 ) −17702 =0.034 5
The general least squares equation is given as follows;
y=a+bx
Thus the least squares trend line equation is;
y=0.19 5 4 +0. 034 5 x
b) Predicting the share price
For the case of the September 2017, the period is 61. This means that the value of x=61
y=0.19 5 4 +0. 034 5∗61=2.2999
c) The graph
Paraphrase This Document
Need a fresh take? Get an instant paraphrase of this document with our AI Paraphraser

d) Comparing the TPG and API
In this section a comparison of the performance of the TPG and API is made. We start by
computing the monthly returns for each of the two stocks.
Monthly returns= ( current month prices− previous month prices )
previous month prices
We then look at the descriptive statistics which is presented below
As can be seen, the average returns for API is 0.0268 while that of TPG is -0.00042 (very
close to zero). In terms of the standard deviation, the standard deviation for API is 0.1281
while that of TPG is 0.1692. The results on standard deviation clearly shows that TPG is
more risky and volatile as compared to API. API also has much better returns as compared to
TPG over the selected period of time (September 2012 to July 2017).
Based on the above findings therefore, it would be advisable that API is the best company to
choose for any investment one would want to make. The decision to choose API is pegged on
the fact that it has better returns than TPG and very crucial component that stock market
investors need to determine is the volatility and riskiness of a stock. TPG comes out as the
most risky and volatile stock and as such a potential investor should not bother to consider it
since he/she might end up making losses based on the company’s history as seen from the
analysis. Every investor would always want to invest where his/her money is safe and would
earn him/her some good returns in terms of investment. This therefore makes API the best
choice if the two stocks were the only ones to be considered.
Table 3: comparison of the two returns
Returns-API Returns-TPG
Mean 0.02682501 -0.000417166

Standard Error 0.01682064 0.022216066
Median 0.00388648 -0.029614861
Mode 0 0
Standard Deviation 0.12810215 0.169192517
Sample Variance 0.01641016 0.028626108
Kurtosis 6.20200217 0.937541883
Skewness 1.87272887 0.816791887
Range 0.79165683 0.813023856
Minimum -0.1995516 -0.29787234
Maximum 0.59210526 0.515151515
Sum 1.55585064 -0.024195655
Count 58 58
You're viewing a preview
Unlock full access by subscribing today!
1 out of 6
Related Documents

Your All-in-One AI-Powered Toolkit for Academic Success.
+13062052269
info@desklib.com
Available 24*7 on WhatsApp / Email
Unlock your academic potential
© 2024 | Zucol Services PVT LTD | All rights reserved.