International Finance: Stock Price Movement and Currency Risk Report
VerifiedAdded on 2020/05/16
|16
|2555
|72
Report
AI Summary
This finance report, likely for a Finance 11 course, analyzes the performance of several stocks, including BHP Billiton, Westpac, African Energy Resources, and GI Dynamics, over a period of several weeks. The analysis includes stock price fluctuations, percentage changes, and the primary reasons behind these movements. The report compares the stock price movements with the Australian market index (ASX 200) and FTSE 100 for foreign stocks to determine correlations. Furthermore, the report investigates the impact of currency exchange rate fluctuations on stock prices, specifically focusing on the relationship between the USD/AUD and GBP/AUD exchange rates and the performance of the selected stocks. The findings are presented through charts and tables, with references to external sources to support the analysis.

RUNNING HEAD: FINANCE
International finance
International finance
Paraphrase This Document
Need a fresh take? Get an instant paraphrase of this document with our AI Paraphraser
Finance 1
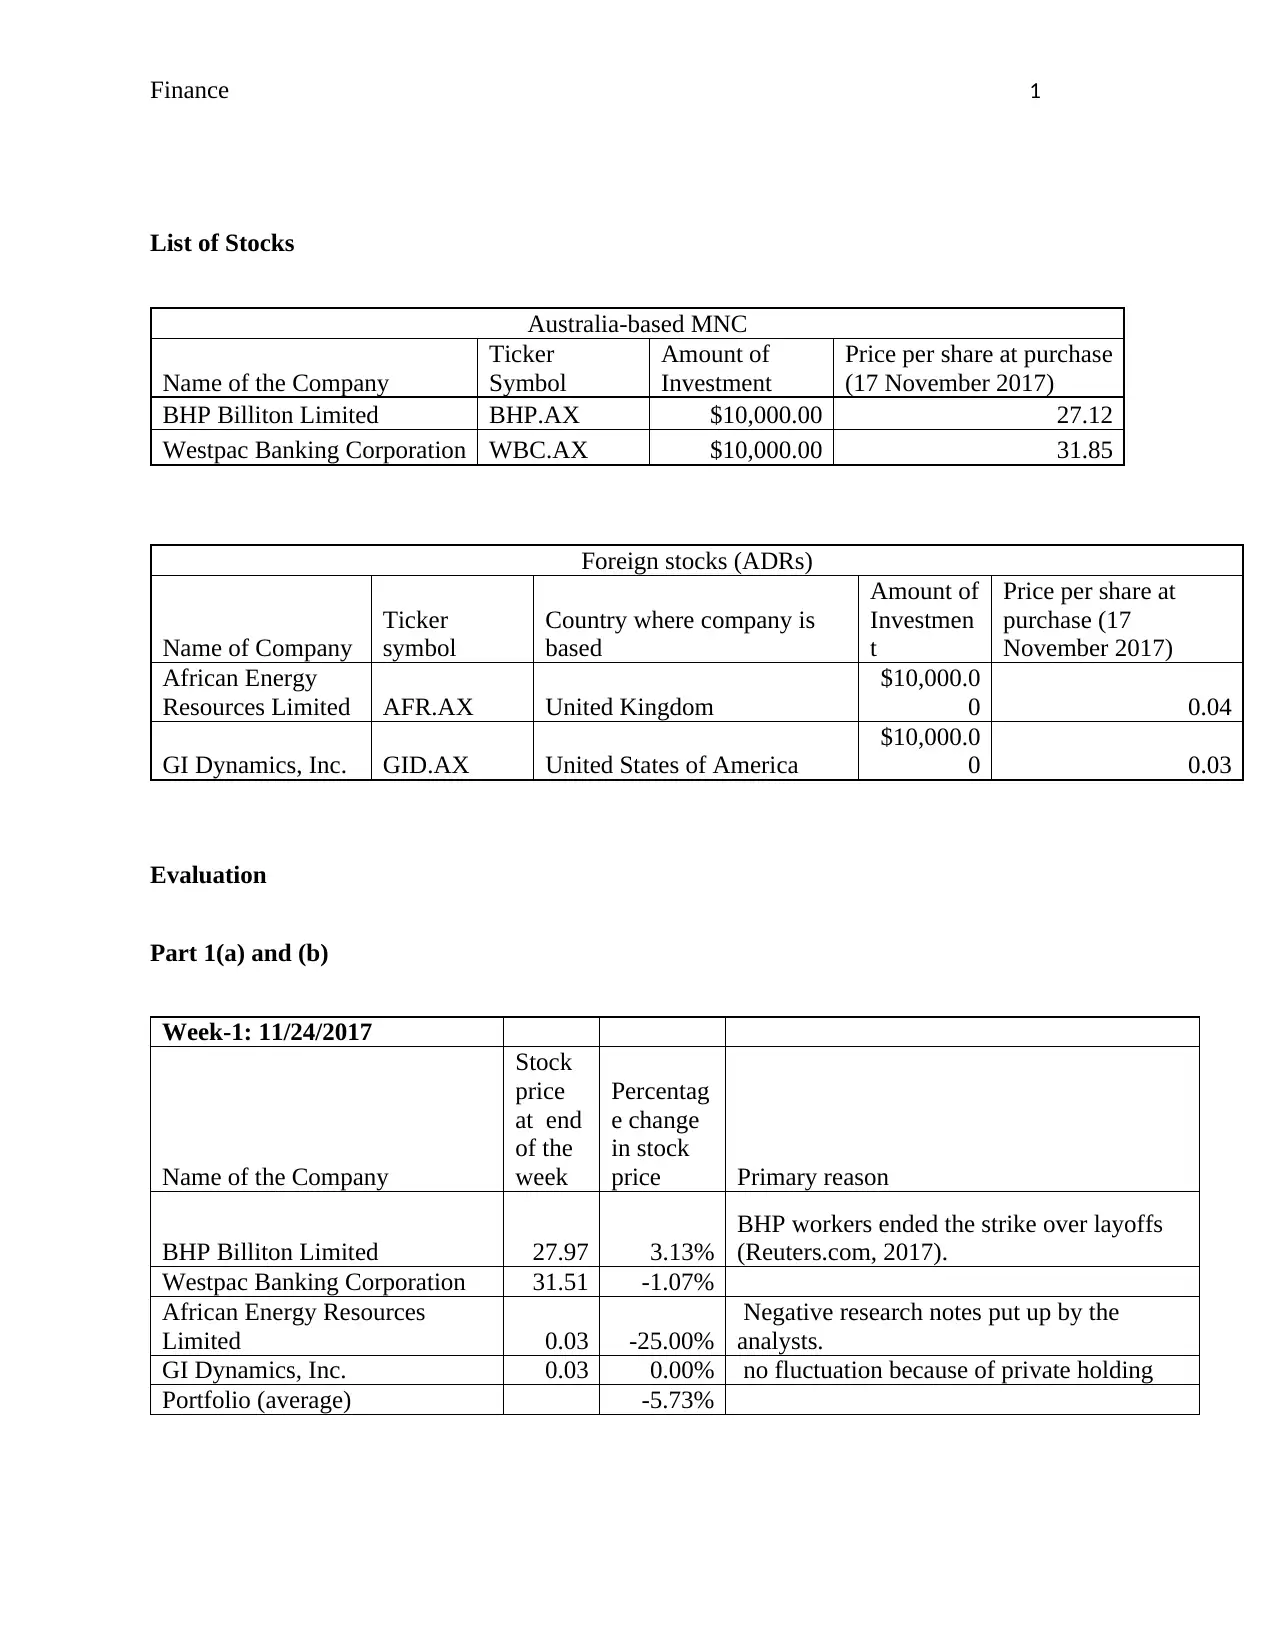
List of Stocks
Australia-based MNC
Name of the Company
Ticker
Symbol
Amount of
Investment
Price per share at purchase
(17 November 2017)
BHP Billiton Limited BHP.AX $10,000.00 27.12
Westpac Banking Corporation WBC.AX $10,000.00 31.85
Foreign stocks (ADRs)
Name of Company
Ticker
symbol
Country where company is
based
Amount of
Investmen
t
Price per share at
purchase (17
November 2017)
African Energy
Resources Limited AFR.AX United Kingdom
$10,000.0
0 0.04
GI Dynamics, Inc. GID.AX United States of America
$10,000.0
0 0.03
Evaluation
Part 1(a) and (b)
Week-1: 11/24/2017
Name of the Company
Stock
price
at end
of the
week
Percentag
e change
in stock
price Primary reason
BHP Billiton Limited 27.97 3.13%
BHP workers ended the strike over layoffs
(Reuters.com, 2017).
Westpac Banking Corporation 31.51 -1.07%
African Energy Resources
Limited 0.03 -25.00%
Negative research notes put up by the
analysts.
GI Dynamics, Inc. 0.03 0.00% no fluctuation because of private holding
Portfolio (average) -5.73%
Finance 2
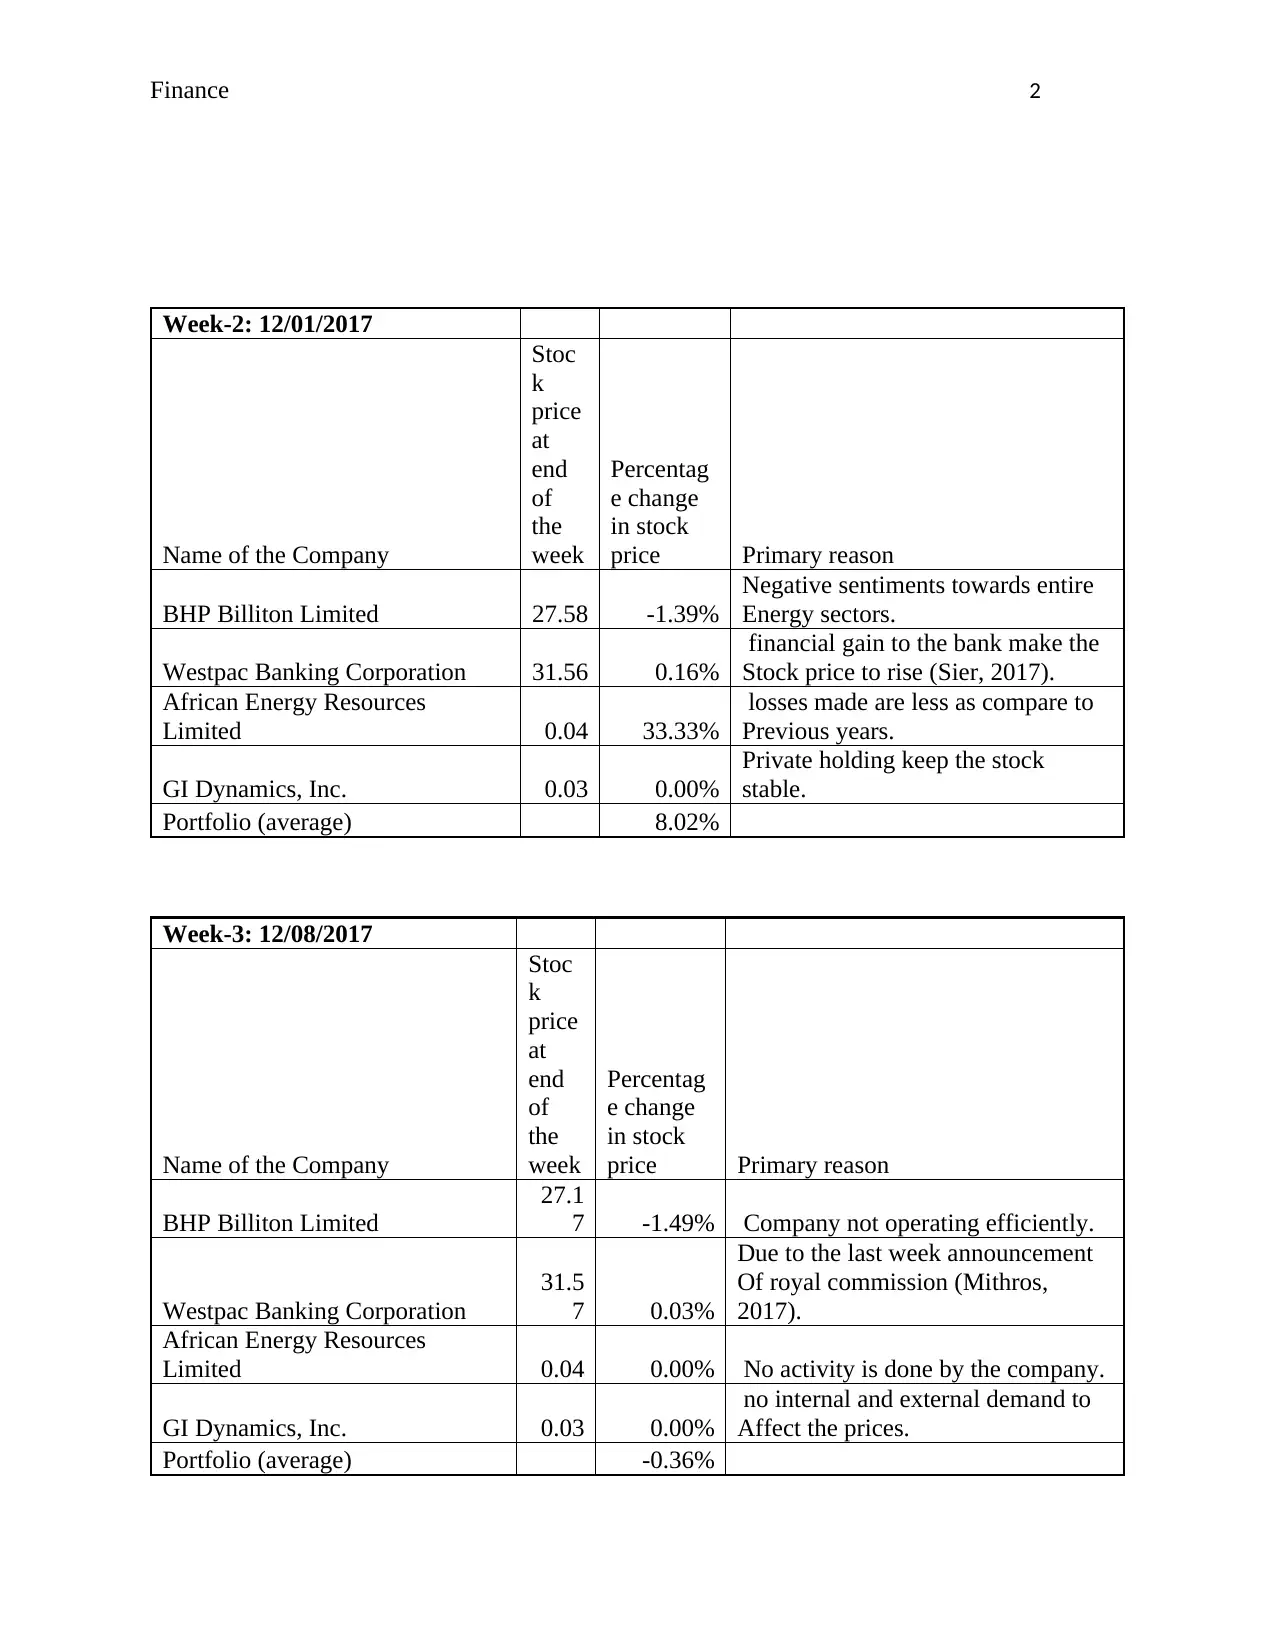
Week-2: 12/01/2017
Name of the Company
Stoc
k
price
at
end
of
the
week
Percentag
e change
in stock
price Primary reason
BHP Billiton Limited 27.58 -1.39%
Negative sentiments towards entire
Energy sectors.
Westpac Banking Corporation 31.56 0.16%
financial gain to the bank make the
Stock price to rise (Sier, 2017).
African Energy Resources
Limited 0.04 33.33%
losses made are less as compare to
Previous years.
GI Dynamics, Inc. 0.03 0.00%
Private holding keep the stock
stable.
Portfolio (average) 8.02%
Week-3: 12/08/2017
Name of the Company
Stoc
k
price
at
end
of
the
week
Percentag
e change
in stock
price Primary reason
BHP Billiton Limited
27.1
7 -1.49% Company not operating efficiently.
Westpac Banking Corporation
31.5
7 0.03%
Due to the last week announcement
Of royal commission (Mithros,
2017).
African Energy Resources
Limited 0.04 0.00% No activity is done by the company.
GI Dynamics, Inc. 0.03 0.00%
no internal and external demand to
Affect the prices.
Portfolio (average) -0.36%
⊘ This is a preview!⊘
Do you want full access?
Subscribe today to unlock all pages.
Trusted by 1+ million students worldwide
Finance 3
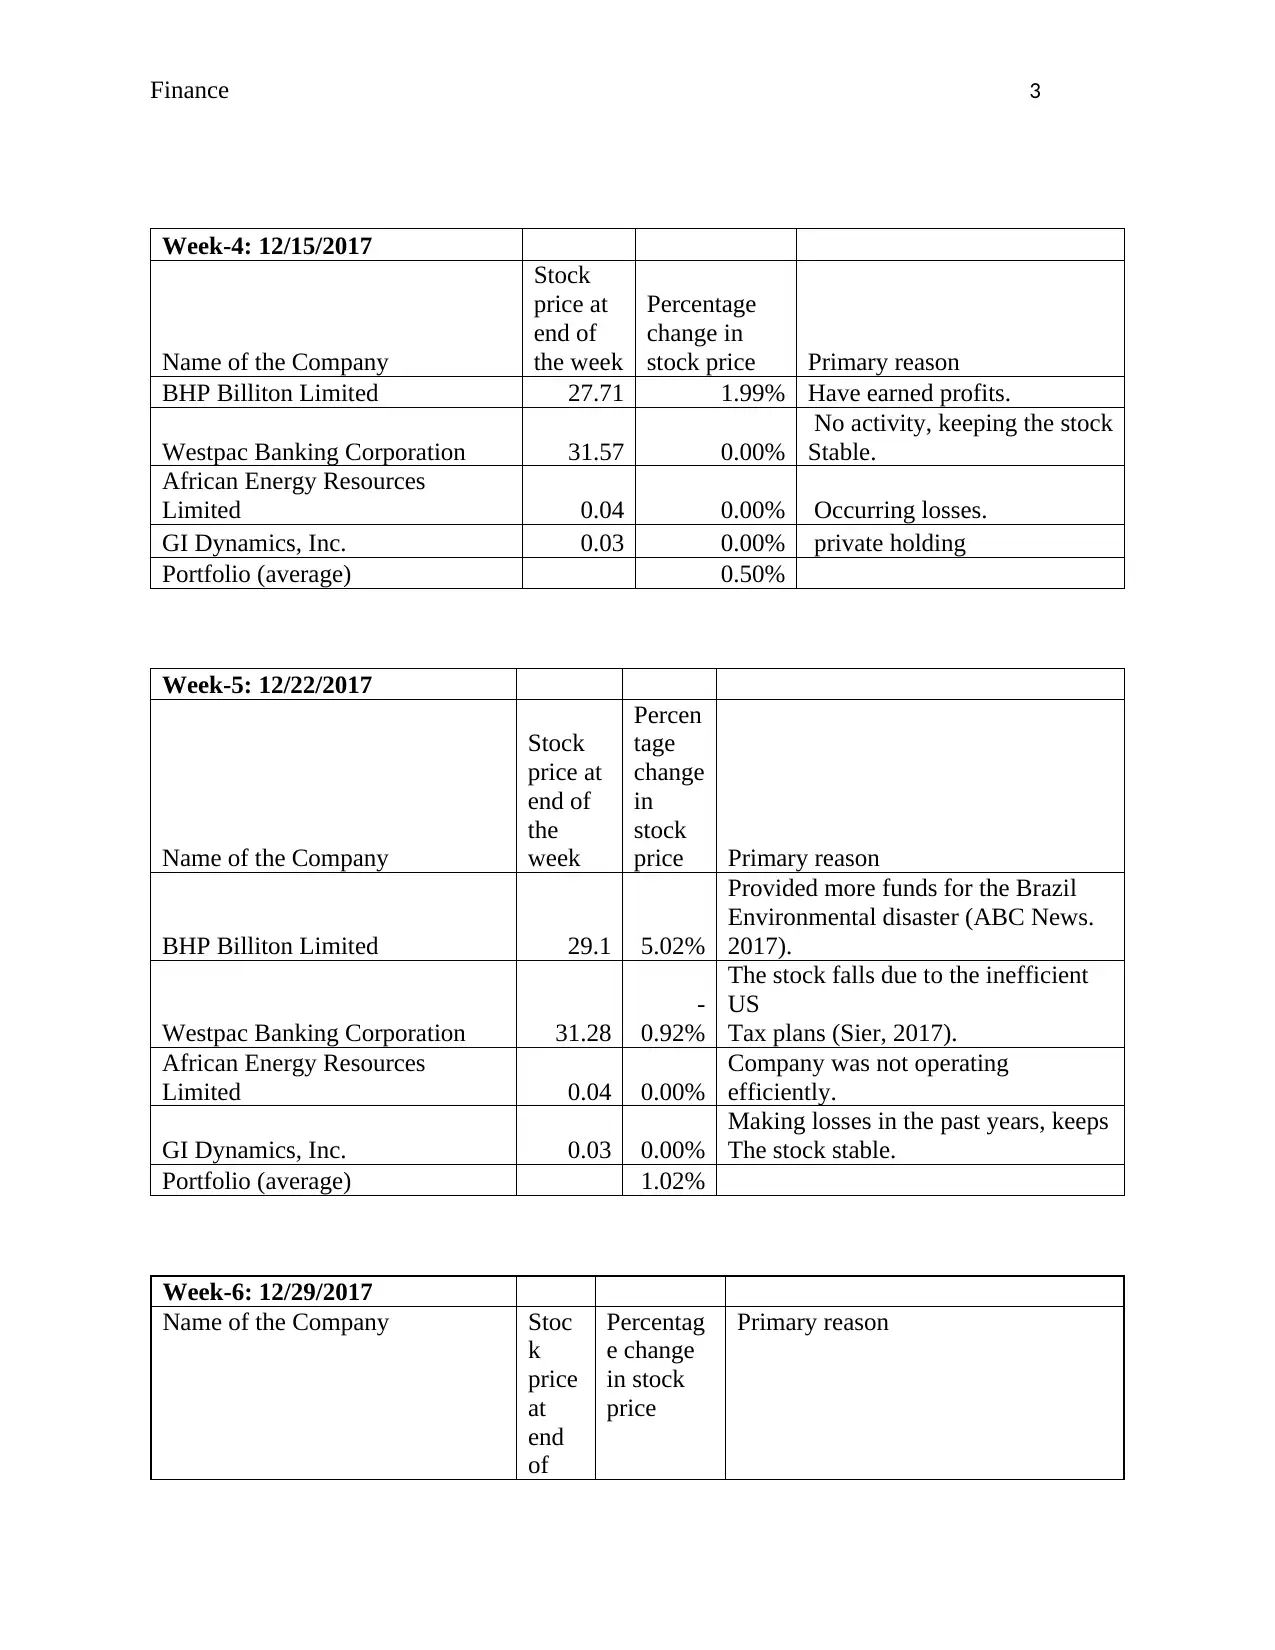
Week-4: 12/15/2017
Name of the Company
Stock
price at
end of
the week
Percentage
change in
stock price Primary reason
BHP Billiton Limited 27.71 1.99% Have earned profits.
Westpac Banking Corporation 31.57 0.00%
No activity, keeping the stock
Stable.
African Energy Resources
Limited 0.04 0.00% Occurring losses.
GI Dynamics, Inc. 0.03 0.00% private holding
Portfolio (average) 0.50%
Week-5: 12/22/2017
Name of the Company
Stock
price at
end of
the
week
Percen
tage
change
in
stock
price Primary reason
BHP Billiton Limited 29.1 5.02%
Provided more funds for the Brazil
Environmental disaster (ABC News.
2017).
Westpac Banking Corporation 31.28
-
0.92%
The stock falls due to the inefficient
US
Tax plans (Sier, 2017).
African Energy Resources
Limited 0.04 0.00%
Company was not operating
efficiently.
GI Dynamics, Inc. 0.03 0.00%
Making losses in the past years, keeps
The stock stable.
Portfolio (average) 1.02%
Week-6: 12/29/2017
Name of the Company Stoc
k
price
at
end
of
Percentag
e change
in stock
price
Primary reason
Paraphrase This Document
Need a fresh take? Get an instant paraphrase of this document with our AI Paraphraser
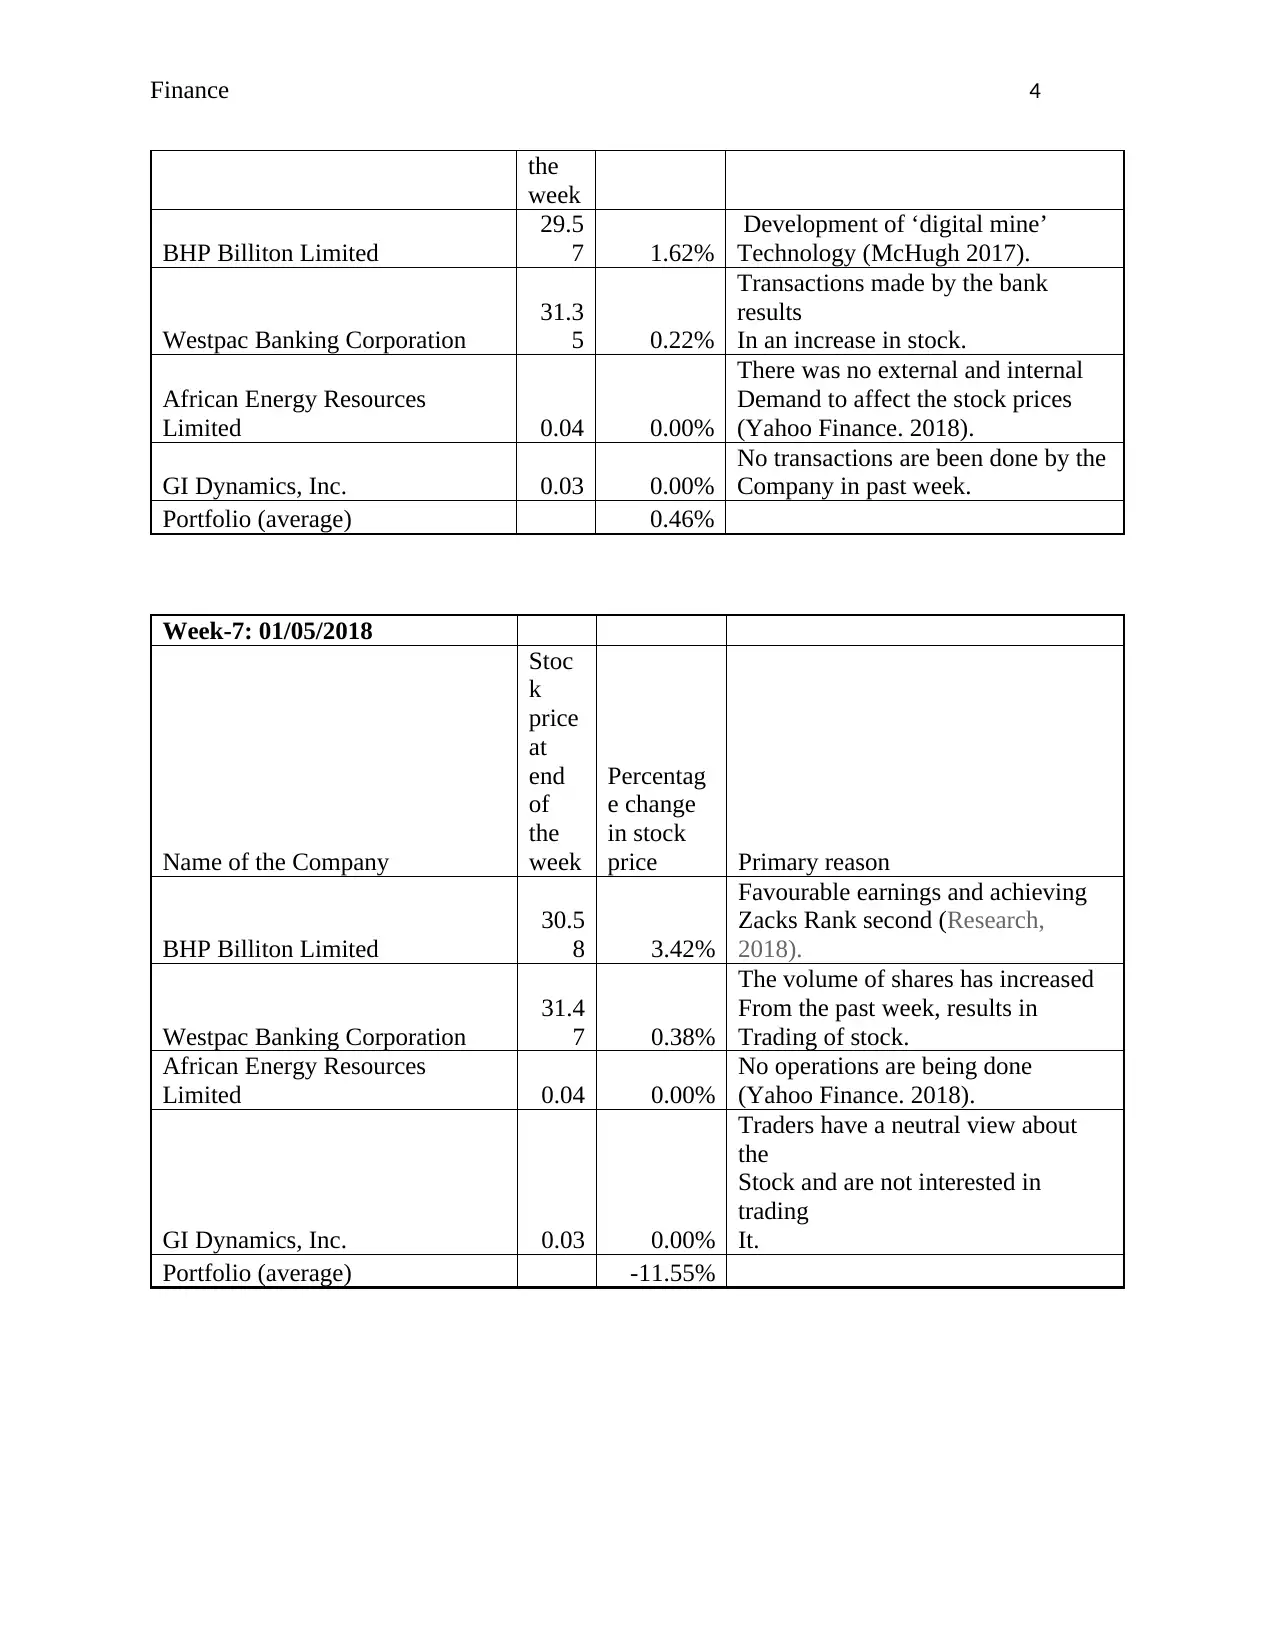
Finance 4
the
week
BHP Billiton Limited
29.5
7 1.62%
Development of ‘digital mine’
Technology (McHugh 2017).
Westpac Banking Corporation
31.3
5 0.22%
Transactions made by the bank
results
In an increase in stock.
African Energy Resources
Limited 0.04 0.00%
There was no external and internal
Demand to affect the stock prices
(Yahoo Finance. 2018).
GI Dynamics, Inc. 0.03 0.00%
No transactions are been done by the
Company in past week.
Portfolio (average) 0.46%
Week-7: 01/05/2018
Name of the Company
Stoc
k
price
at
end
of
the
week
Percentag
e change
in stock
price Primary reason
BHP Billiton Limited
30.5
8 3.42%
Favourable earnings and achieving
Zacks Rank second (Research,
2018).
Westpac Banking Corporation
31.4
7 0.38%
The volume of shares has increased
From the past week, results in
Trading of stock.
African Energy Resources
Limited 0.04 0.00%
No operations are being done
(Yahoo Finance. 2018).
GI Dynamics, Inc. 0.03 0.00%
Traders have a neutral view about
the
Stock and are not interested in
trading
It.
Portfolio (average) -11.55%
the
week
BHP Billiton Limited
29.5
7 1.62%
Development of ‘digital mine’
Technology (McHugh 2017).
Westpac Banking Corporation
31.3
5 0.22%
Transactions made by the bank
results
In an increase in stock.
African Energy Resources
Limited 0.04 0.00%
There was no external and internal
Demand to affect the stock prices
(Yahoo Finance. 2018).
GI Dynamics, Inc. 0.03 0.00%
No transactions are been done by the
Company in past week.
Portfolio (average) 0.46%
Week-7: 01/05/2018
Name of the Company
Stoc
k
price
at
end
of
the
week
Percentag
e change
in stock
price Primary reason
BHP Billiton Limited
30.5
8 3.42%
Favourable earnings and achieving
Zacks Rank second (Research,
2018).
Westpac Banking Corporation
31.4
7 0.38%
The volume of shares has increased
From the past week, results in
Trading of stock.
African Energy Resources
Limited 0.04 0.00%
No operations are being done
(Yahoo Finance. 2018).
GI Dynamics, Inc. 0.03 0.00%
Traders have a neutral view about
the
Stock and are not interested in
trading
It.
Portfolio (average) -11.55%
Finance 5
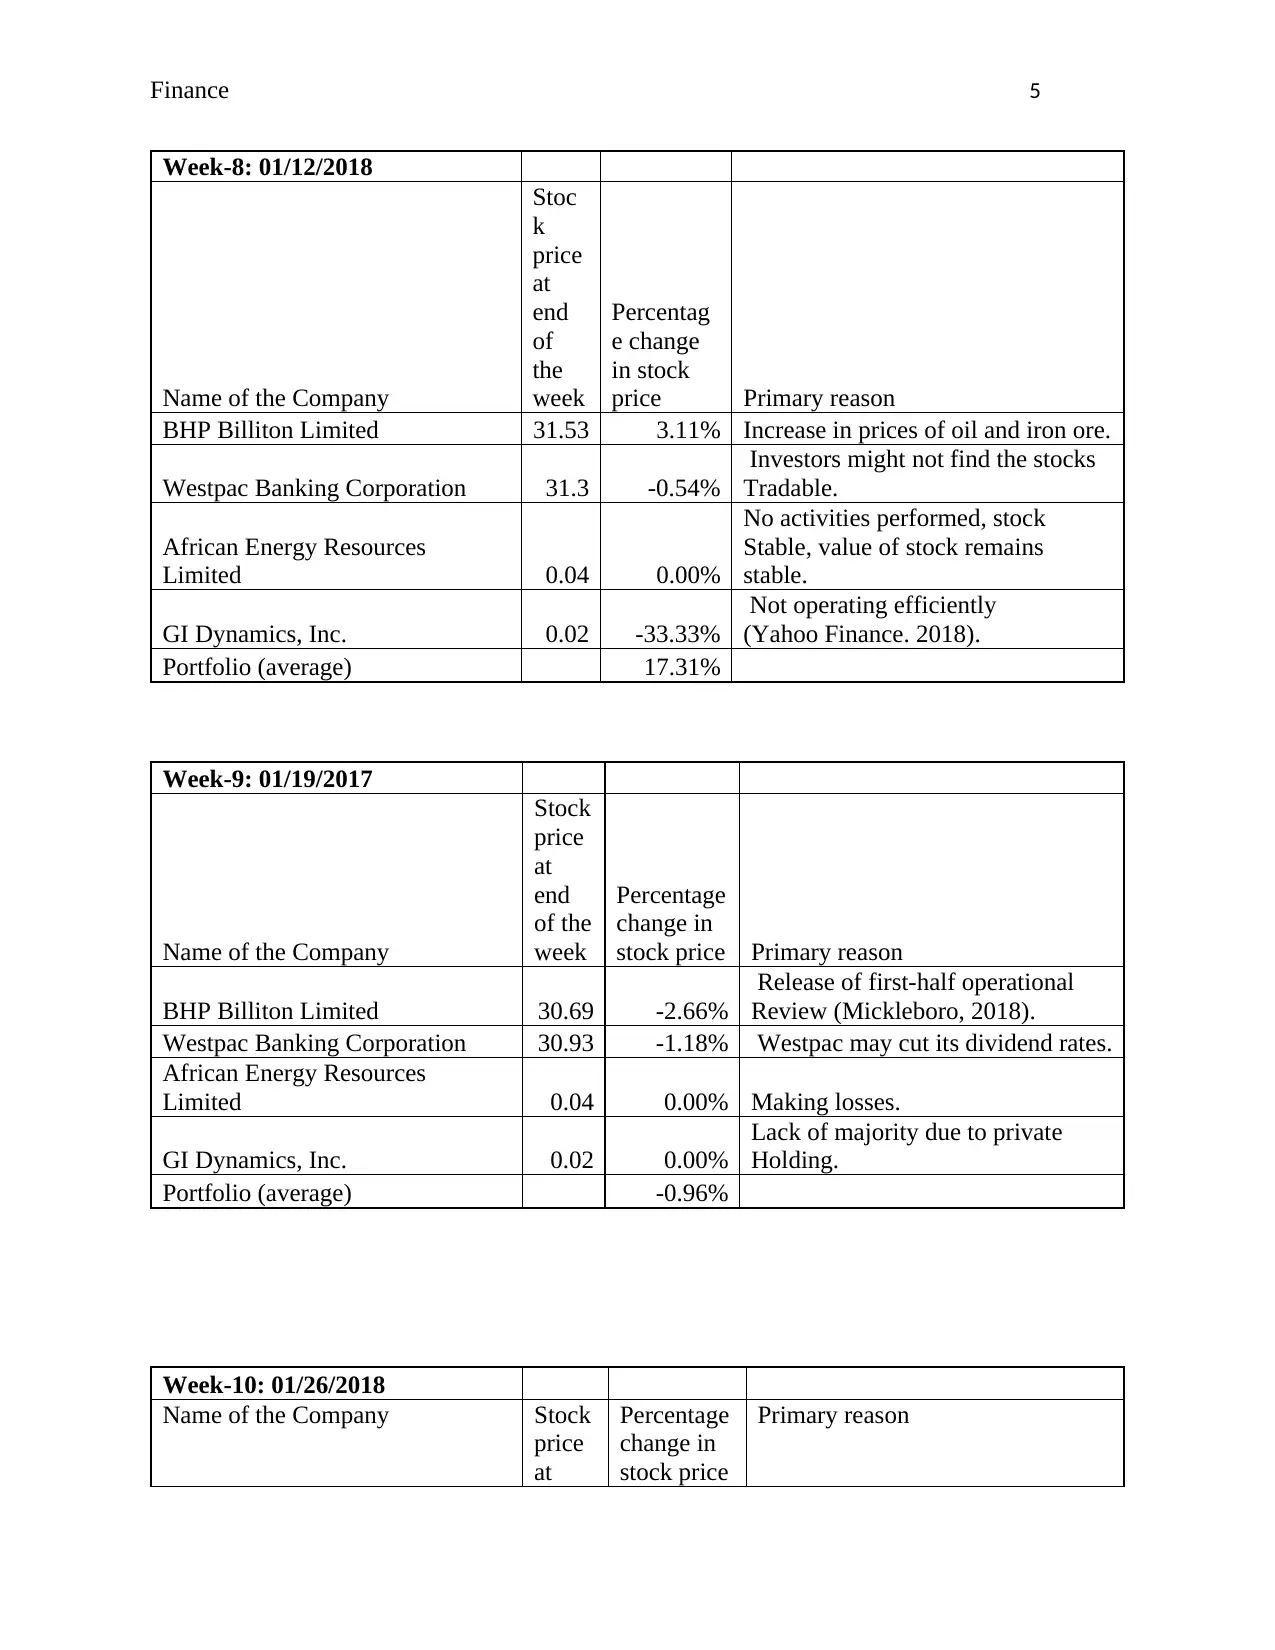
Week-8: 01/12/2018
Name of the Company
Stoc
k
price
at
end
of
the
week
Percentag
e change
in stock
price Primary reason
BHP Billiton Limited 31.53 3.11% Increase in prices of oil and iron ore.
Westpac Banking Corporation 31.3 -0.54%
Investors might not find the stocks
Tradable.
African Energy Resources
Limited 0.04 0.00%
No activities performed, stock
Stable, value of stock remains
stable.
GI Dynamics, Inc. 0.02 -33.33%
Not operating efficiently
(Yahoo Finance. 2018).
Portfolio (average) 17.31%
Week-9: 01/19/2017
Name of the Company
Stock
price
at
end
of the
week
Percentage
change in
stock price Primary reason
BHP Billiton Limited 30.69 -2.66%
Release of first-half operational
Review (Mickleboro, 2018).
Westpac Banking Corporation 30.93 -1.18% Westpac may cut its dividend rates.
African Energy Resources
Limited 0.04 0.00% Making losses.
GI Dynamics, Inc. 0.02 0.00%
Lack of majority due to private
Holding.
Portfolio (average) -0.96%
Week-10: 01/26/2018
Name of the Company Stock
price
at
Percentage
change in
stock price
Primary reason
⊘ This is a preview!⊘
Do you want full access?
Subscribe today to unlock all pages.
Trusted by 1+ million students worldwide
Finance 6
end
of the
week
BHP Billiton Limited 30.85 0.52% Working Efficiently
Westpac Banking Corporation 30.93 0.00%
No announcement made which
Can affect the prices.
African Energy Resources
Limited 0.04 0.00% Not functioning.
GI Dynamics, Inc. 0.02 0.00% No activities done during the week.
Portfolio (average) 0.13%
Part 2
Comparison of the stock price movements with Australian Market index
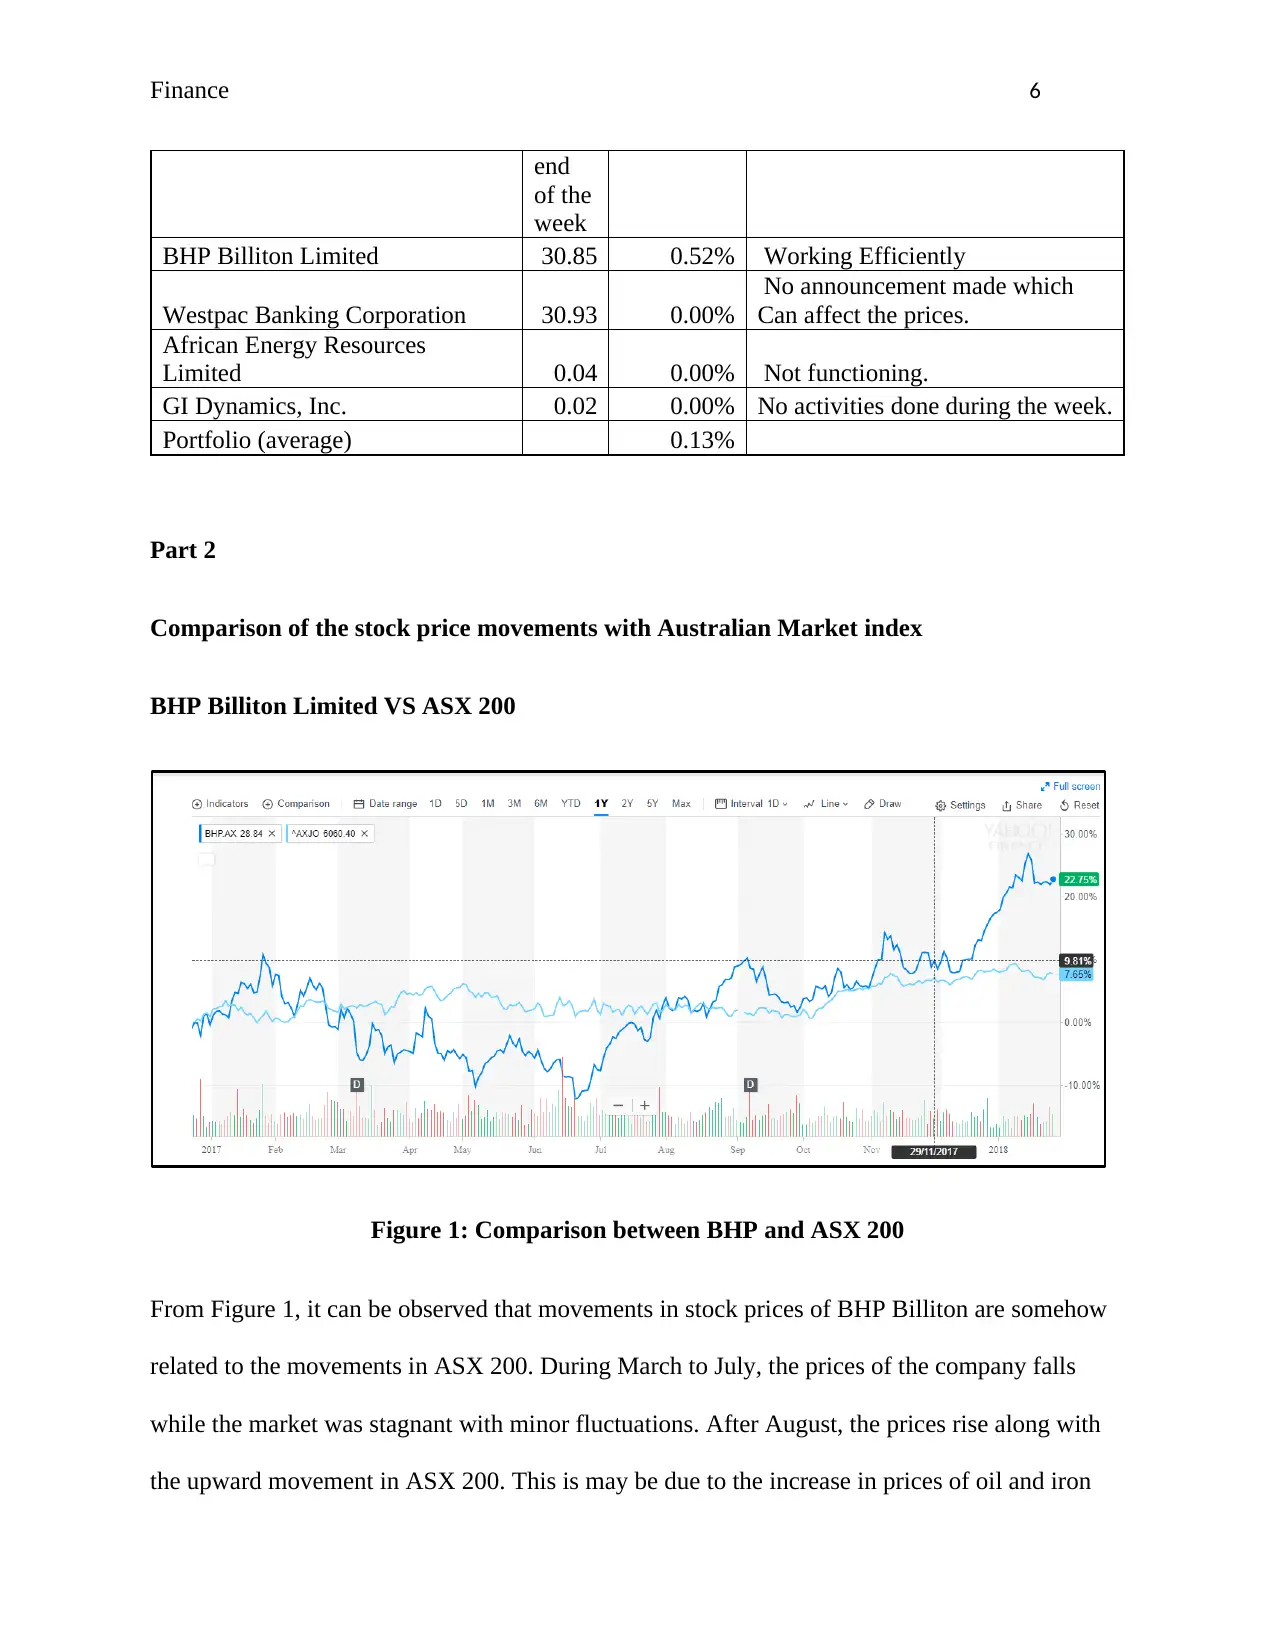
BHP Billiton Limited VS ASX 200
Figure 1: Comparison between BHP and ASX 200
From Figure 1, it can be observed that movements in stock prices of BHP Billiton are somehow
related to the movements in ASX 200. During March to July, the prices of the company falls
while the market was stagnant with minor fluctuations. After August, the prices rise along with
the upward movement in ASX 200. This is may be due to the increase in prices of oil and iron
end
of the
week
BHP Billiton Limited 30.85 0.52% Working Efficiently
Westpac Banking Corporation 30.93 0.00%
No announcement made which
Can affect the prices.
African Energy Resources
Limited 0.04 0.00% Not functioning.
GI Dynamics, Inc. 0.02 0.00% No activities done during the week.
Portfolio (average) 0.13%
Part 2
Comparison of the stock price movements with Australian Market index
BHP Billiton Limited VS ASX 200
Figure 1: Comparison between BHP and ASX 200
From Figure 1, it can be observed that movements in stock prices of BHP Billiton are somehow
related to the movements in ASX 200. During March to July, the prices of the company falls
while the market was stagnant with minor fluctuations. After August, the prices rise along with
the upward movement in ASX 200. This is may be due to the increase in prices of oil and iron
Paraphrase This Document
Need a fresh take? Get an instant paraphrase of this document with our AI Paraphraser
Finance 7
ore. This implies that the trend in BHP’s prices is largely depend upon the variations in market
index.
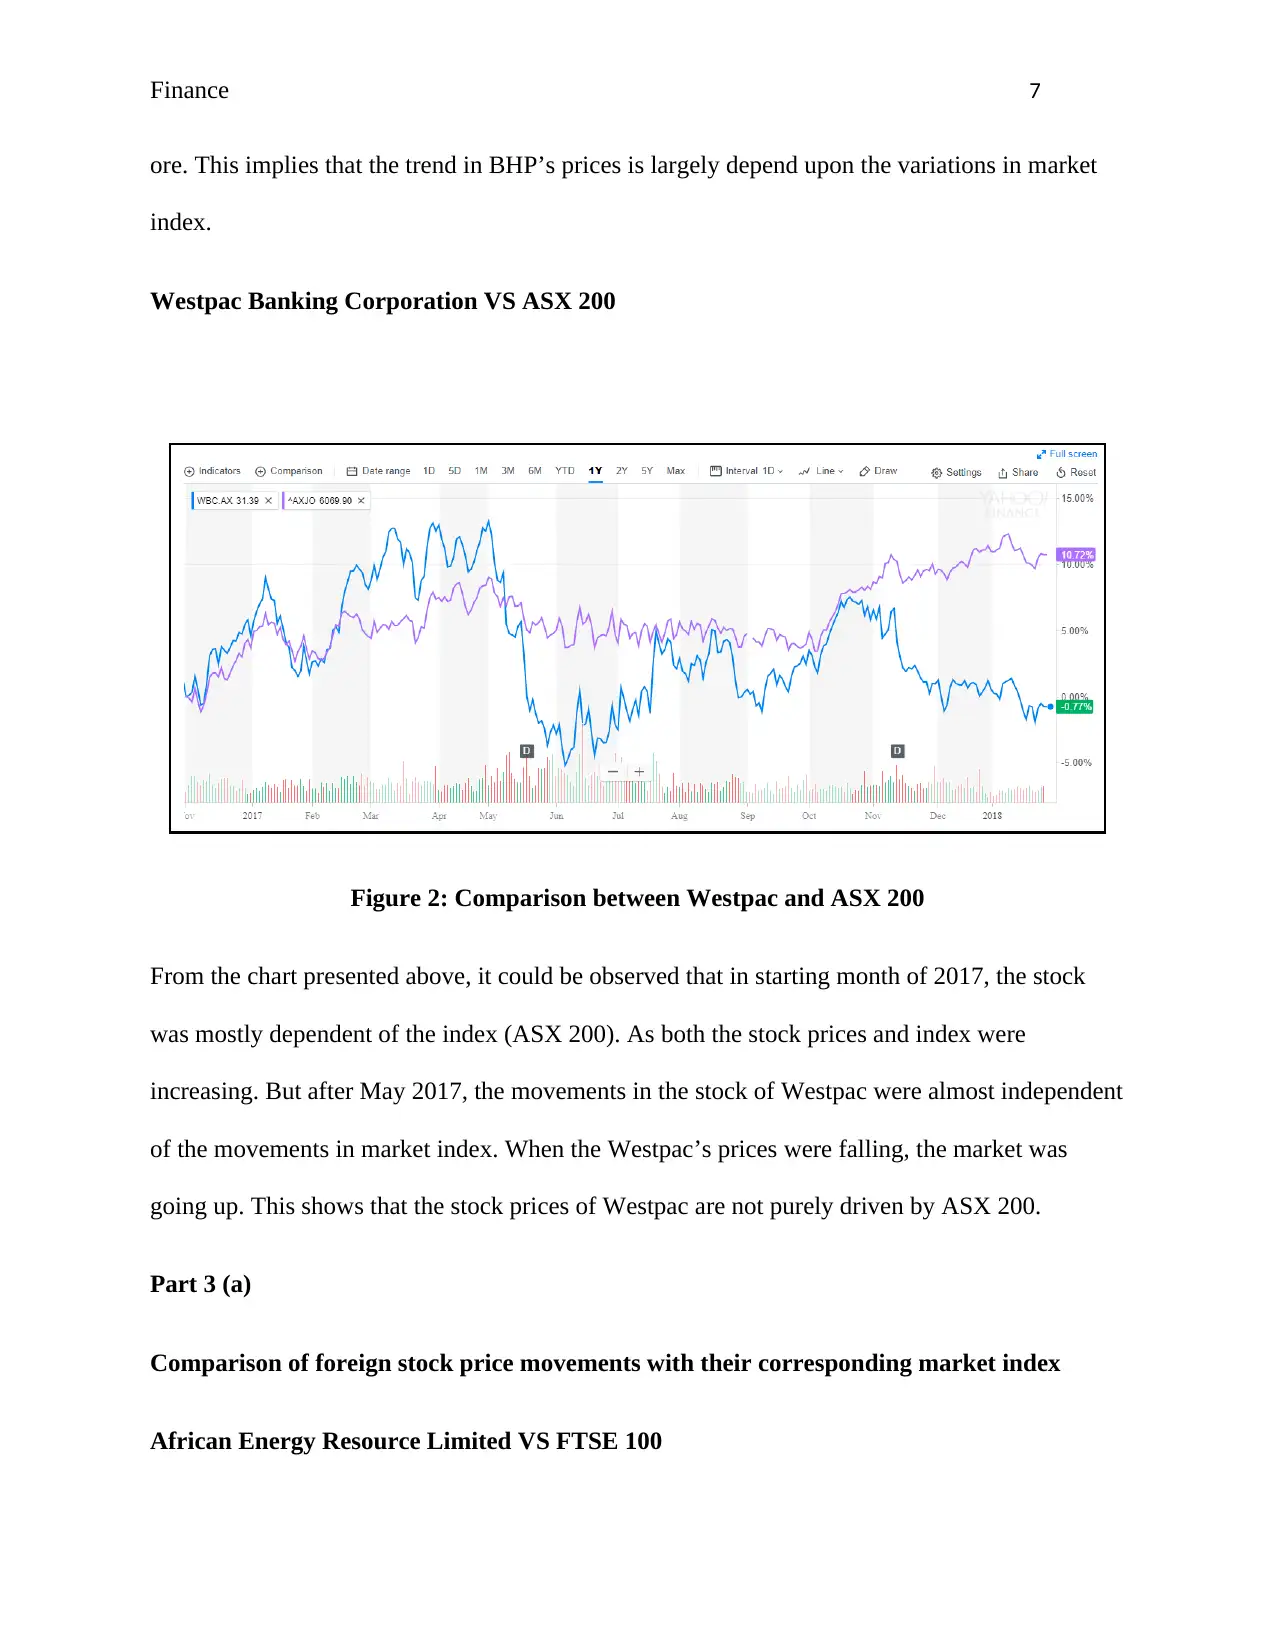
Westpac Banking Corporation VS ASX 200
Figure 2: Comparison between Westpac and ASX 200
From the chart presented above, it could be observed that in starting month of 2017, the stock
was mostly dependent of the index (ASX 200). As both the stock prices and index were
increasing. But after May 2017, the movements in the stock of Westpac were almost independent
of the movements in market index. When the Westpac’s prices were falling, the market was
going up. This shows that the stock prices of Westpac are not purely driven by ASX 200.
Part 3 (a)
Comparison of foreign stock price movements with their corresponding market index
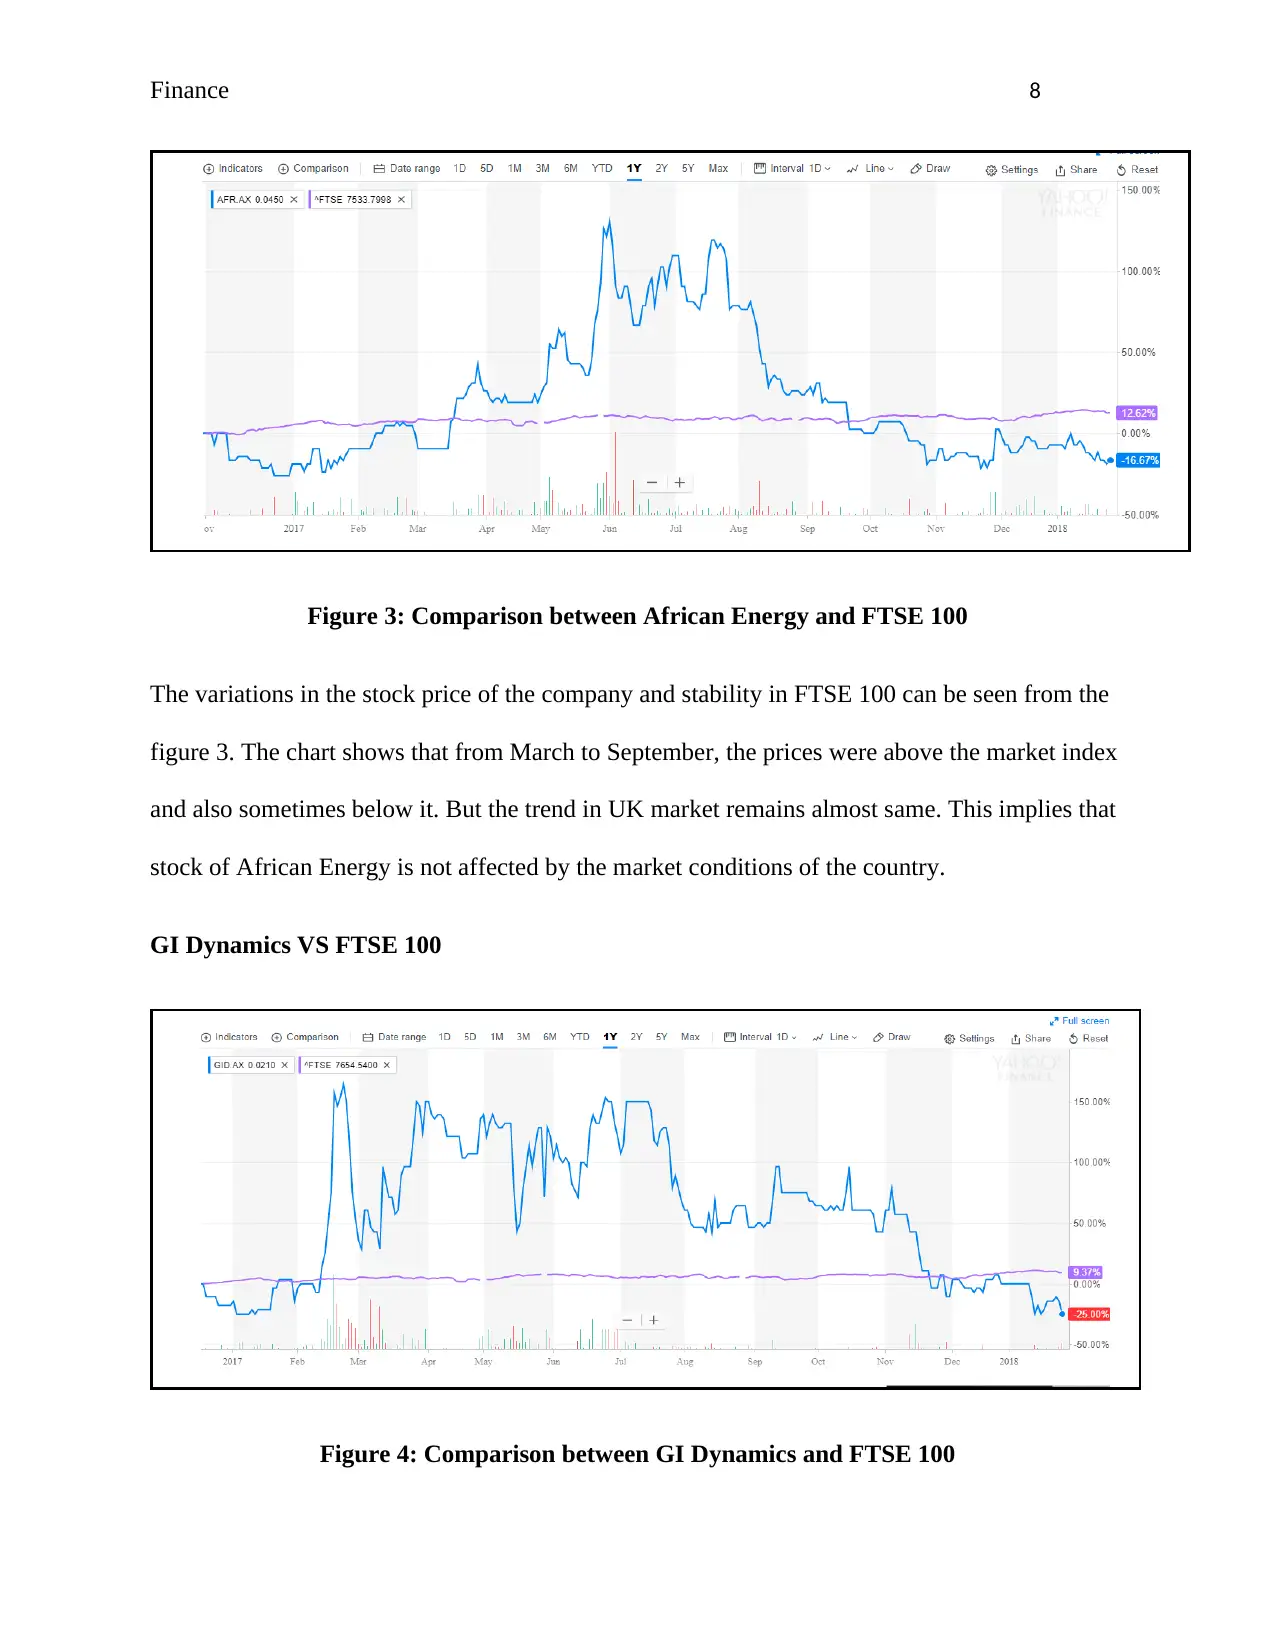
African Energy Resource Limited VS FTSE 100
ore. This implies that the trend in BHP’s prices is largely depend upon the variations in market
index.
Westpac Banking Corporation VS ASX 200
Figure 2: Comparison between Westpac and ASX 200
From the chart presented above, it could be observed that in starting month of 2017, the stock
was mostly dependent of the index (ASX 200). As both the stock prices and index were
increasing. But after May 2017, the movements in the stock of Westpac were almost independent
of the movements in market index. When the Westpac’s prices were falling, the market was
going up. This shows that the stock prices of Westpac are not purely driven by ASX 200.
Part 3 (a)
Comparison of foreign stock price movements with their corresponding market index
African Energy Resource Limited VS FTSE 100
Finance 8
Figure 3: Comparison between African Energy and FTSE 100
The variations in the stock price of the company and stability in FTSE 100 can be seen from the
figure 3. The chart shows that from March to September, the prices were above the market index
and also sometimes below it. But the trend in UK market remains almost same. This implies that
stock of African Energy is not affected by the market conditions of the country.
GI Dynamics VS FTSE 100
Figure 4: Comparison between GI Dynamics and FTSE 100
⊘ This is a preview!⊘
Do you want full access?
Subscribe today to unlock all pages.
Trusted by 1+ million students worldwide
Finance 9
Comparing the trend in stock prices of GI dynamics with FTSE 100, it could be seen that the
prices of the company are way higher than the market index. The trend in FTSE 100 is almost
stagnant, whereas many fluctuations can be noticed in GI’s stock. However, the stock was below
the market index in starting and ending of the year 2017. Figure 4 implies that changes in FTSE
100 does not affect the stock prices of GI Dynamics.
3 (b)
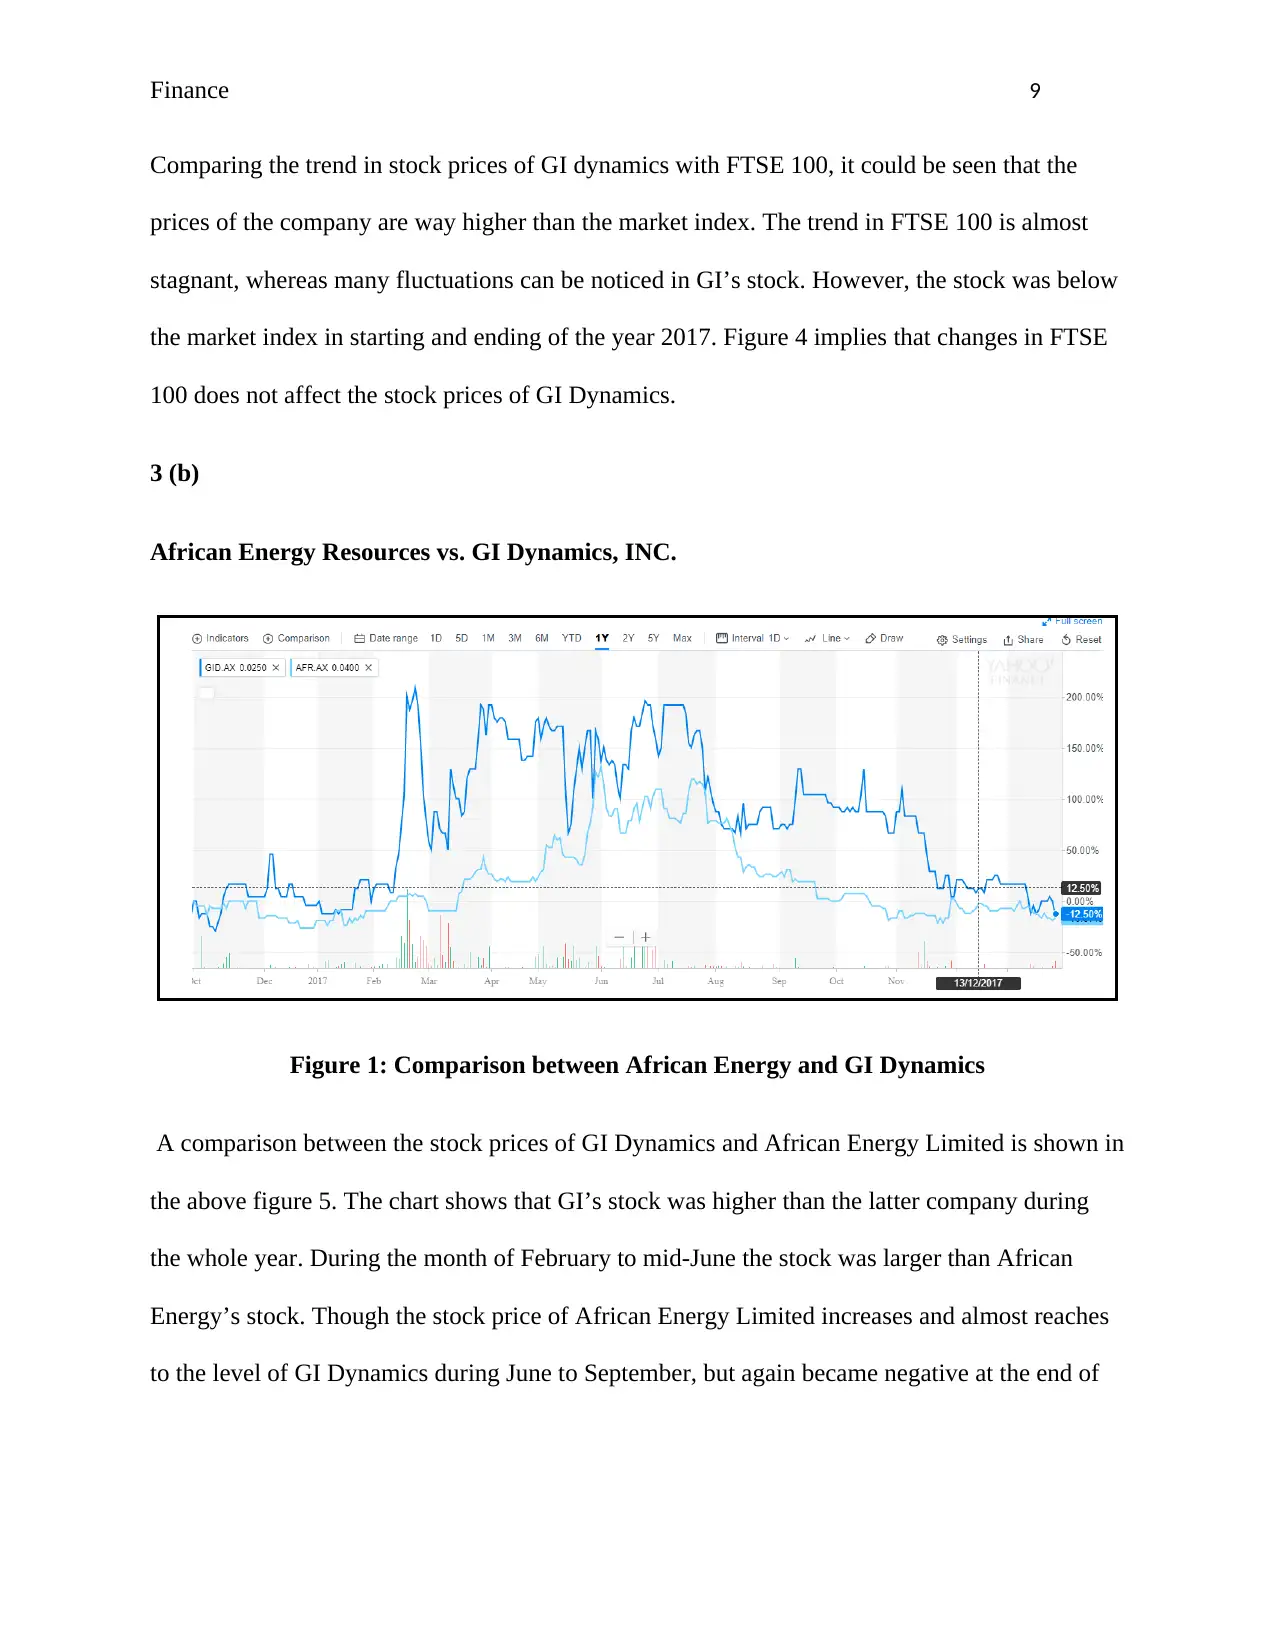
African Energy Resources vs. GI Dynamics, INC.
Figure 1: Comparison between African Energy and GI Dynamics
A comparison between the stock prices of GI Dynamics and African Energy Limited is shown in
the above figure 5. The chart shows that GI’s stock was higher than the latter company during
the whole year. During the month of February to mid-June the stock was larger than African
Energy’s stock. Though the stock price of African Energy Limited increases and almost reaches
to the level of GI Dynamics during June to September, but again became negative at the end of
Comparing the trend in stock prices of GI dynamics with FTSE 100, it could be seen that the
prices of the company are way higher than the market index. The trend in FTSE 100 is almost
stagnant, whereas many fluctuations can be noticed in GI’s stock. However, the stock was below
the market index in starting and ending of the year 2017. Figure 4 implies that changes in FTSE
100 does not affect the stock prices of GI Dynamics.
3 (b)
African Energy Resources vs. GI Dynamics, INC.
Figure 1: Comparison between African Energy and GI Dynamics
A comparison between the stock prices of GI Dynamics and African Energy Limited is shown in
the above figure 5. The chart shows that GI’s stock was higher than the latter company during
the whole year. During the month of February to mid-June the stock was larger than African
Energy’s stock. Though the stock price of African Energy Limited increases and almost reaches
to the level of GI Dynamics during June to September, but again became negative at the end of
Paraphrase This Document
Need a fresh take? Get an instant paraphrase of this document with our AI Paraphraser
Finance 10
the year. On the other side GI’s stock also fell but remains positive. So it can be concluded that
AFR and GID are positively correlated with each other to some extent.
3 (c)
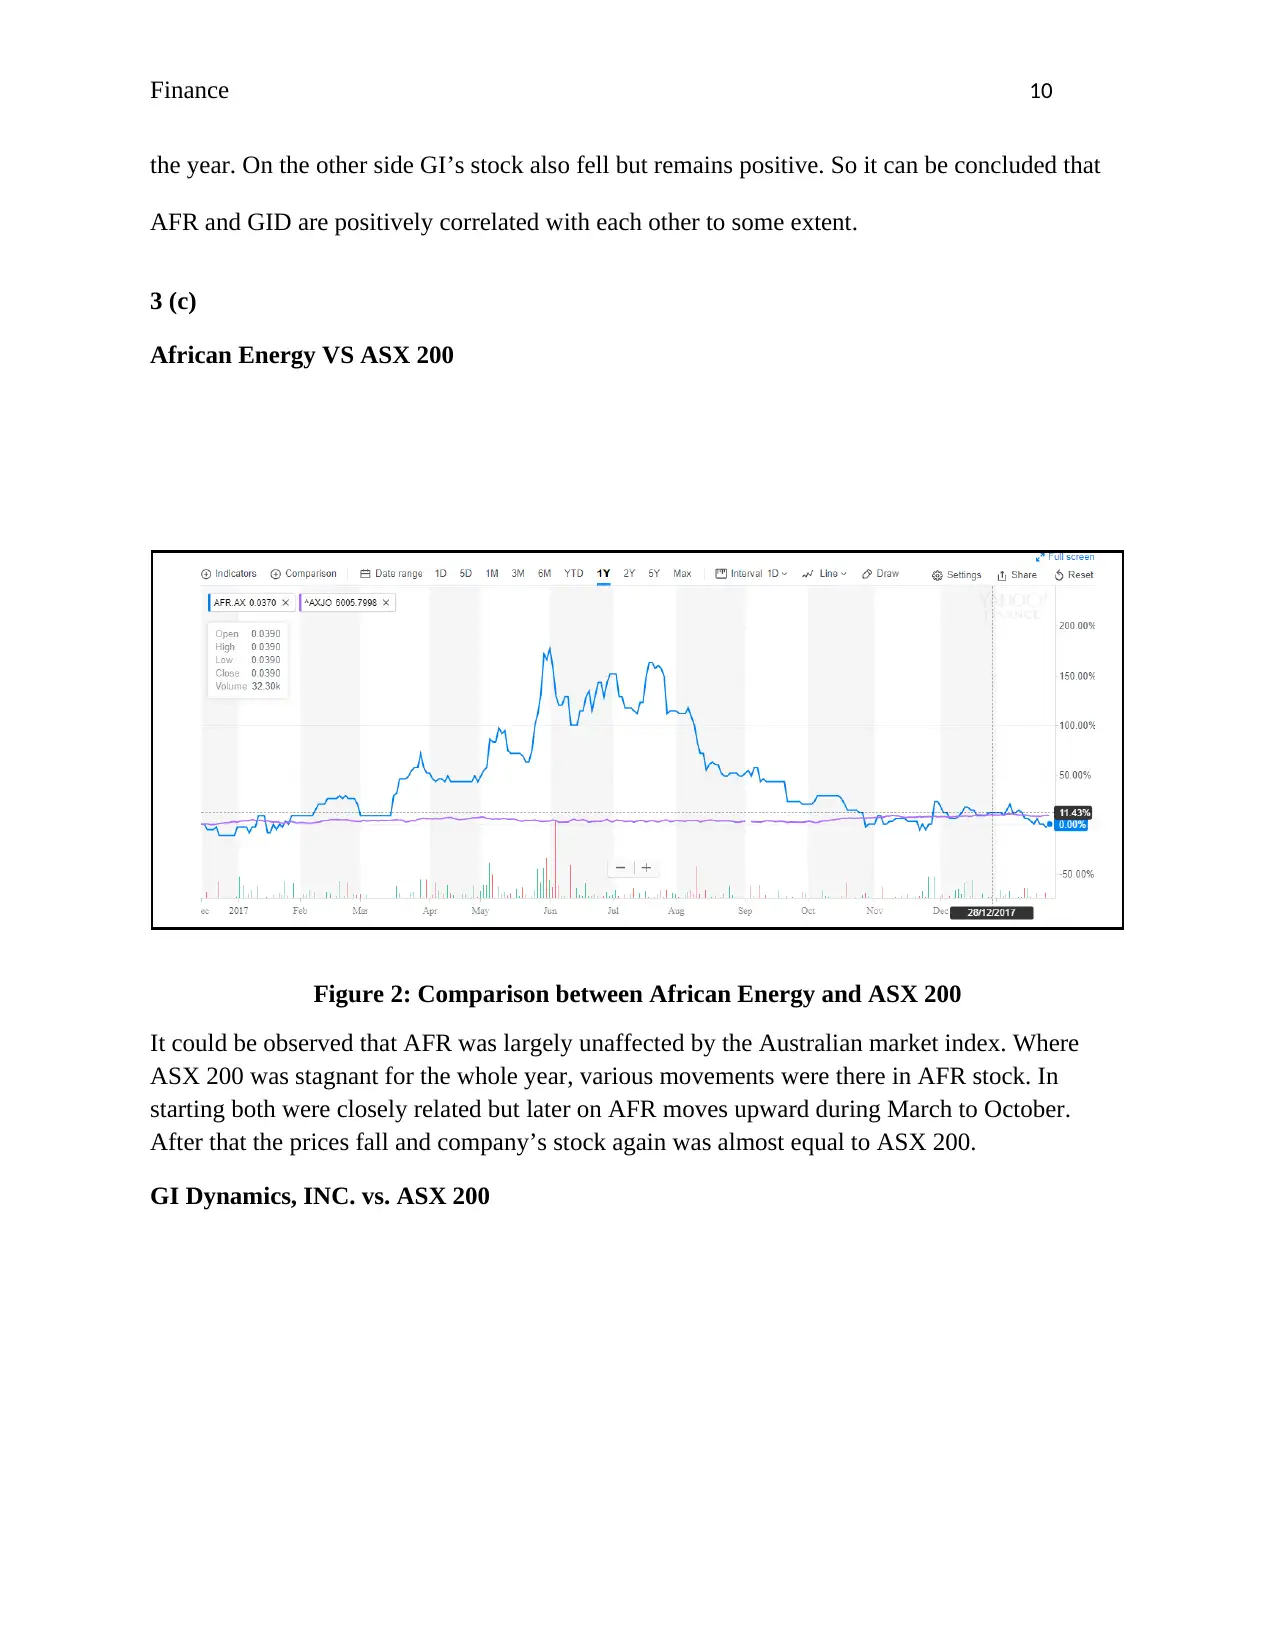
African Energy VS ASX 200
Figure 2: Comparison between African Energy and ASX 200
It could be observed that AFR was largely unaffected by the Australian market index. Where
ASX 200 was stagnant for the whole year, various movements were there in AFR stock. In
starting both were closely related but later on AFR moves upward during March to October.
After that the prices fall and company’s stock again was almost equal to ASX 200.
GI Dynamics, INC. vs. ASX 200
the year. On the other side GI’s stock also fell but remains positive. So it can be concluded that
AFR and GID are positively correlated with each other to some extent.
3 (c)
African Energy VS ASX 200
Figure 2: Comparison between African Energy and ASX 200
It could be observed that AFR was largely unaffected by the Australian market index. Where
ASX 200 was stagnant for the whole year, various movements were there in AFR stock. In
starting both were closely related but later on AFR moves upward during March to October.
After that the prices fall and company’s stock again was almost equal to ASX 200.
GI Dynamics, INC. vs. ASX 200
Finance 11
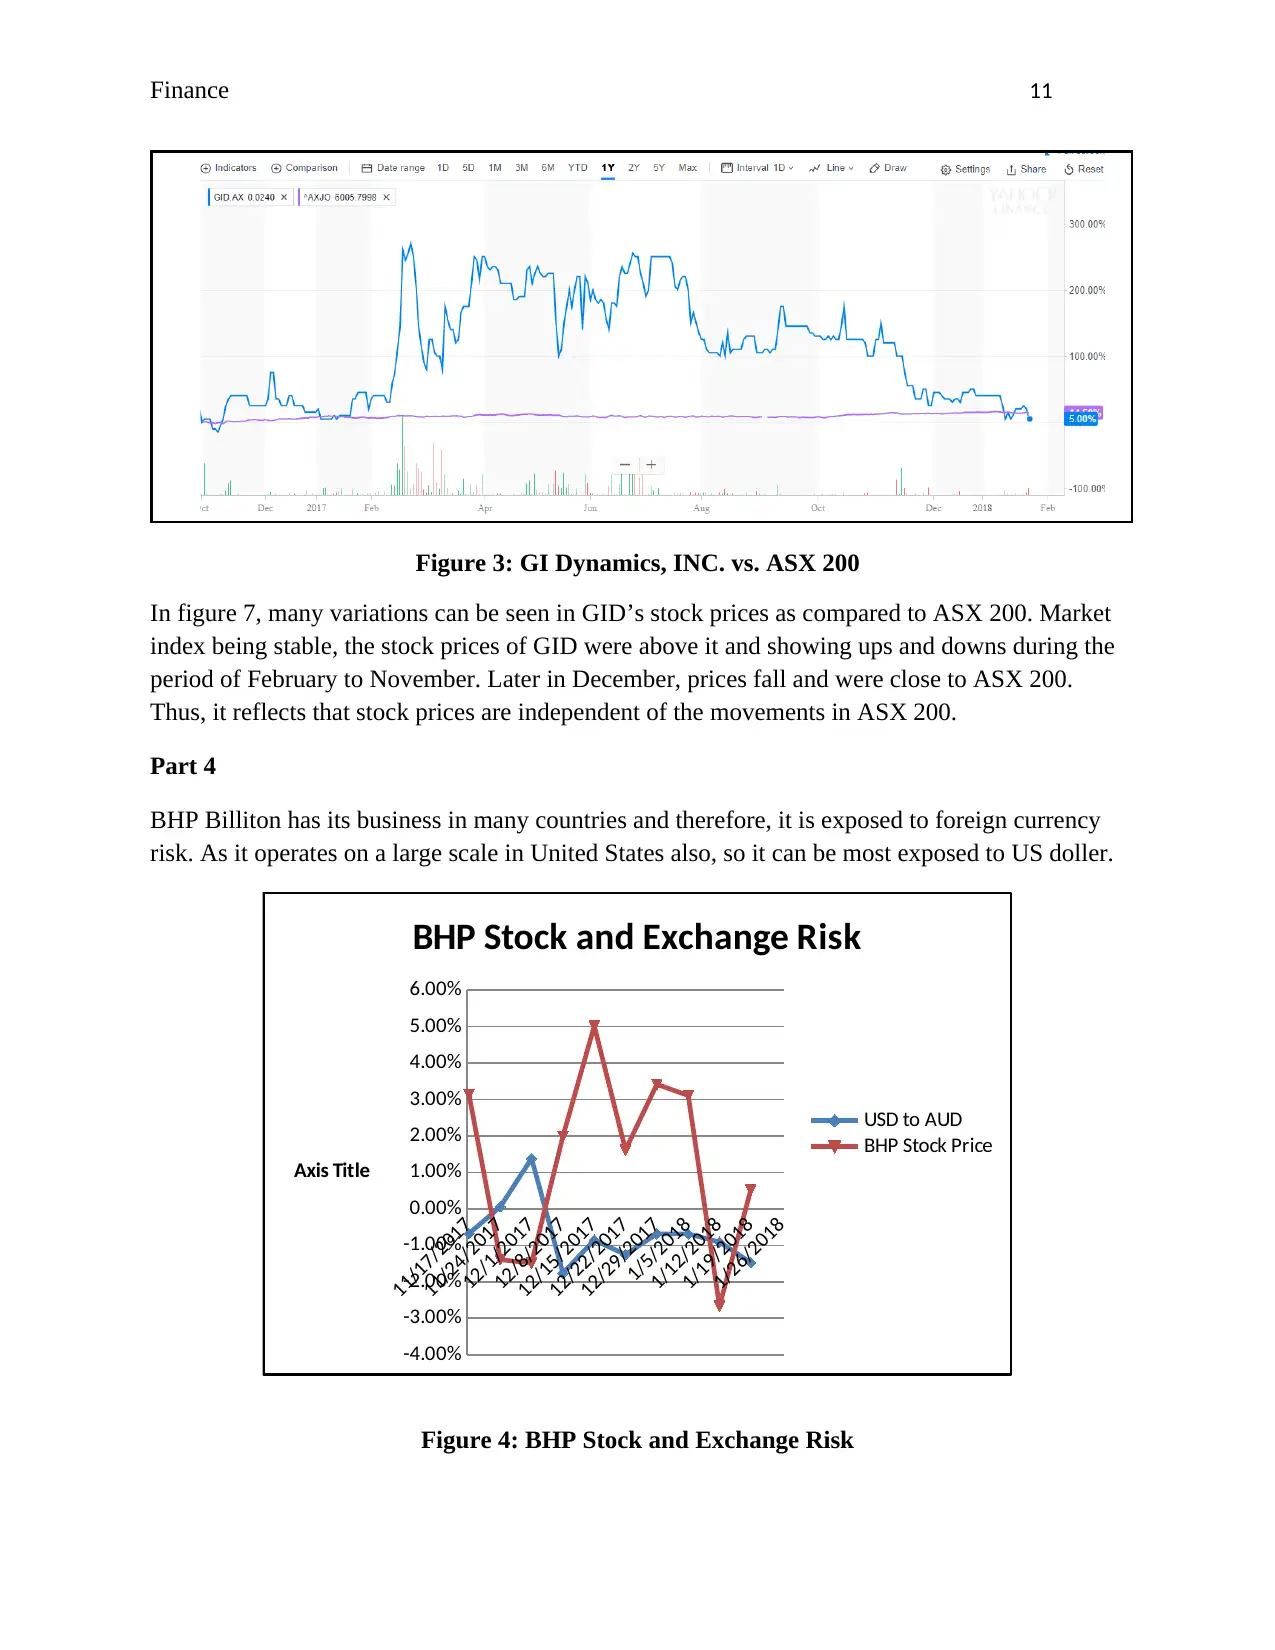
Figure 3: GI Dynamics, INC. vs. ASX 200
In figure 7, many variations can be seen in GID’s stock prices as compared to ASX 200. Market
index being stable, the stock prices of GID were above it and showing ups and downs during the
period of February to November. Later in December, prices fall and were close to ASX 200.
Thus, it reflects that stock prices are independent of the movements in ASX 200.
Part 4
BHP Billiton has its business in many countries and therefore, it is exposed to foreign currency
risk. As it operates on a large scale in United States also, so it can be most exposed to US doller.
11/17/2017
11/24/2017
12/1/2017
12/8/2017
12/15/2017
12/22/2017
12/29/2017
1/5/2018
1/12/2018
1/19/2018
1/26/2018
-4.00%
-3.00%
-2.00%
-1.00%
0.00%
1.00%
2.00%
3.00%
4.00%
5.00%
6.00%
BHP Stock and Exchange Risk
USD to AUD
BHP Stock Price
Axis Title
Figure 4: BHP Stock and Exchange Risk
⊘ This is a preview!⊘
Do you want full access?
Subscribe today to unlock all pages.
Trusted by 1+ million students worldwide
1 out of 16


Your All-in-One AI-Powered Toolkit for Academic Success.
+13062052269
info@desklib.com
Available 24*7 on WhatsApp / Email
![[object Object]](/_next/static/media/star-bottom.7253800d.svg)
Unlock your academic potential
Copyright © 2020–2026 A2Z Services. All Rights Reserved. Developed and managed by ZUCOL.