Fina2006: Principles of Finance - Investment, Risk & Return Analysis
VerifiedAdded on 2023/06/12
|12
|803
|416
Presentation
AI Summary
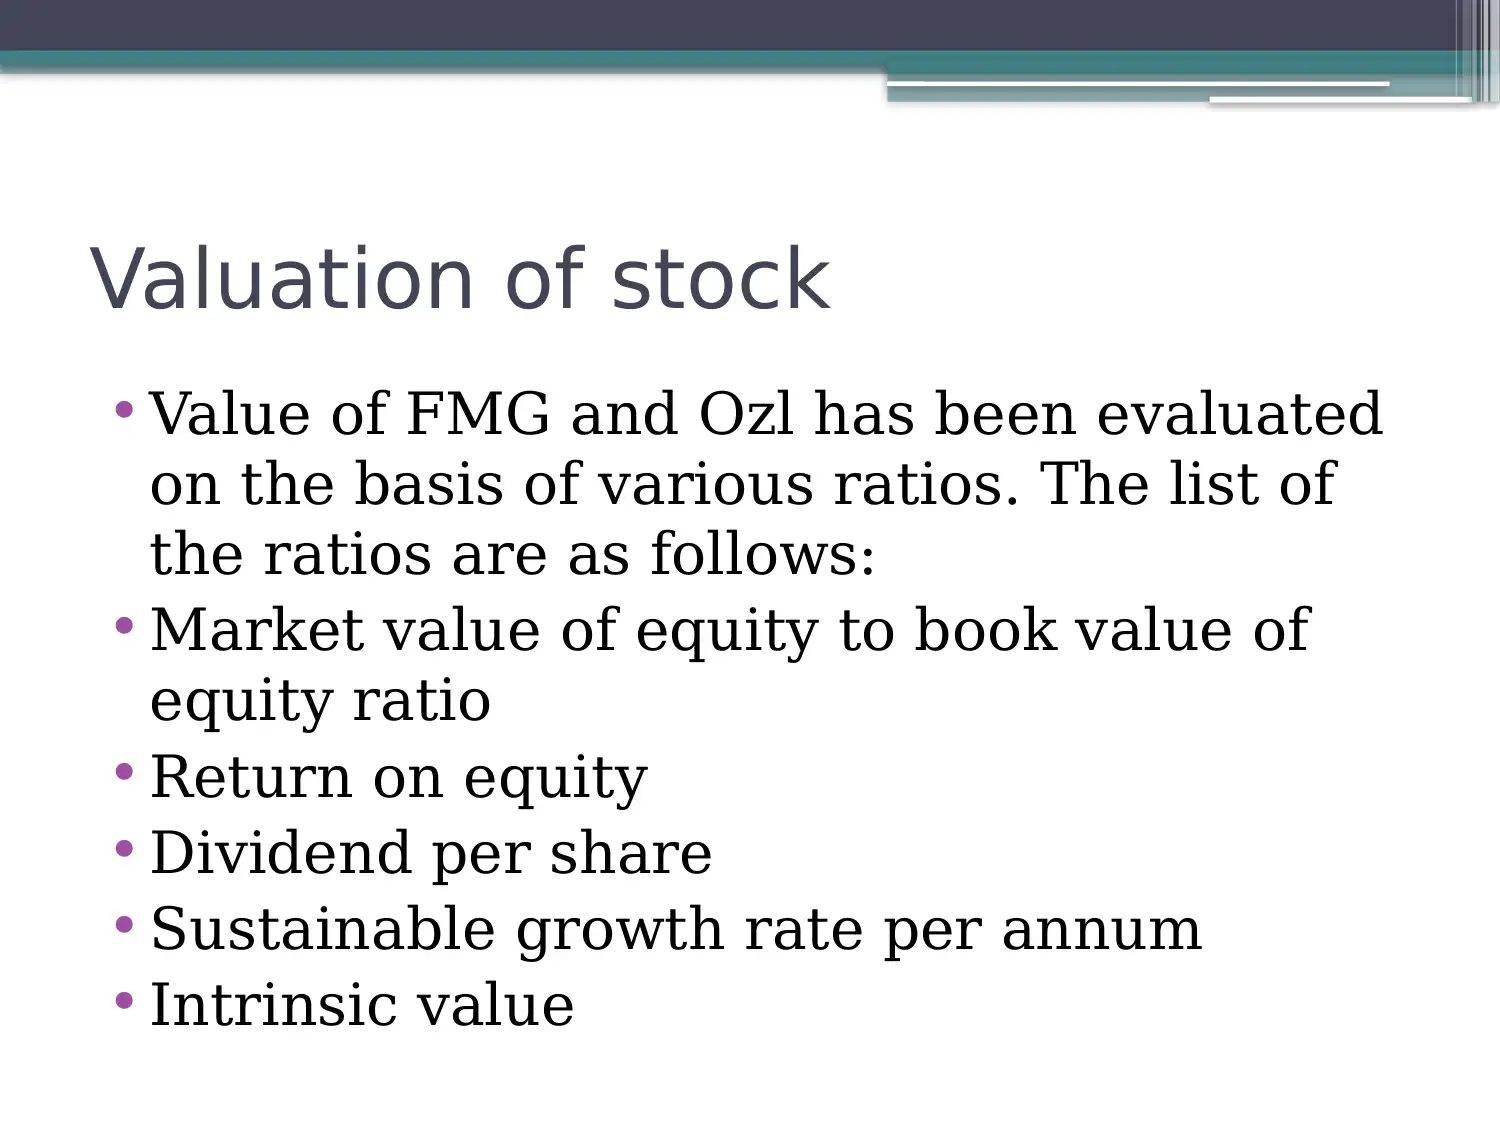
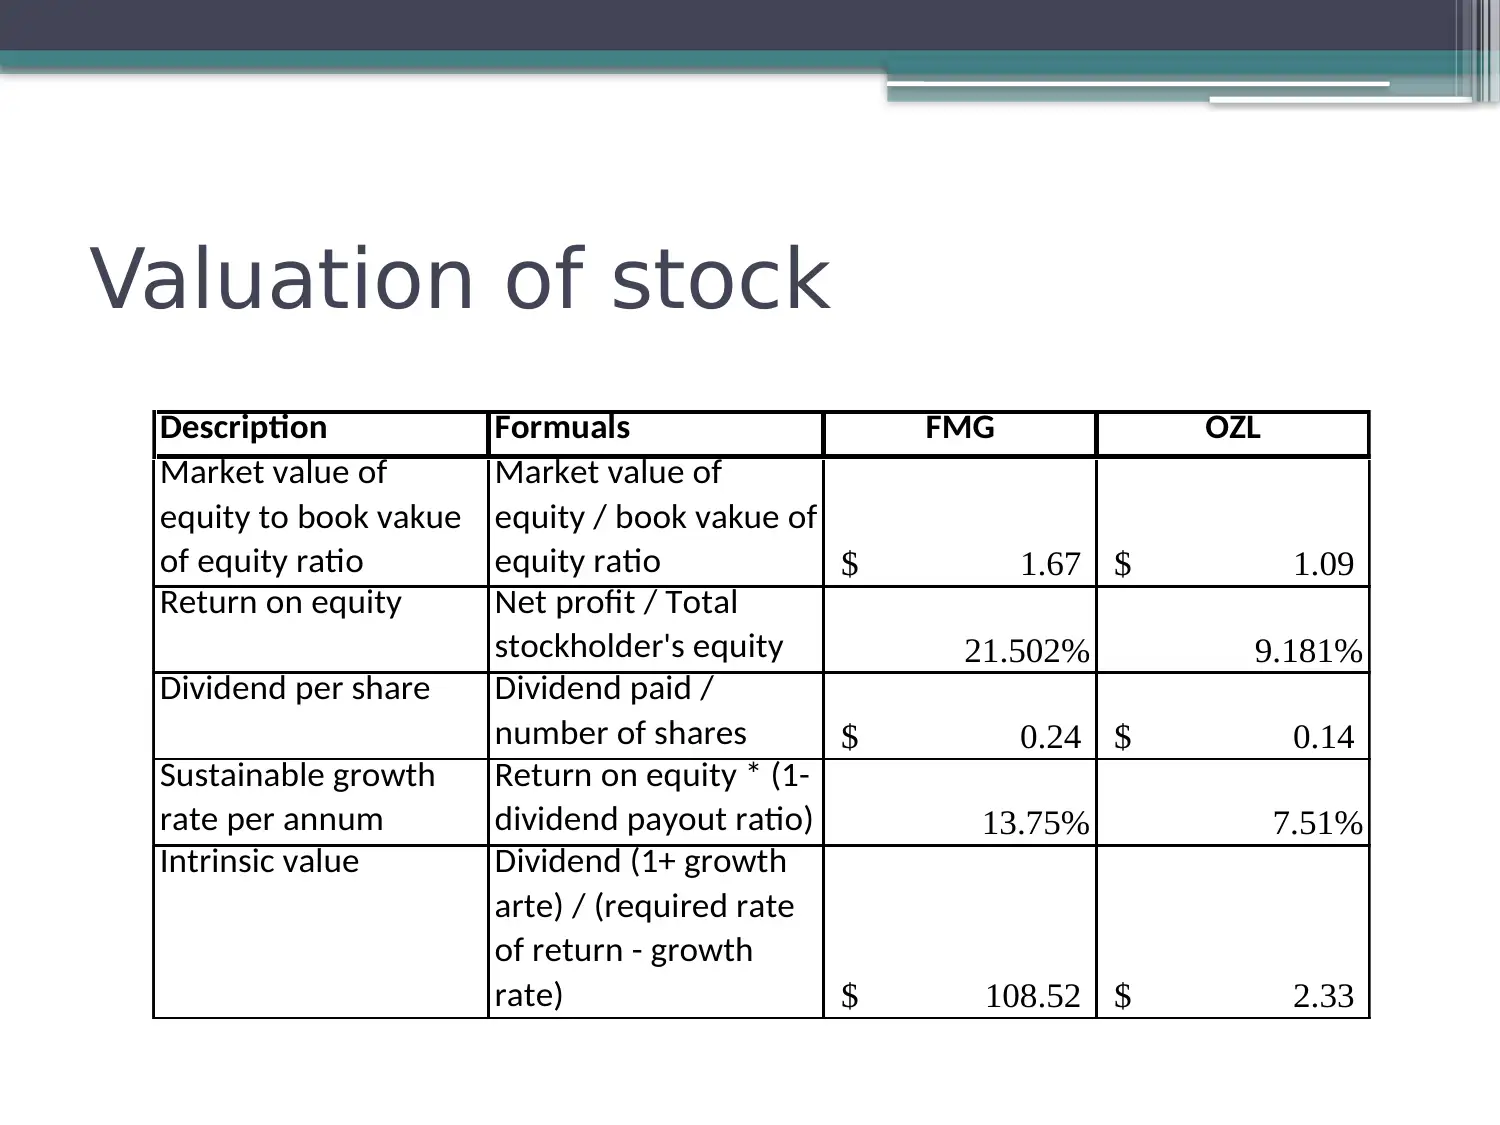
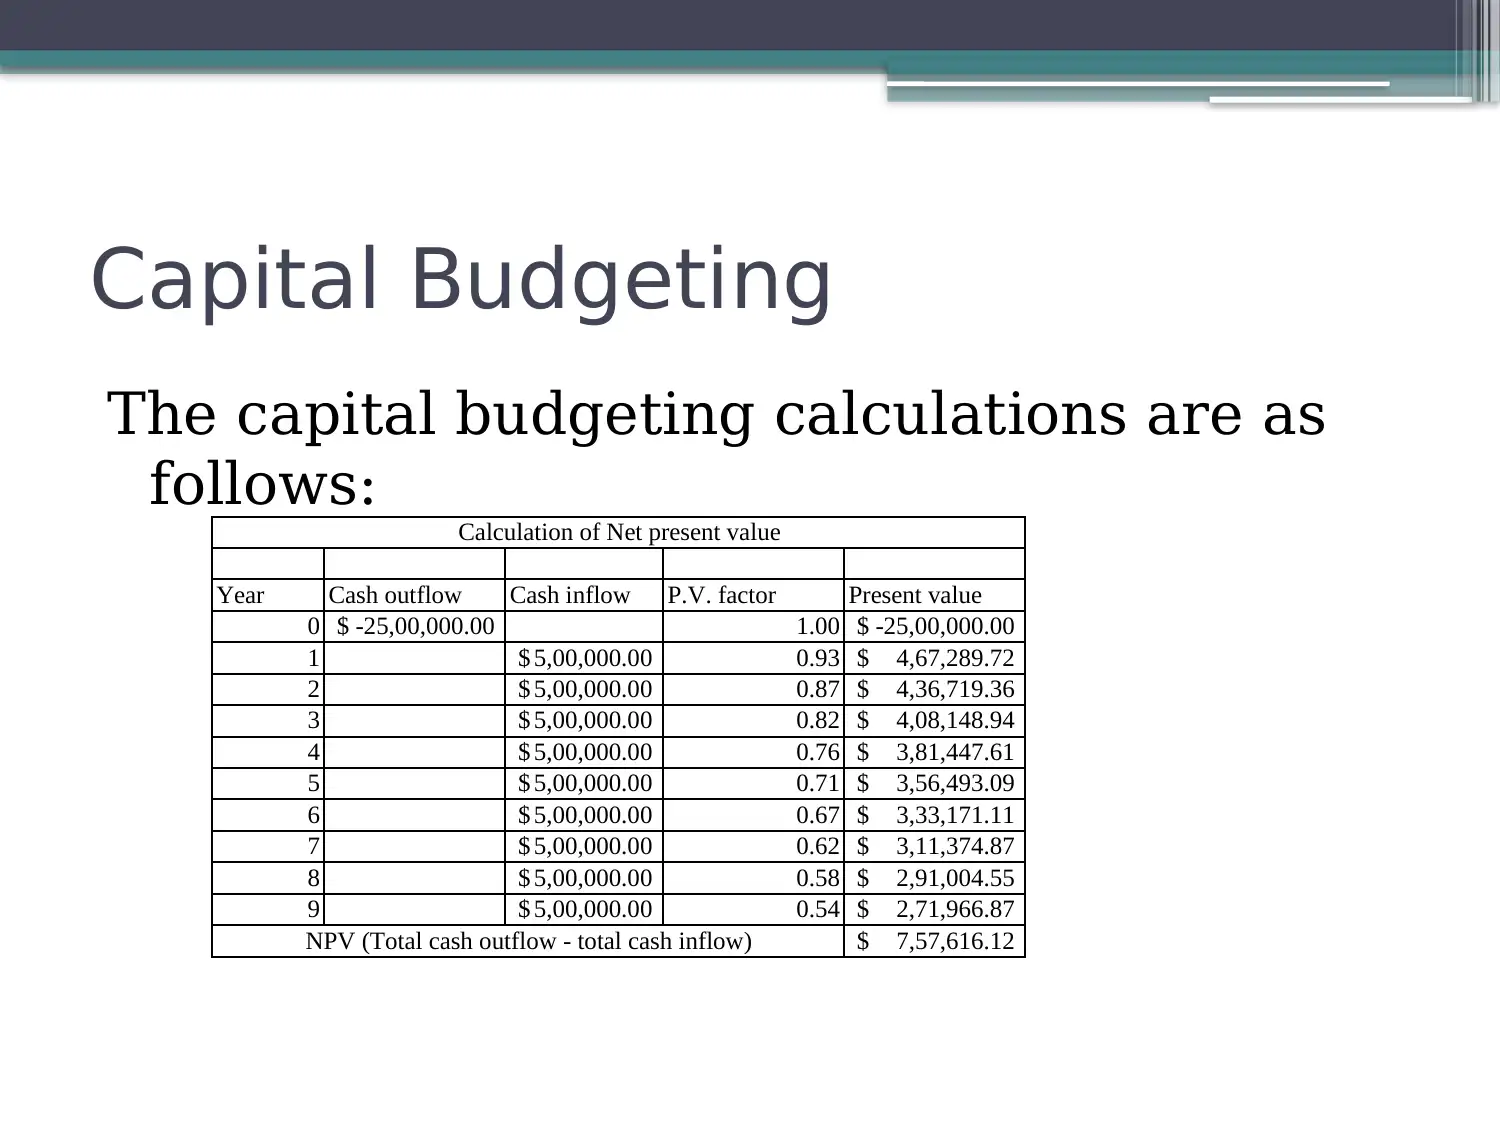
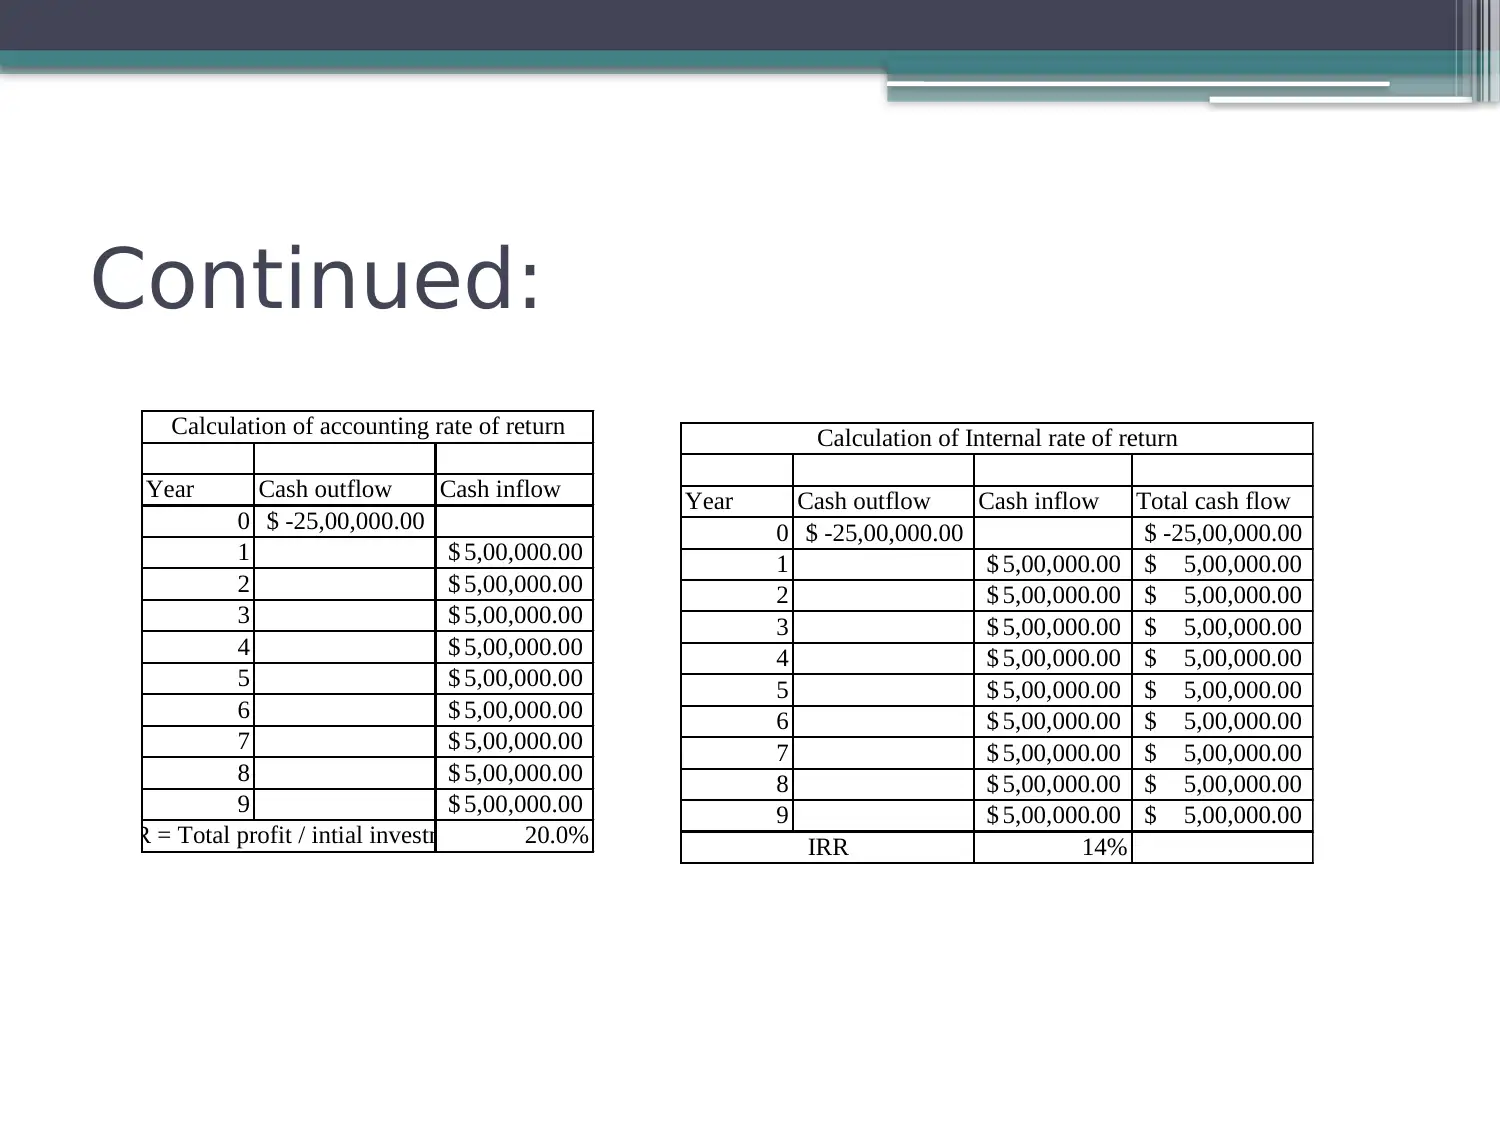
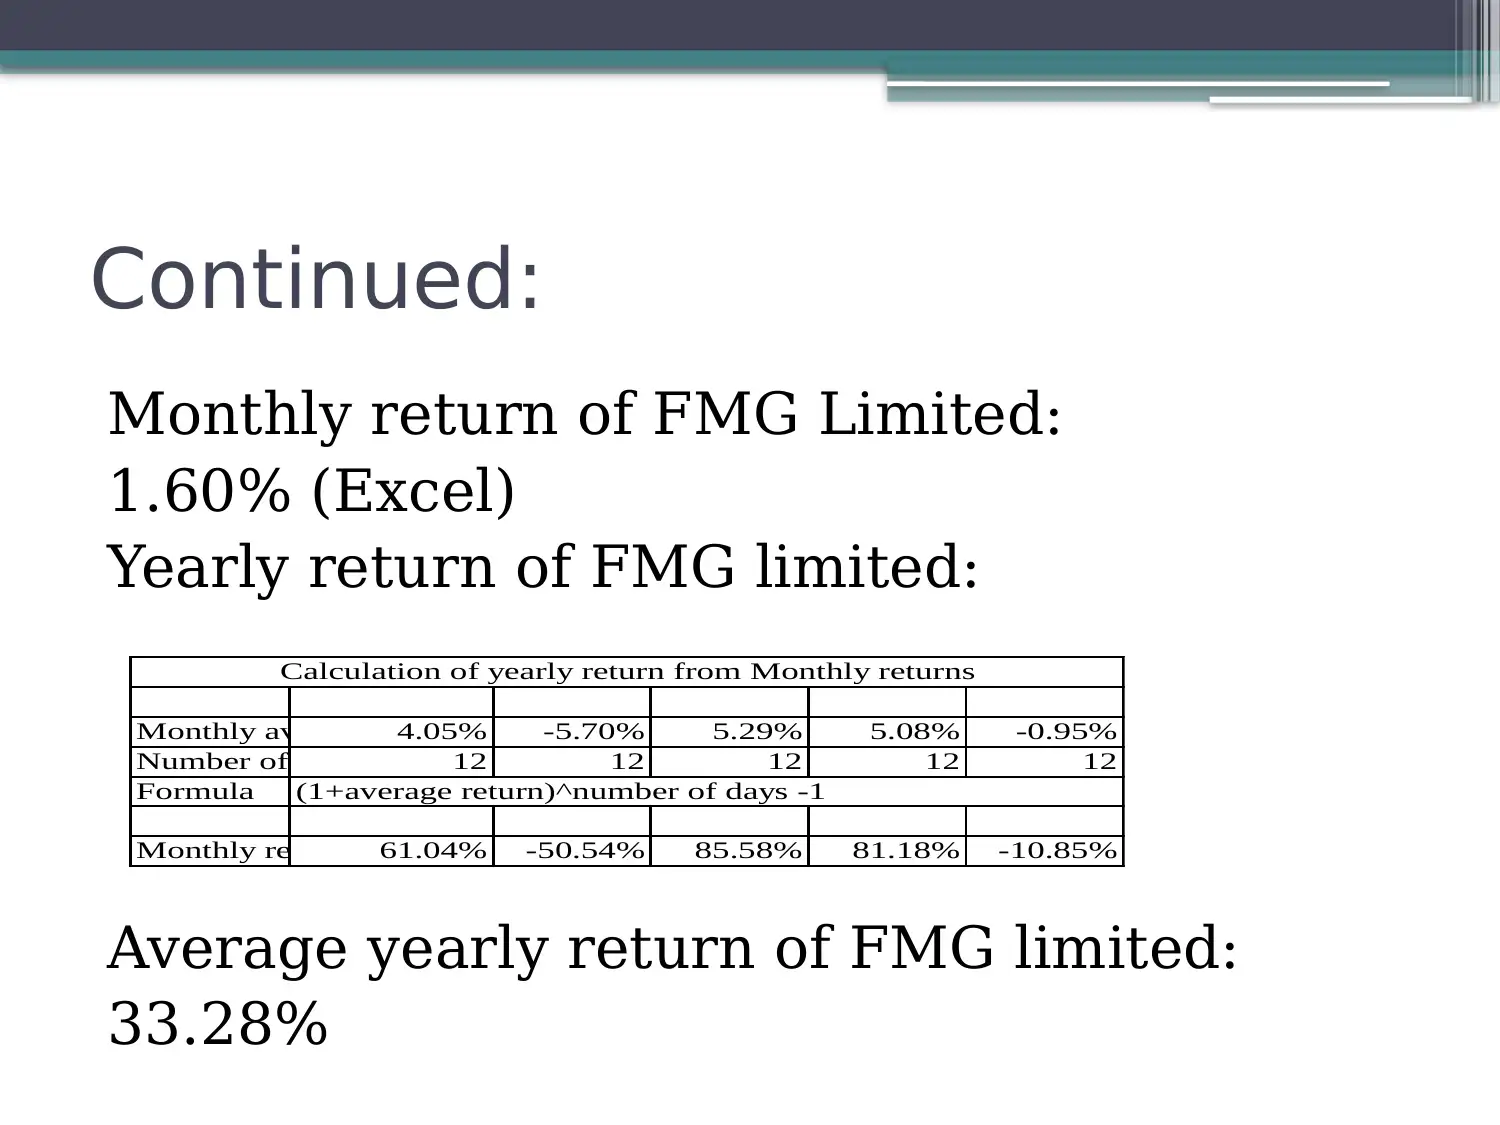
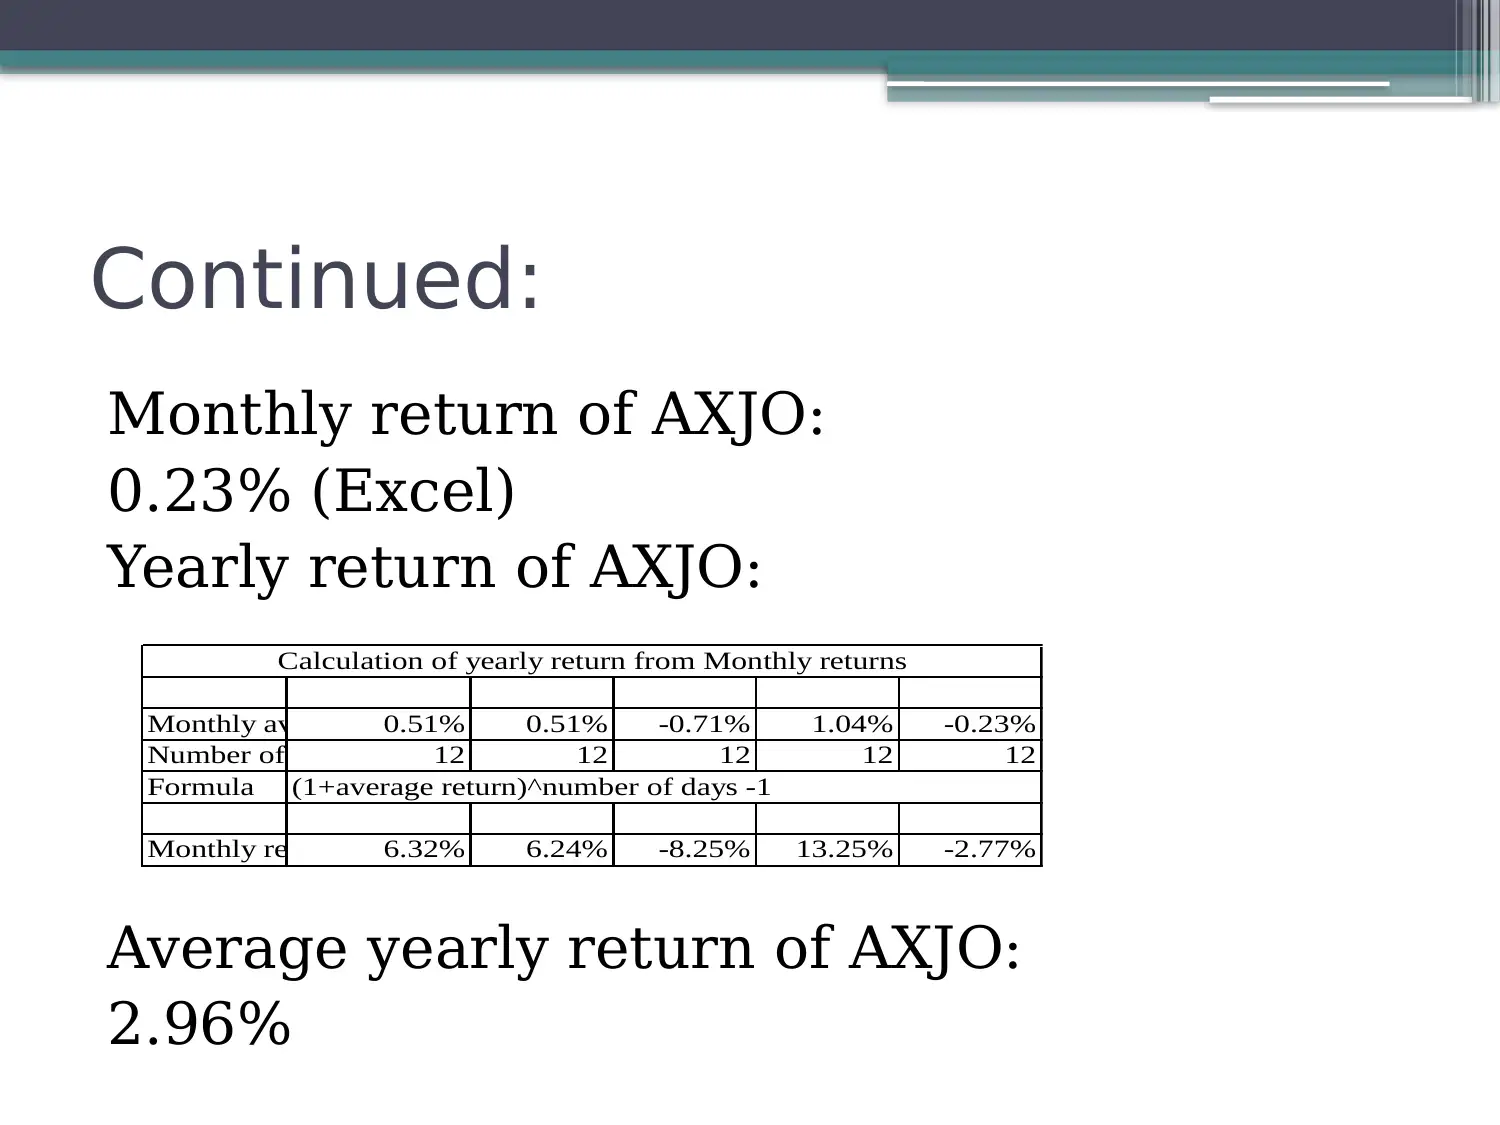
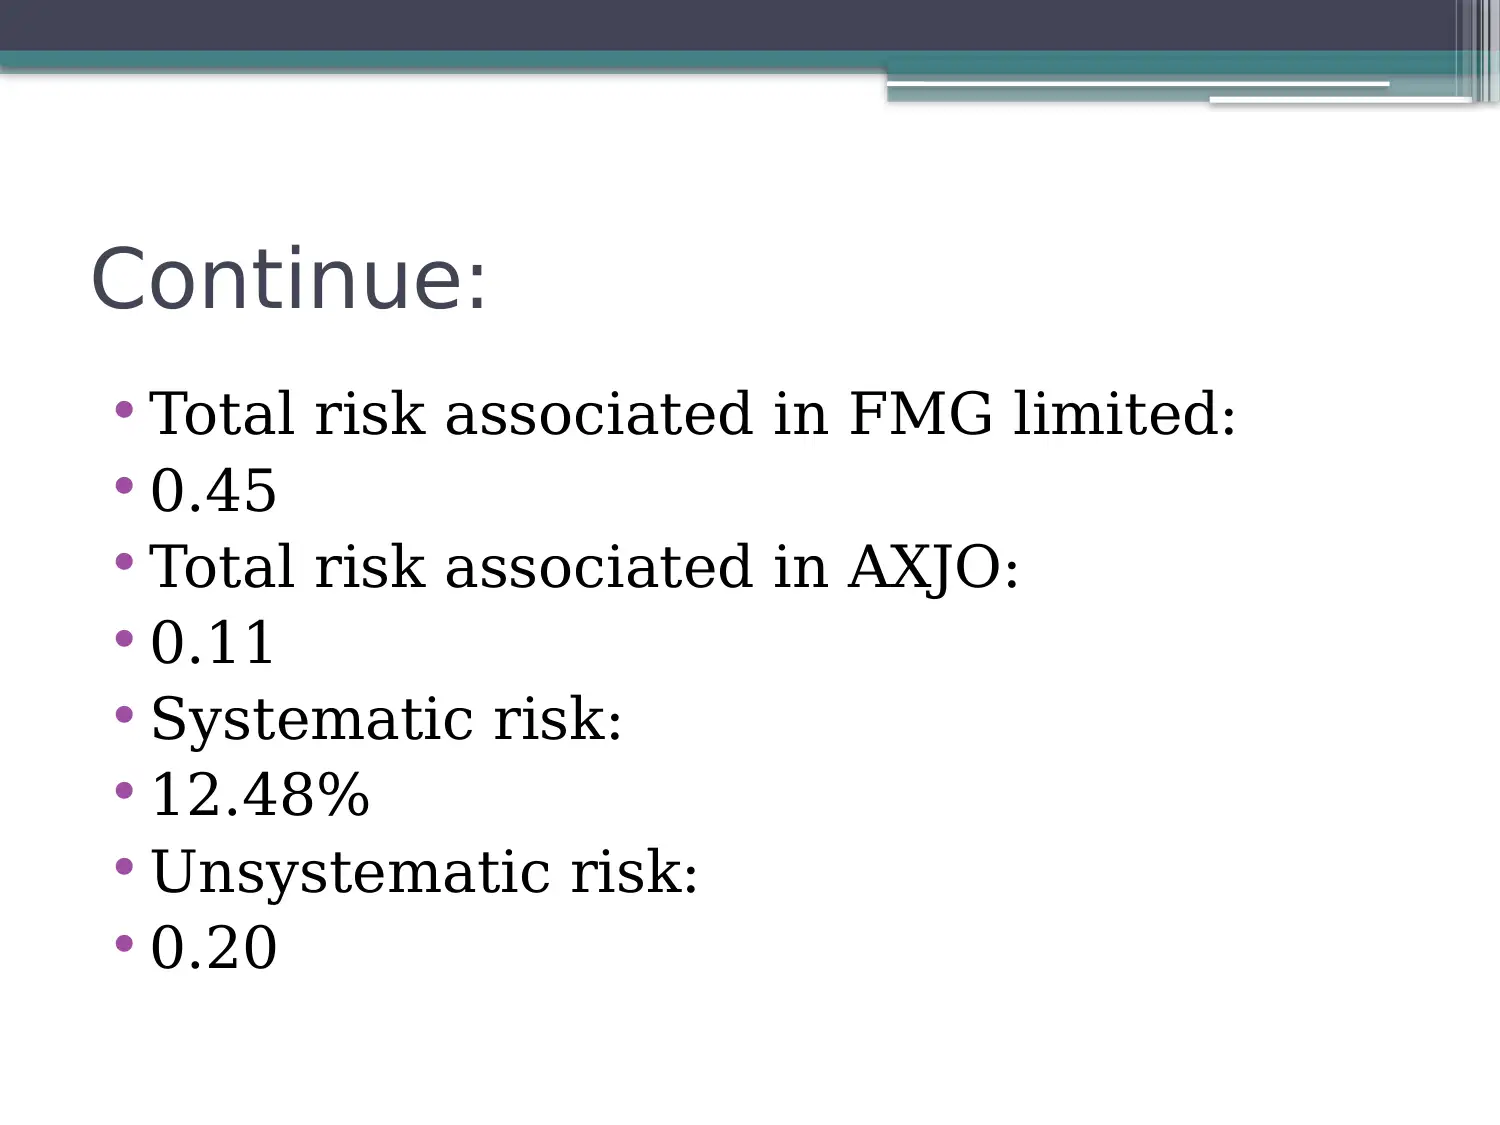
This presentation focuses on stock valuation, capital budgeting analysis, and risk and return analysis. It evaluates the value of FMG and OZL using ratios like market value of equity to book value, return on equity, dividend per share, and sustainable growth rate. Capital budgeting calculations include net present value (NPV), accounting rate of return (ARR), and internal rate of return (IRR). Risk and return analysis assesses the total return and associated risk of a security, with monthly and yearly returns calculated for FMG Limited and AXJO. The presentation concludes that investors should consider investing in FMG Limited for potentially greater returns. Desklib offers a platform for students to access this and other solved assignments.

Finance
Student’s Name
Student’s Name
Paraphrase This Document
Need a fresh take? Get an instant paraphrase of this document with our AI Paraphraser

Introduction
The main focus of this presentation is on
the following topics:
• Valuation of stock
• Capital budgeting analysis
• Risk and return analysis
The main focus of this presentation is on
the following topics:
• Valuation of stock
• Capital budgeting analysis
• Risk and return analysis

Valuation of stock
• Value of FMG and Ozl has been evaluated
on the basis of various ratios. The list of
the ratios are as follows:
• Market value of equity to book value of
equity ratio
• Return on equity
• Dividend per share
• Sustainable growth rate per annum
• Intrinsic value
• Value of FMG and Ozl has been evaluated
on the basis of various ratios. The list of
the ratios are as follows:
• Market value of equity to book value of
equity ratio
• Return on equity
• Dividend per share
• Sustainable growth rate per annum
• Intrinsic value
⊘ This is a preview!⊘
Do you want full access?
Subscribe today to unlock all pages.

Trusted by 1+ million students worldwide

Valuation of stock
Description Formuals FMG OZL
Market value of
equity to book vakue
of equity ratio
Market value of
equity / book vakue of
equity ratio 1.67$ 1.09$
Return on equity Net profit / Total
stockholder's equity 21.502% 9.181%
Dividend per share Dividend paid /
number of shares 0.24$ 0.14$
Sustainable growth
rate per annum
Return on equity * (1-
dividend payout ratio) 13.75% 7.51%
Intrinsic value Dividend (1+ growth
arte) / (required rate
of return - growth
rate) 108.52$ 2.33$
Paraphrase This Document
Need a fresh take? Get an instant paraphrase of this document with our AI Paraphraser

Capital Budgeting
The capital budgeting calculations are as
follows:
Year Cash outflow Cash inflow P.V. factor Present value
0 -25,00,000.00$ 1.00 -25,00,000.00$
1 5,00,000.00$ 0.93 4,67,289.72$
2 5,00,000.00$ 0.87 4,36,719.36$
3 5,00,000.00$ 0.82 4,08,148.94$
4 5,00,000.00$ 0.76 3,81,447.61$
5 5,00,000.00$ 0.71 3,56,493.09$
6 5,00,000.00$ 0.67 3,33,171.11$
7 5,00,000.00$ 0.62 3,11,374.87$
8 5,00,000.00$ 0.58 2,91,004.55$
9 5,00,000.00$ 0.54 2,71,966.87$
7,57,616.12$
Calculation of Net present value
NPV (Total cash outflow - total cash inflow)

Continued:
Year Cash outflow Cash inflow
0 -25,00,000.00$
1 5,00,000.00$
2 5,00,000.00$
3 5,00,000.00$
4 5,00,000.00$
5 5,00,000.00$
6 5,00,000.00$
7 5,00,000.00$
8 5,00,000.00$
9 5,00,000.00$
20.0%
Calculation of accounting rate of return
ARR = Total profit / intial investment
Year Cash outflow Cash inflow Total cash flow
0 -25,00,000.00$ -25,00,000.00$
1 5,00,000.00$ 5,00,000.00$
2 5,00,000.00$ 5,00,000.00$
3 5,00,000.00$ 5,00,000.00$
4 5,00,000.00$ 5,00,000.00$
5 5,00,000.00$ 5,00,000.00$
6 5,00,000.00$ 5,00,000.00$
7 5,00,000.00$ 5,00,000.00$
8 5,00,000.00$ 5,00,000.00$
9 5,00,000.00$ 5,00,000.00$
14%IRR
Calculation of Internal rate of return
⊘ This is a preview!⊘
Do you want full access?
Subscribe today to unlock all pages.

Trusted by 1+ million students worldwide

Risk and Return
Risk and return is a tool which evaluates
about the total return and the total
associated risk of a security. It explains
that whether the project should be
accepted by the company or not.
Risk and return is a tool which evaluates
about the total return and the total
associated risk of a security. It explains
that whether the project should be
accepted by the company or not.
Paraphrase This Document
Need a fresh take? Get an instant paraphrase of this document with our AI Paraphraser

Continued:
Monthly return of FMG Limited:
1.60% (Excel)
Yearly return of FMG limited:
Average yearly return of FMG limited:
33.28%
Monthly average retun of security4.05% -5.70% 5.29% 5.08% -0.95%
Number of days in a month12 12 12 12 12
Formula
Monthly return 61.04% -50.54% 85.58% 81.18% -10.85%
Calculation of yearly return from Monthly returns
(1+average return)^number of days -1

Continued:
Monthly return of AXJO:
0.23% (Excel)
Yearly return of AXJO:
Average yearly return of AXJO:
2.96%
Monthly average retun of security0.51% 0.51% -0.71% 1.04% -0.23%
Number of days in a month12 12 12 12 12
Formula
Monthly return 6.32% 6.24% -8.25% 13.25% -2.77%
Calculation of yearly return from Monthly returns
(1+average return)^number of days -1
⊘ This is a preview!⊘
Do you want full access?
Subscribe today to unlock all pages.

Trusted by 1+ million students worldwide

Continue:
• Total risk associated in FMG limited:
• 0.45
• Total risk associated in AXJO:
• 0.11
• Systematic risk:
• 12.48%
• Unsystematic risk:
• 0.20
• Total risk associated in FMG limited:
• 0.45
• Total risk associated in AXJO:
• 0.11
• Systematic risk:
• 12.48%
• Unsystematic risk:
• 0.20
Paraphrase This Document
Need a fresh take? Get an instant paraphrase of this document with our AI Paraphraser

Conclusion:
On the basis of the evaluation, it has been
found that the investor should invest into
the FMG limited for the greater returns.
On the basis of the evaluation, it has been
found that the investor should invest into
the FMG limited for the greater returns.

References:
• Felix, E., & Tilley, D. R. (2009). Integrated energy,
environmental and financial analysis of ethanol production
from cellulosic switchgrass. Energy, 34(4), 410-436.
• Nicolaou, A. I., Dehning, B., & Stratopoulos, T. C. (2008).
Financial analysis of potential benefits from ERP systems
adoption.
• Subramanyam, K. R., & Wild, J. J. (2009). Financial
statement analysis. McGraw-Hill.
• Titman, S., Keown, A. J., & Martin, J. D. (2017). Financial
management: Principles and applications. Pearson.
• Vogel, H. L. (2014). Entertainment industry economics: A
guide for financial analysis. Cambridge University Press.
⊘ This is a preview!⊘
Do you want full access?
Subscribe today to unlock all pages.

Trusted by 1+ million students worldwide
1 out of 12
Related Documents

Your All-in-One AI-Powered Toolkit for Academic Success.
+13062052269
info@desklib.com
Available 24*7 on WhatsApp / Email
Unlock your academic potential
Copyright © 2020–2025 A2Z Services. All Rights Reserved. Developed and managed by ZUCOL.