Managerial Finance Report: Ratio Analysis of Tesco & Sainsburry
VerifiedAdded on 2022/12/30
|18
|3767
|40
Report
AI Summary
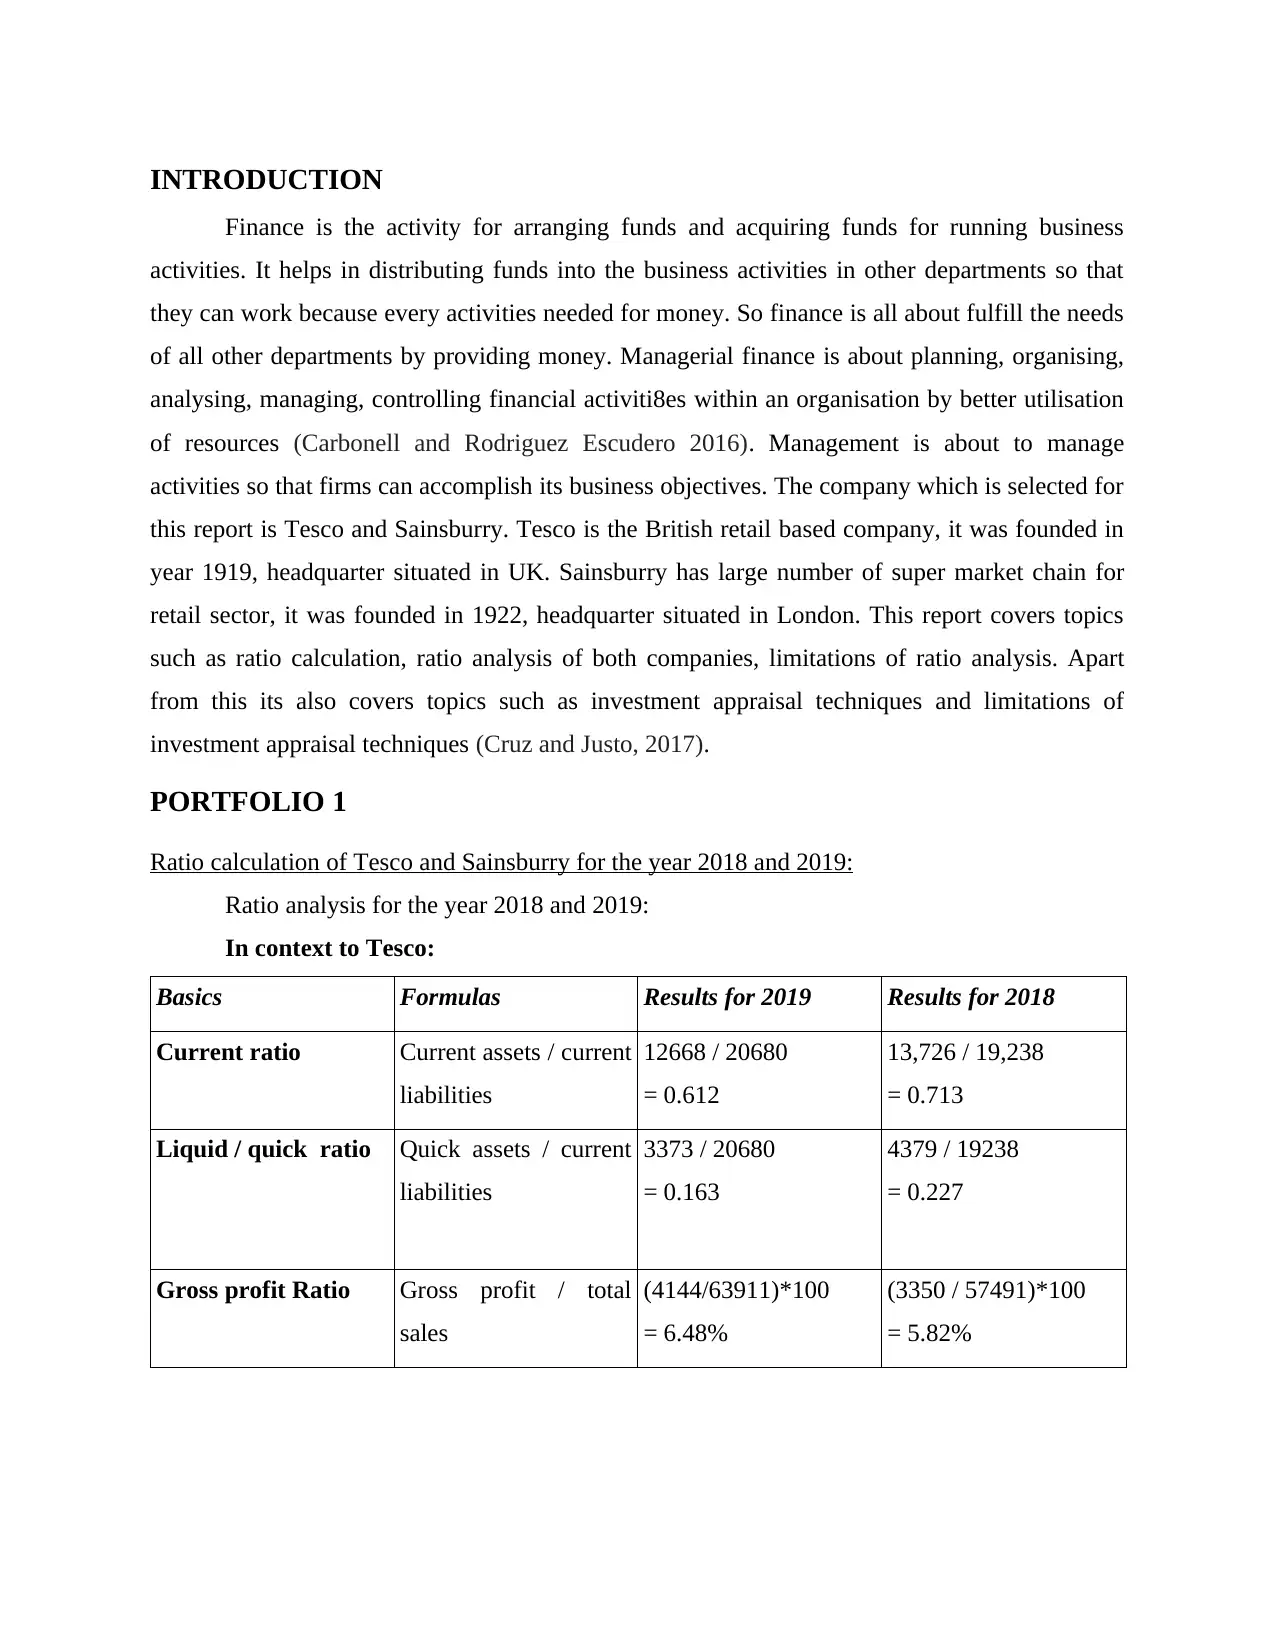
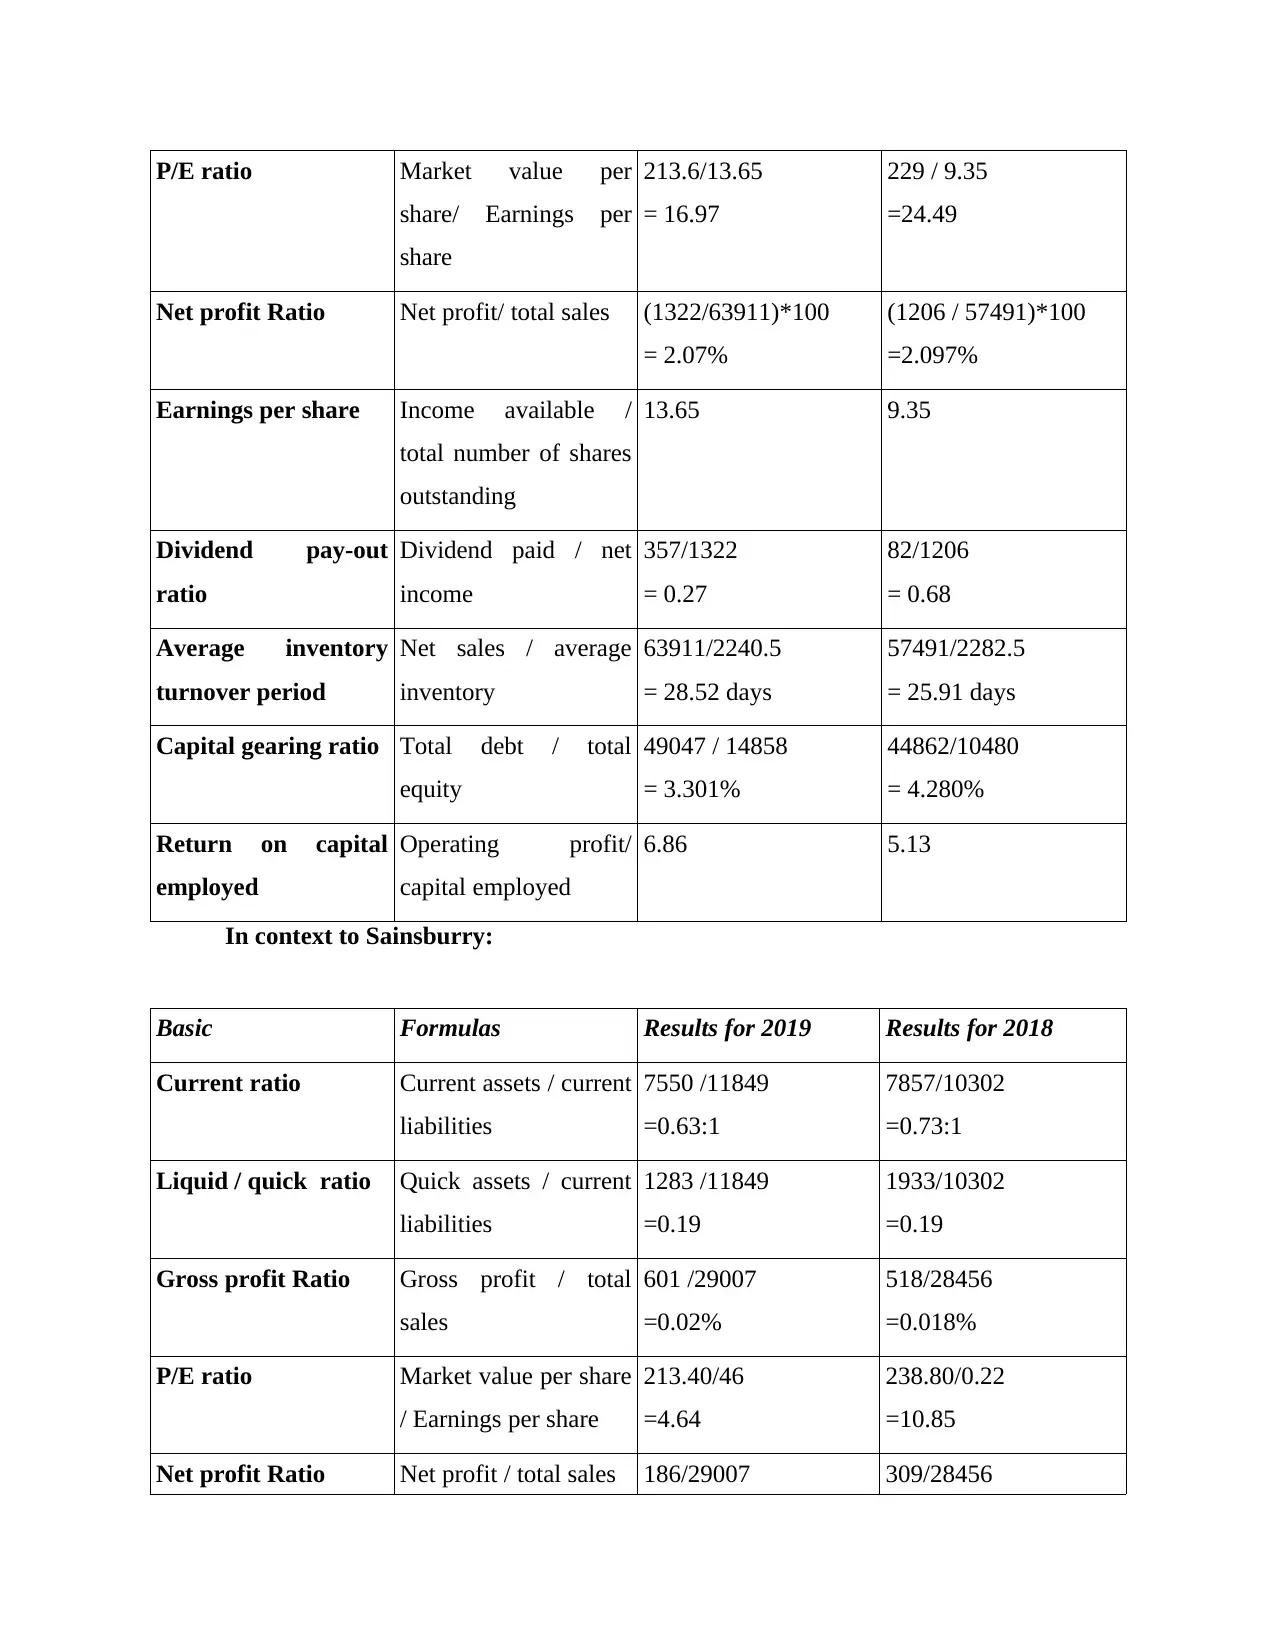
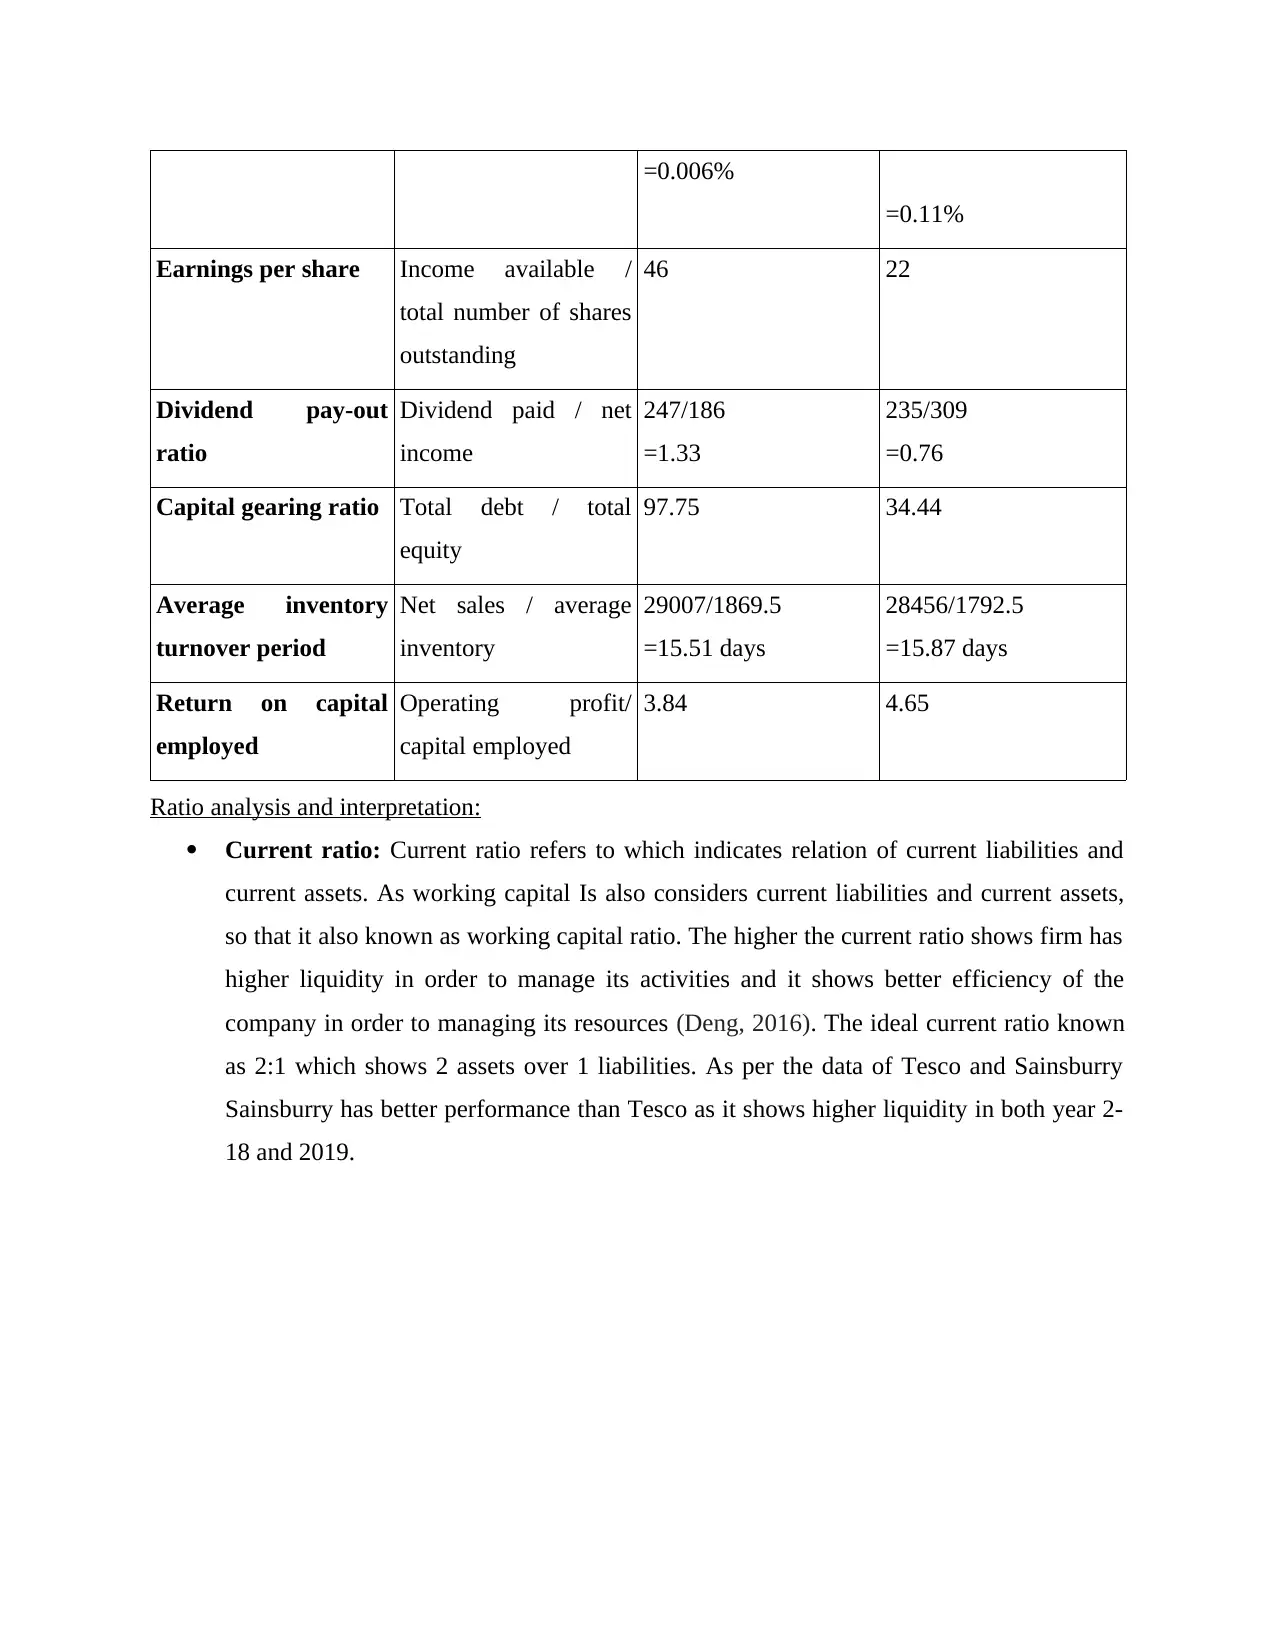
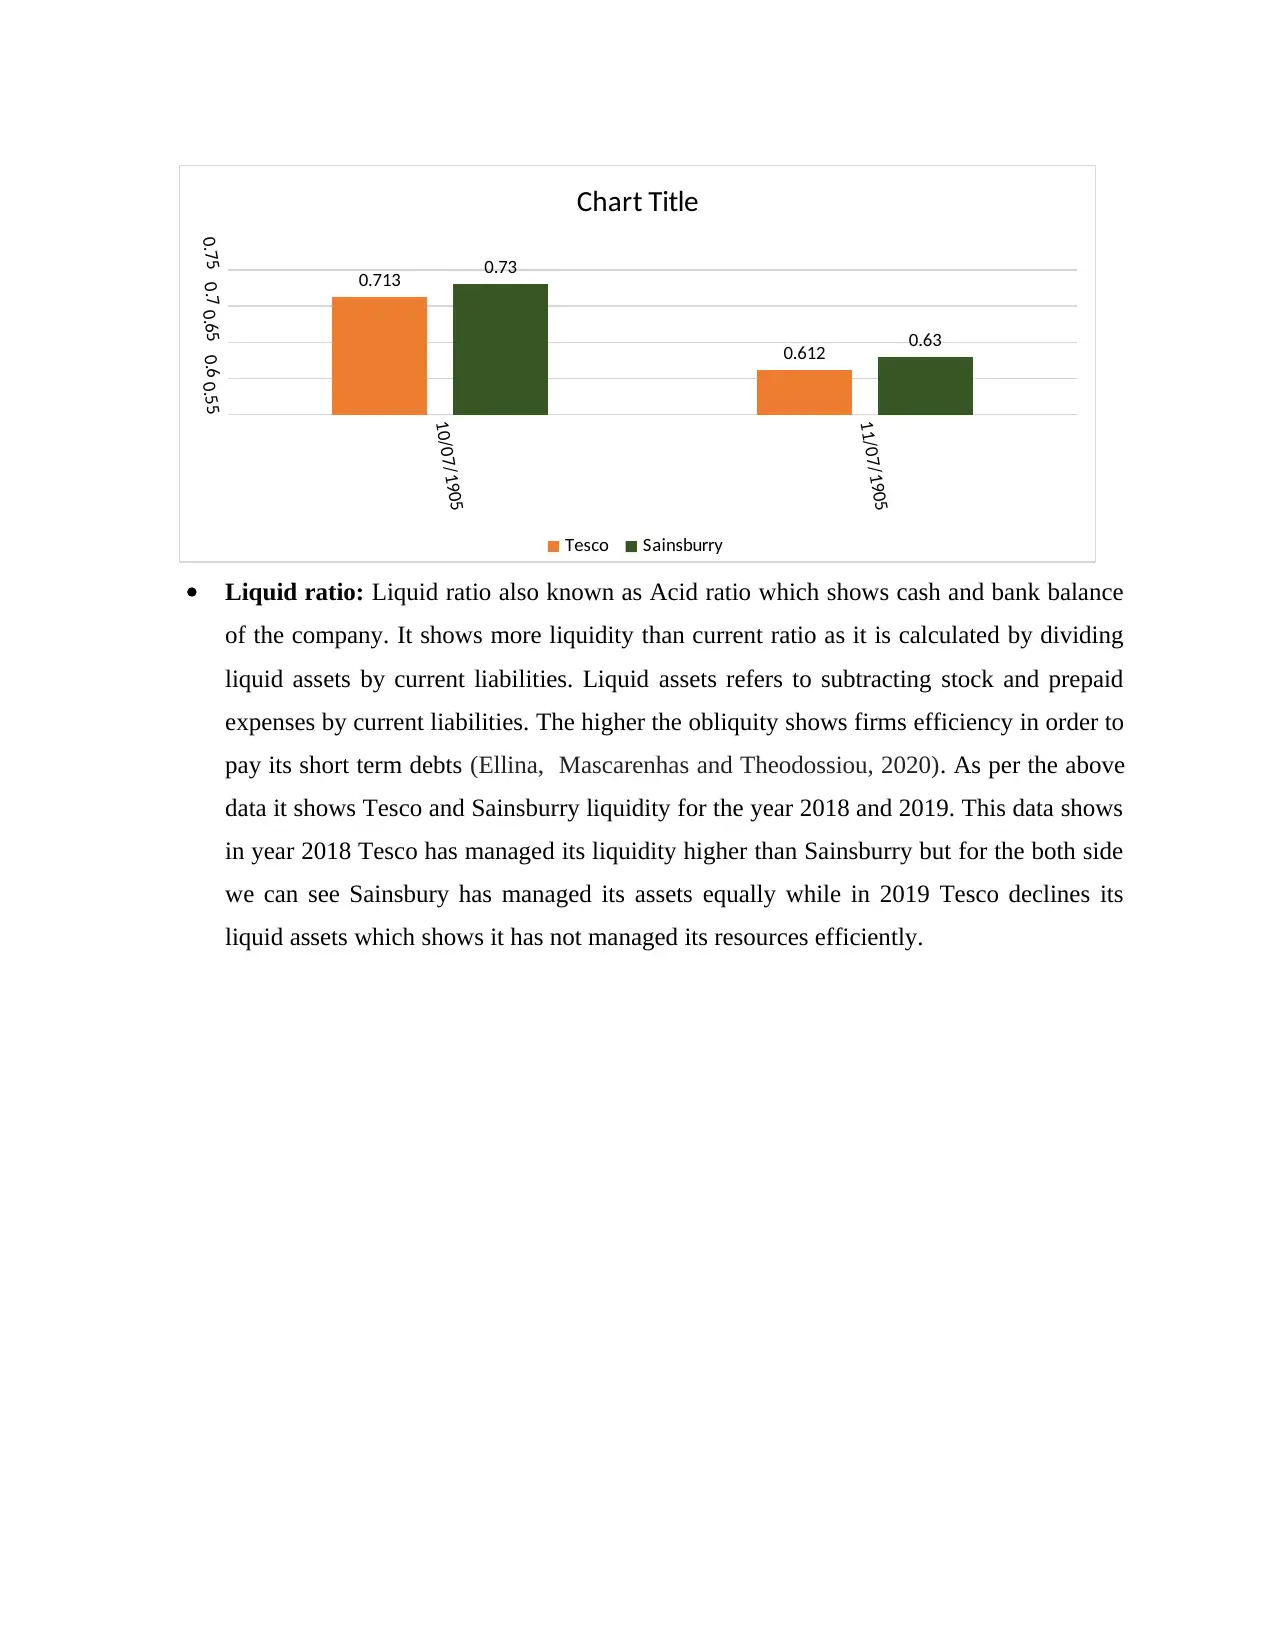
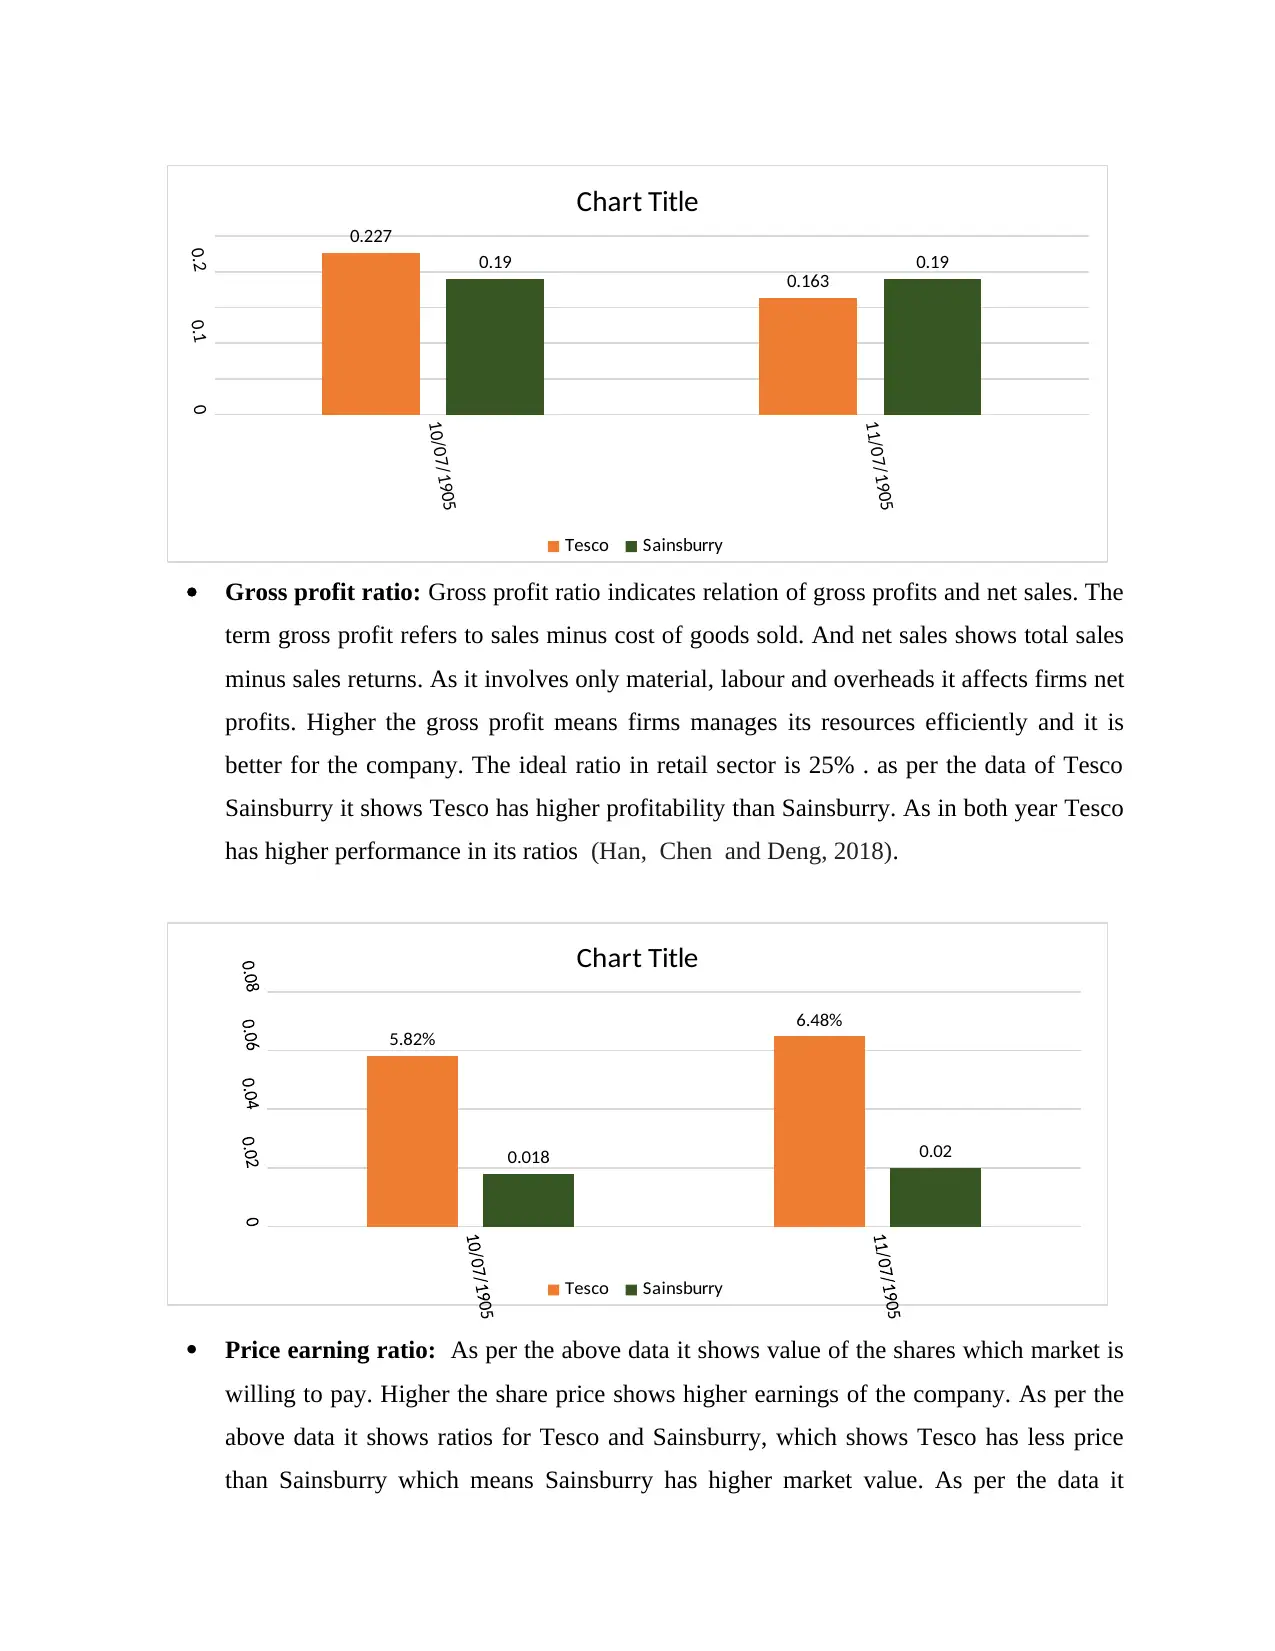
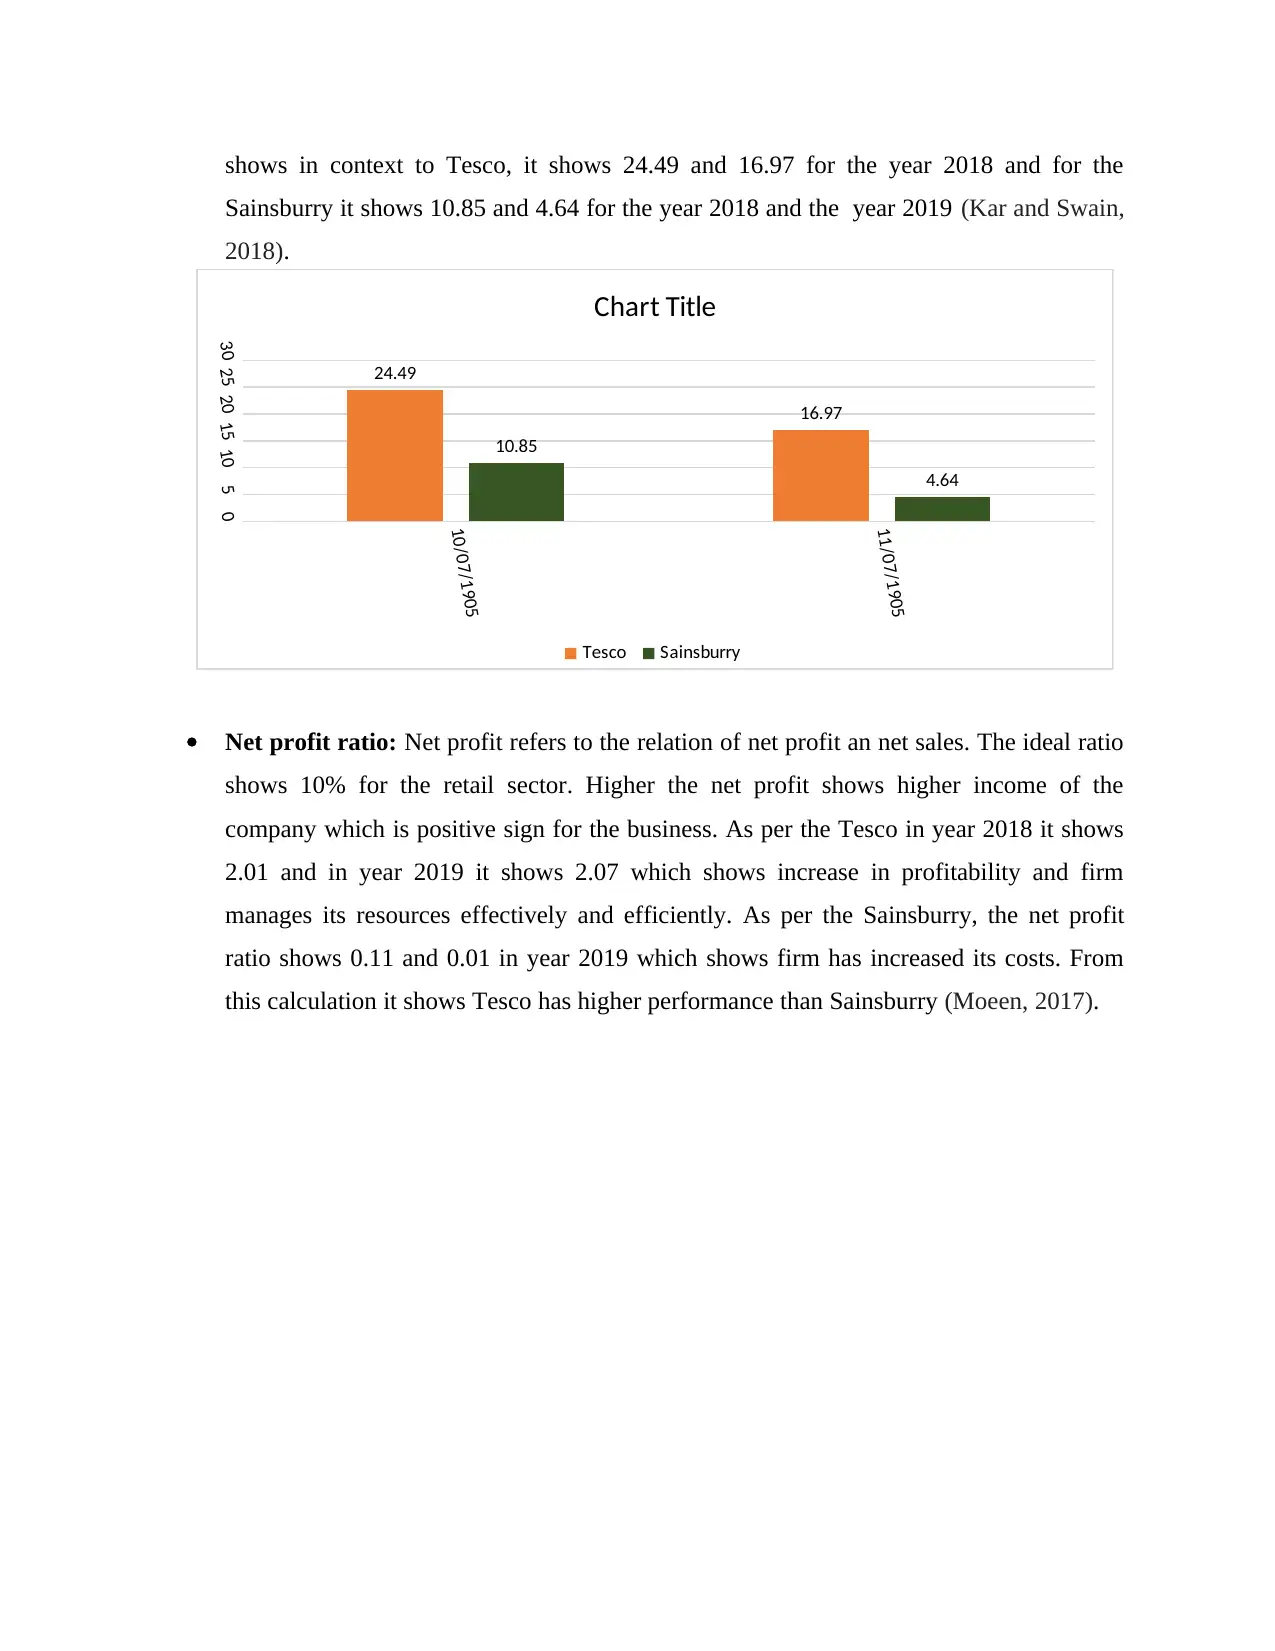
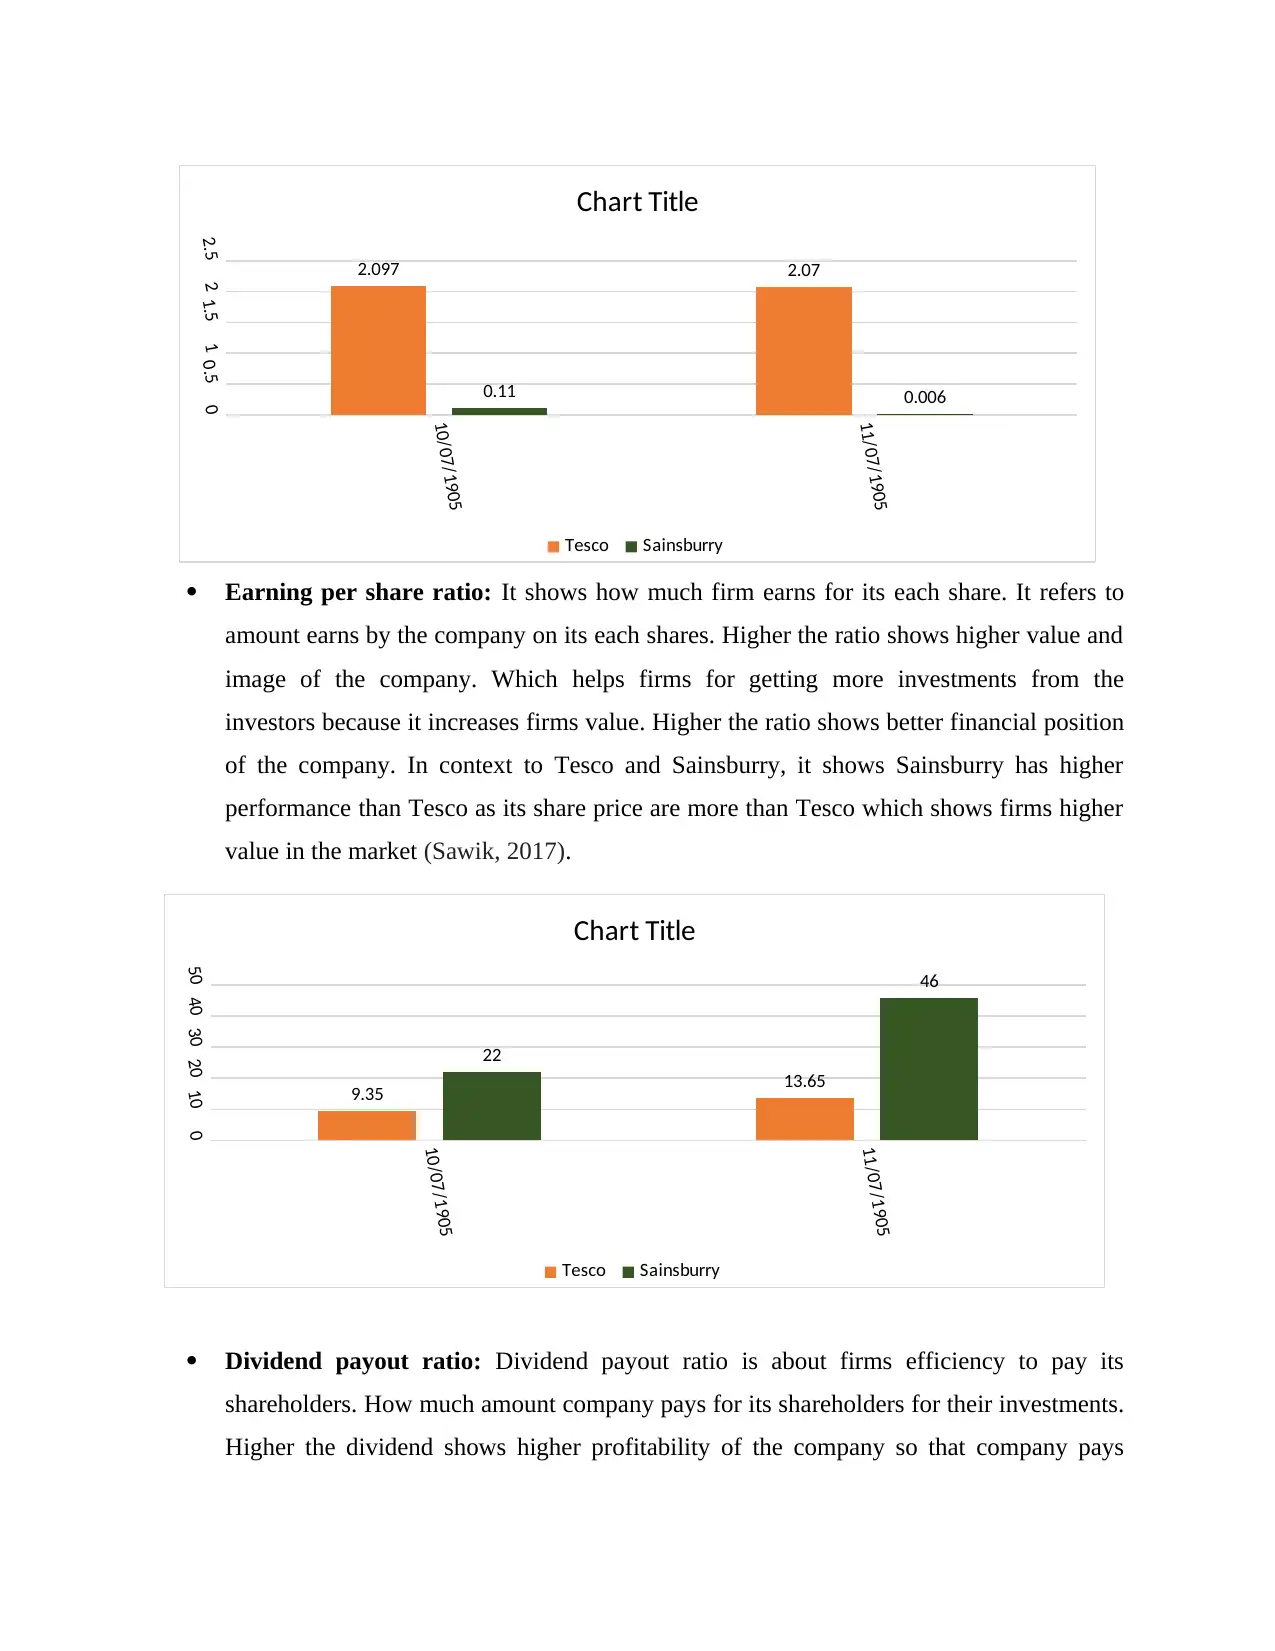
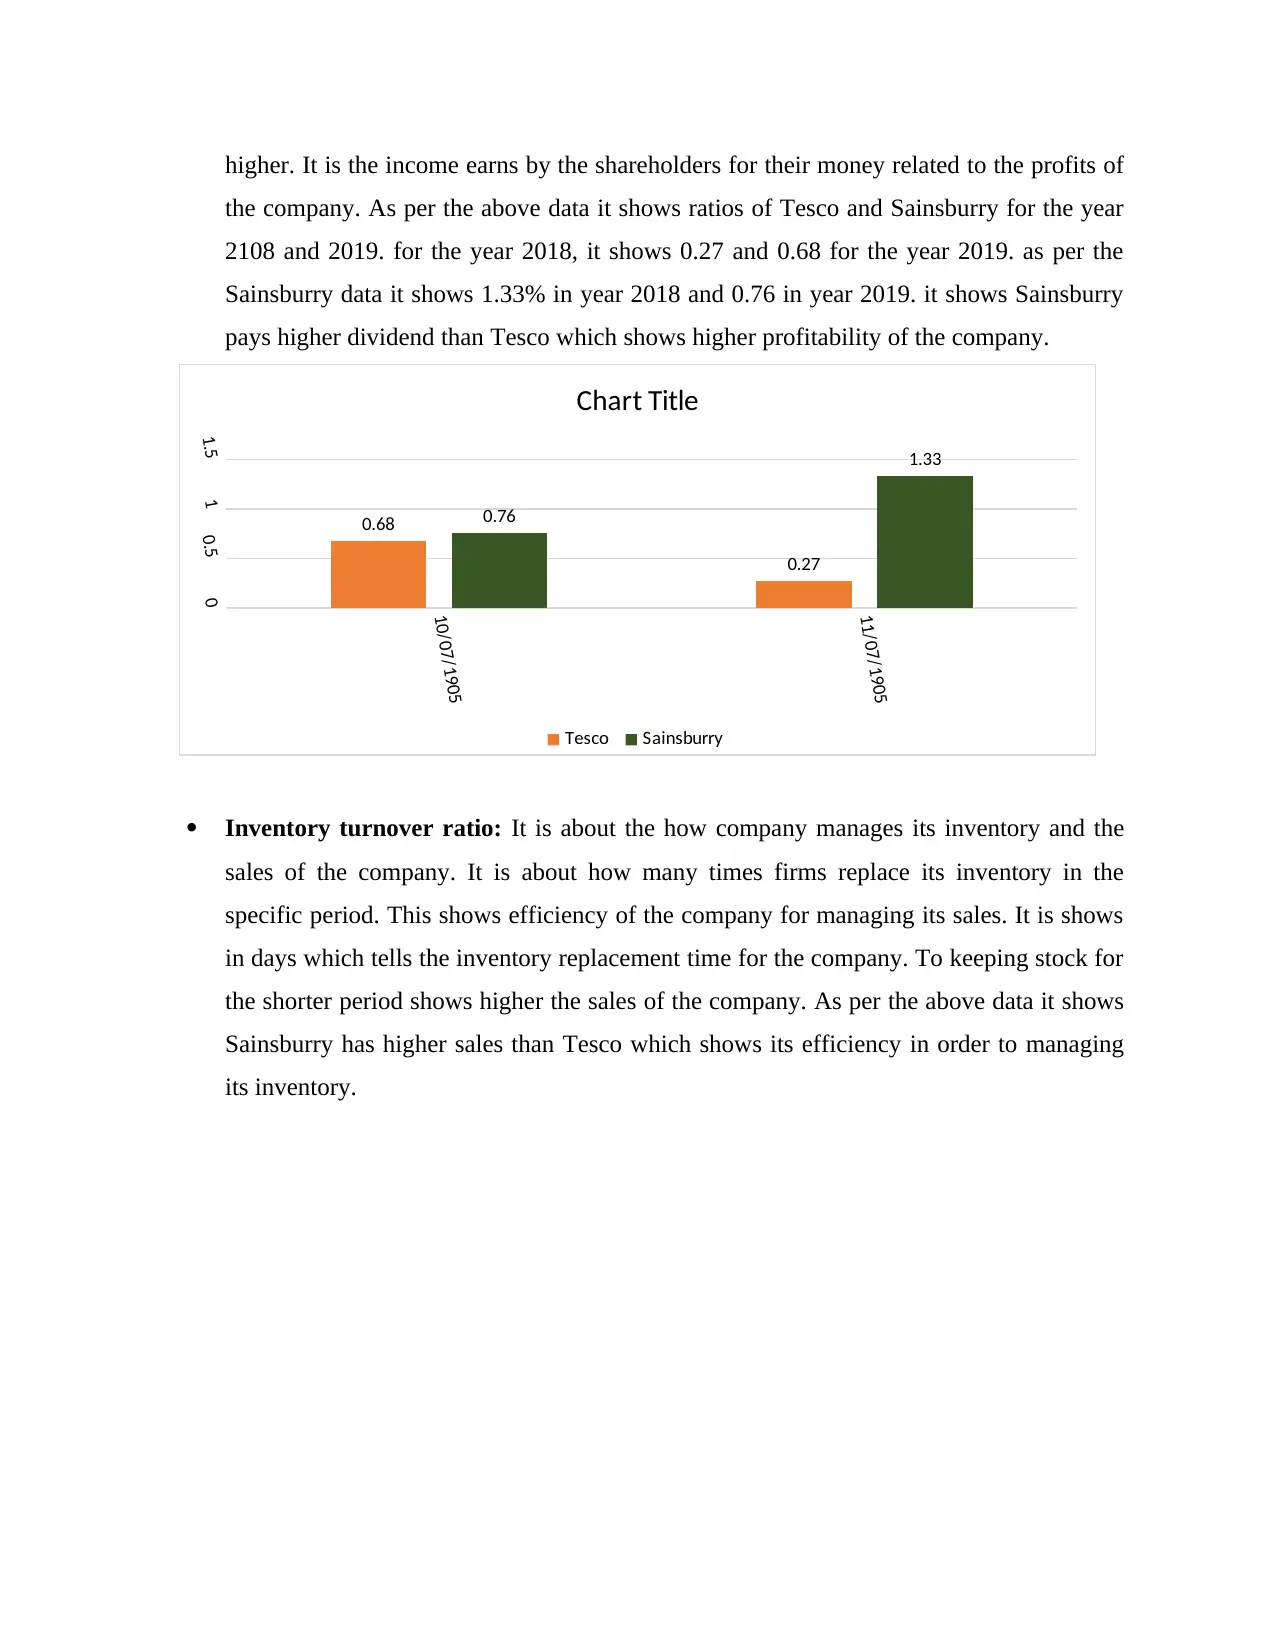
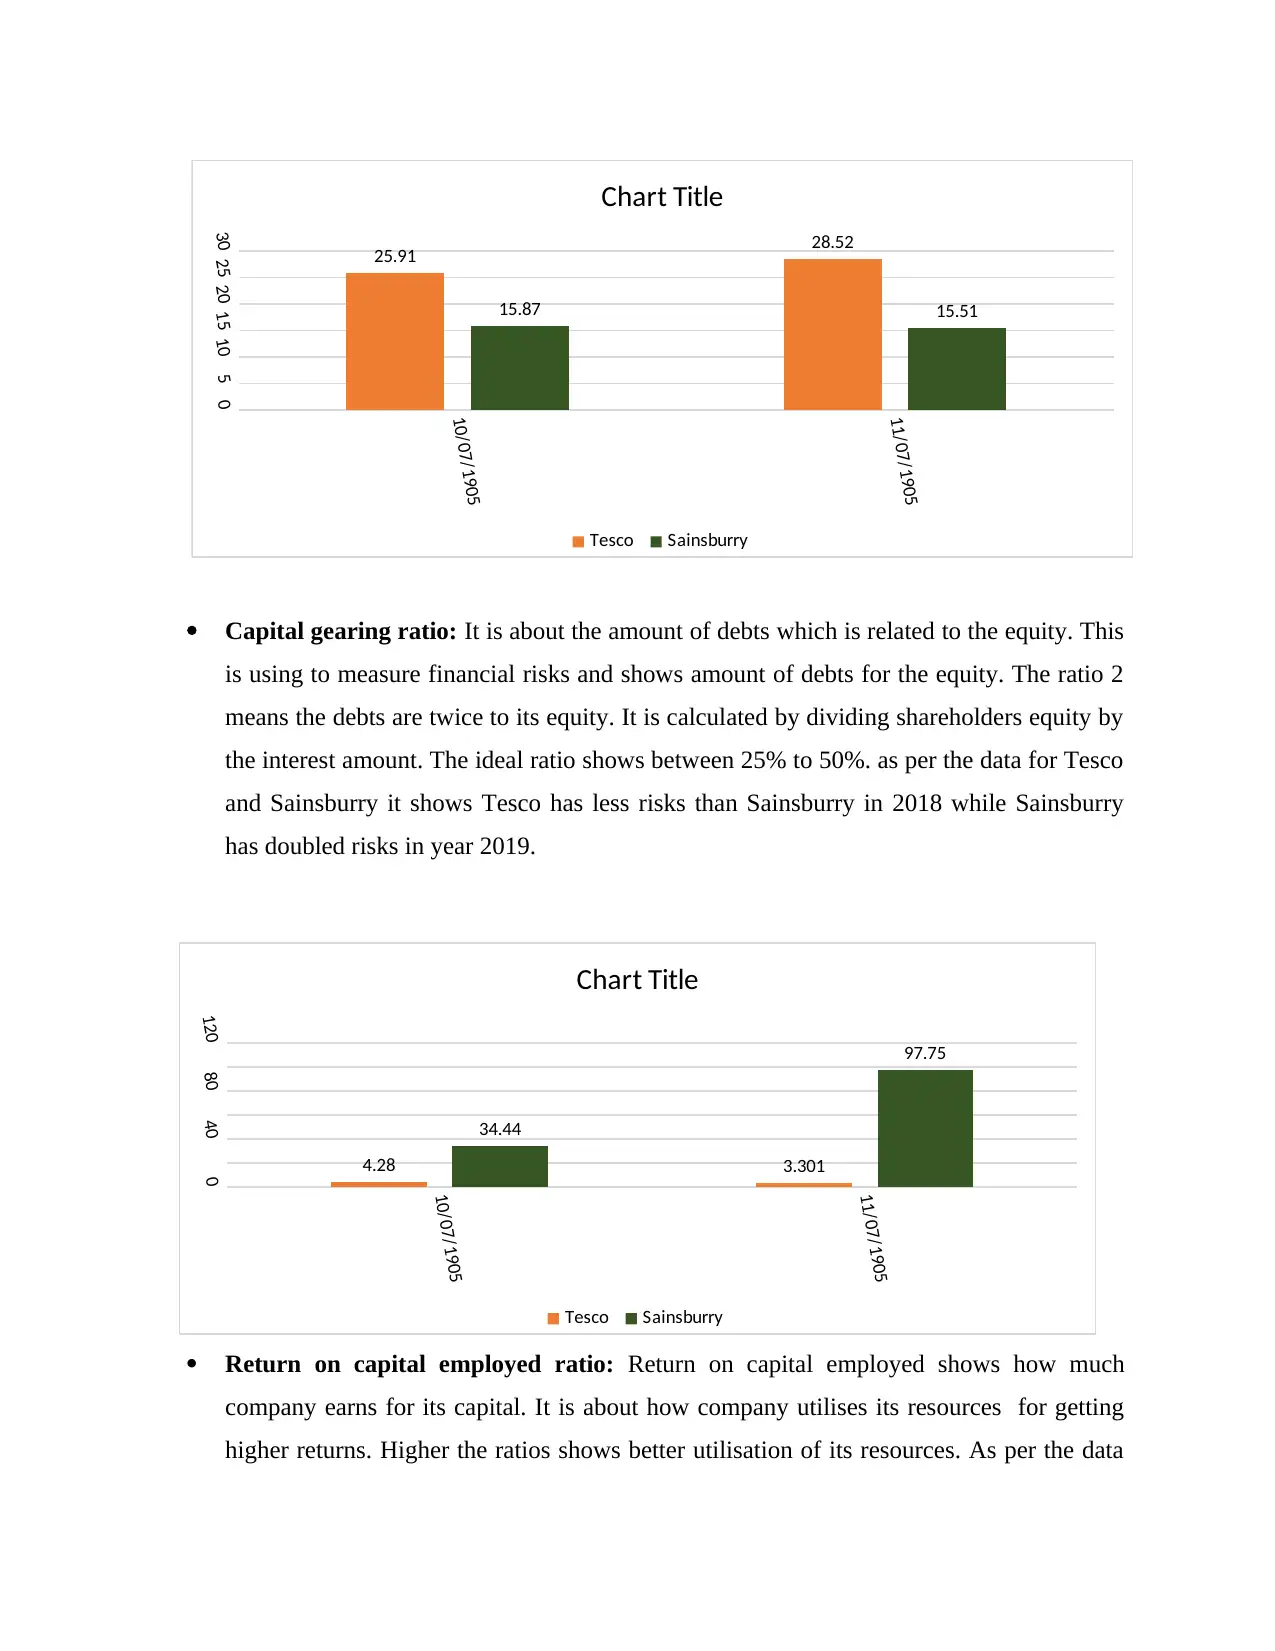
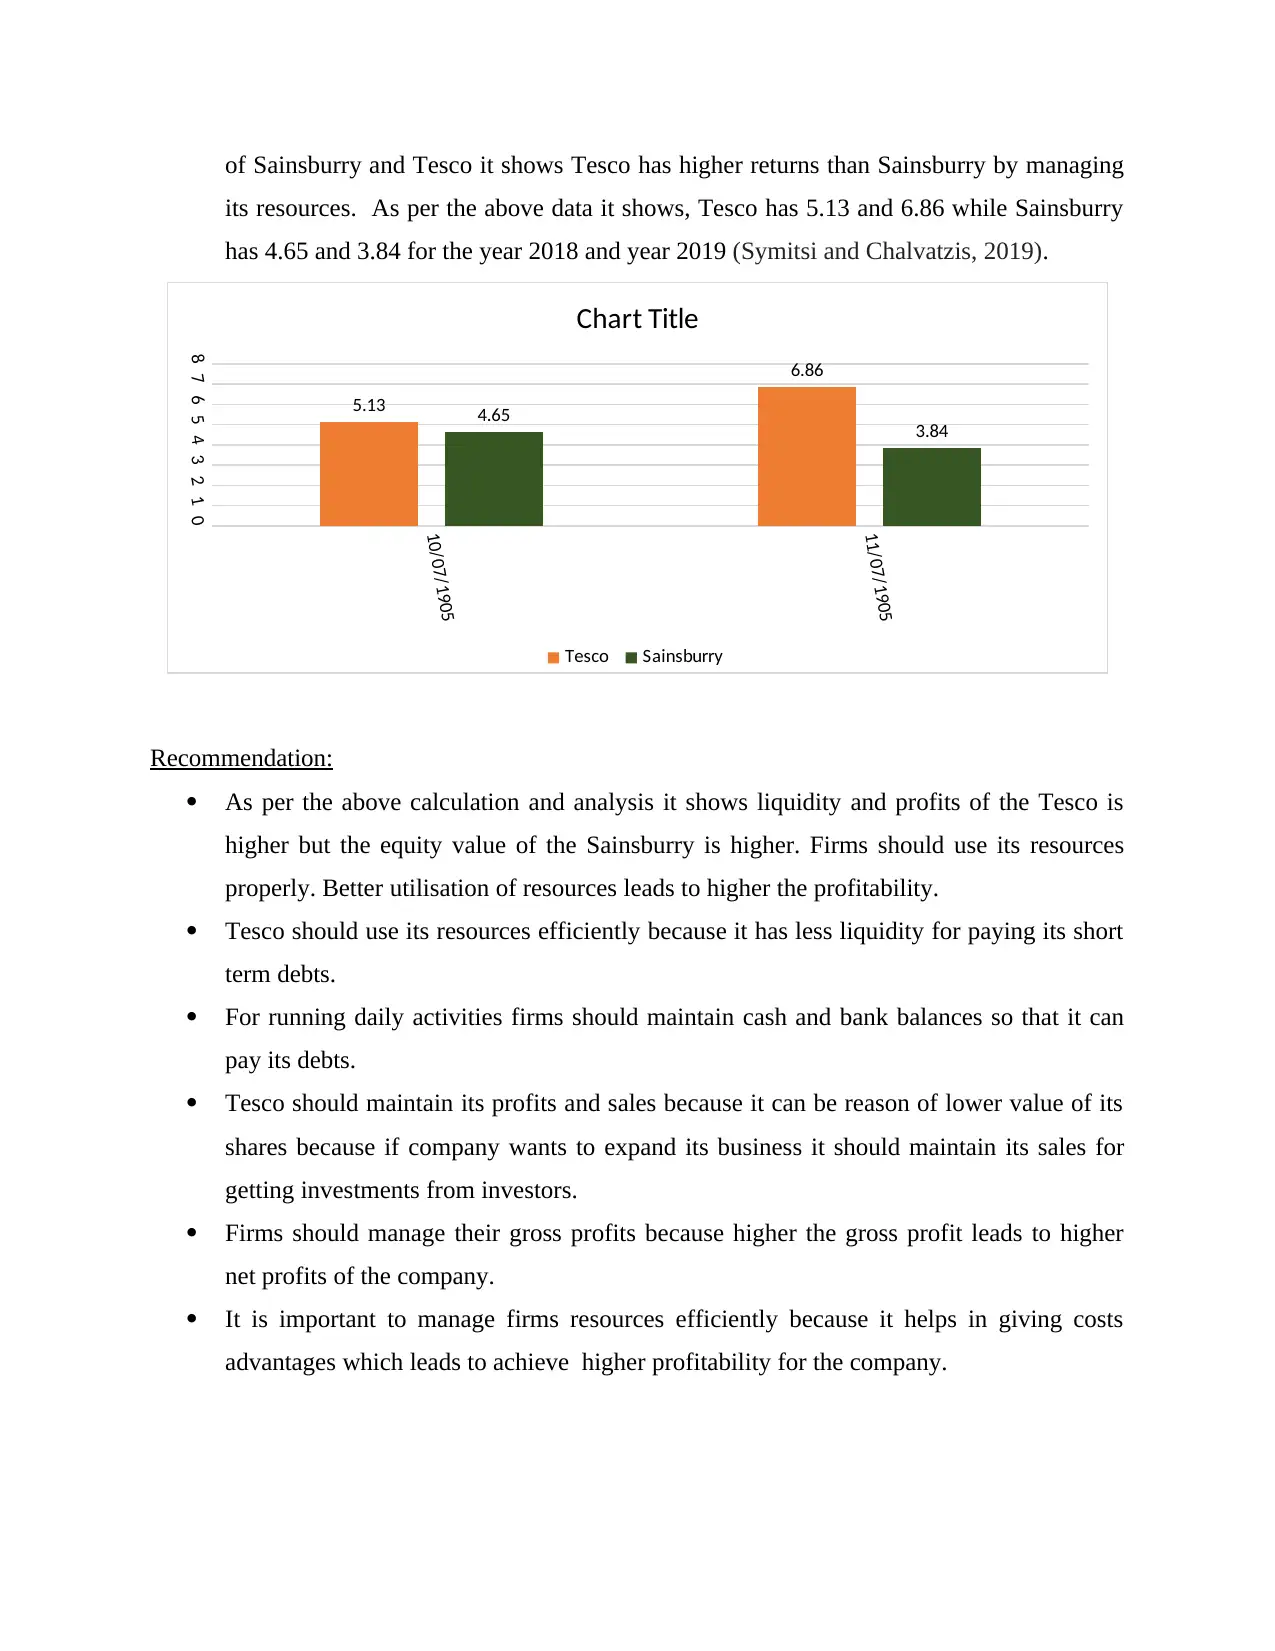
This report provides a comprehensive analysis of the financial performance of Tesco and Sainsburry, two prominent retail companies. The report begins with an introduction to managerial finance, emphasizing its role in planning, organizing, and controlling financial activities. It then delves into the calculation and interpretation of various financial ratios for both companies for the years 2018 and 2019, including current ratio, liquid ratio, gross profit ratio, price-earnings ratio, net profit ratio, earnings per share, dividend payout ratio, inventory turnover, capital gearing ratio, and return on capital employed. Each ratio is calculated and analyzed, with comparisons made between Tesco and Sainsburry to assess their respective strengths and weaknesses. The report also discusses the limitations of ratio analysis. Additionally, it touches upon investment appraisal techniques and their constraints. The conclusion summarizes the key findings and provides recommendations for both companies to improve their financial performance. The report uses charts to visualize the data and includes a references section.

Managerial
Finance
Finance
Paraphrase This Document
Need a fresh take? Get an instant paraphrase of this document with our AI Paraphraser

Table of Contents
INTRODUCTION...........................................................................................................................3
PORTFOLIO 1.................................................................................................................................3
Ratio calculation of Tesco and Sainsburry for the year 2018 and 2019:.....................................3
Ratio analysis and interpretation:.................................................................................................5
Limitations of ratio analysis:.....................................................................................................11
PORTFOLIO 2...............................................................................................................................11
Investment appraisal techniques:...............................................................................................11
Limitations of investment appraisal techniques:........................................................................12
CONCLUSION..............................................................................................................................12
REFERENCES..............................................................................................................................14

INTRODUCTION
Finance is the activity for arranging funds and acquiring funds for running business
activities. It helps in distributing funds into the business activities in other departments so that
they can work because every activities needed for money. So finance is all about fulfill the needs
of all other departments by providing money. Managerial finance is about planning, organising,
analysing, managing, controlling financial activiti8es within an organisation by better utilisation
of resources (Carbonell and Rodriguez Escudero 2016). Management is about to manage
activities so that firms can accomplish its business objectives. The company which is selected for
this report is Tesco and Sainsburry. Tesco is the British retail based company, it was founded in
year 1919, headquarter situated in UK. Sainsburry has large number of super market chain for
retail sector, it was founded in 1922, headquarter situated in London. This report covers topics
such as ratio calculation, ratio analysis of both companies, limitations of ratio analysis. Apart
from this its also covers topics such as investment appraisal techniques and limitations of
investment appraisal techniques (Cruz and Justo, 2017).
PORTFOLIO 1
Ratio calculation of Tesco and Sainsburry for the year 2018 and 2019:
Ratio analysis for the year 2018 and 2019:
In context to Tesco:
Basics Formulas Results for 2019 Results for 2018
Current ratio Current assets / current
liabilities
12668 / 20680
= 0.612
13,726 / 19,238
= 0.713
Liquid / quick ratio Quick assets / current
liabilities
3373 / 20680
= 0.163
4379 / 19238
= 0.227
Gross profit Ratio Gross profit / total
sales
(4144/63911)*100
= 6.48%
(3350 / 57491)*100
= 5.82%
⊘ This is a preview!⊘
Do you want full access?
Subscribe today to unlock all pages.

Trusted by 1+ million students worldwide

P/E ratio Market value per
share/ Earnings per
share
213.6/13.65
= 16.97
229 / 9.35
=24.49
Net profit Ratio Net profit/ total sales (1322/63911)*100
= 2.07%
(1206 / 57491)*100
=2.097%
Earnings per share Income available /
total number of shares
outstanding
13.65 9.35
Dividend pay-out
ratio
Dividend paid / net
income
357/1322
= 0.27
82/1206
= 0.68
Average inventory
turnover period
Net sales / average
inventory
63911/2240.5
= 28.52 days
57491/2282.5
= 25.91 days
Capital gearing ratio Total debt / total
equity
49047 / 14858
= 3.301%
44862/10480
= 4.280%
Return on capital
employed
Operating profit/
capital employed
6.86 5.13
In context to Sainsburry:
Basic Formulas Results for 2019 Results for 2018
Current ratio Current assets / current
liabilities
7550 /11849
=0.63:1
7857/10302
=0.73:1
Liquid / quick ratio Quick assets / current
liabilities
1283 /11849
=0.19
1933/10302
=0.19
Gross profit Ratio Gross profit / total
sales
601 /29007
=0.02%
518/28456
=0.018%
P/E ratio Market value per share
/ Earnings per share
213.40/46
=4.64
238.80/0.22
=10.85
Net profit Ratio Net profit / total sales 186/29007 309/28456
Paraphrase This Document
Need a fresh take? Get an instant paraphrase of this document with our AI Paraphraser

=0.006%
=0.11%
Earnings per share Income available /
total number of shares
outstanding
46 22
Dividend pay-out
ratio
Dividend paid / net
income
247/186
=1.33
235/309
=0.76
Capital gearing ratio Total debt / total
equity
97.75 34.44
Average inventory
turnover period
Net sales / average
inventory
29007/1869.5
=15.51 days
28456/1792.5
=15.87 days
Return on capital
employed
Operating profit/
capital employed
3.84 4.65
Ratio analysis and interpretation:
Current ratio: Current ratio refers to which indicates relation of current liabilities and
current assets. As working capital Is also considers current liabilities and current assets,
so that it also known as working capital ratio. The higher the current ratio shows firm has
higher liquidity in order to manage its activities and it shows better efficiency of the
company in order to managing its resources (Deng, 2016). The ideal current ratio known
as 2:1 which shows 2 assets over 1 liabilities. As per the data of Tesco and Sainsburry
Sainsburry has better performance than Tesco as it shows higher liquidity in both year 2-
18 and 2019.

Liquid ratio: Liquid ratio also known as Acid ratio which shows cash and bank balance
of the company. It shows more liquidity than current ratio as it is calculated by dividing
liquid assets by current liabilities. Liquid assets refers to subtracting stock and prepaid
expenses by current liabilities. The higher the obliquity shows firms efficiency in order to
pay its short term debts (Ellina, Mascarenhas and Theodossiou, 2020). As per the above
data it shows Tesco and Sainsburry liquidity for the year 2018 and 2019. This data shows
in year 2018 Tesco has managed its liquidity higher than Sainsburry but for the both side
we can see Sainsbury has managed its assets equally while in 2019 Tesco declines its
liquid assets which shows it has not managed its resources efficiently.
10/07/1905
11/07/1905
0.550.60.650.70.75 0.713
0.612
0.73
0.63
Chart Title
Tesco Sainsburry
⊘ This is a preview!⊘
Do you want full access?
Subscribe today to unlock all pages.

Trusted by 1+ million students worldwide

Gross profit ratio: Gross profit ratio indicates relation of gross profits and net sales. The
term gross profit refers to sales minus cost of goods sold. And net sales shows total sales
minus sales returns. As it involves only material, labour and overheads it affects firms net
profits. Higher the gross profit means firms manages its resources efficiently and it is
better for the company. The ideal ratio in retail sector is 25% . as per the data of Tesco
Sainsburry it shows Tesco has higher profitability than Sainsburry. As in both year Tesco
has higher performance in its ratios (Han, Chen and Deng, 2018).
Price earning ratio: As per the above data it shows value of the shares which market is
willing to pay. Higher the share price shows higher earnings of the company. As per the
above data it shows ratios for Tesco and Sainsburry, which shows Tesco has less price
than Sainsburry which means Sainsburry has higher market value. As per the data it
10/07/1905
11/07/1905
0
0.1
0.2
0.227
0.163
0.19 0.19
Chart Title
Tesco Sainsburry
5.82%
6.48%
0.018 0.02
Chart Title
Tesco Sainsburry
Paraphrase This Document
Need a fresh take? Get an instant paraphrase of this document with our AI Paraphraser

shows in context to Tesco, it shows 24.49 and 16.97 for the year 2018 and for the
Sainsburry it shows 10.85 and 4.64 for the year 2018 and the year 2019 (Kar and Swain,
2018).
Net profit ratio: Net profit refers to the relation of net profit an net sales. The ideal ratio
shows 10% for the retail sector. Higher the net profit shows higher income of the
company which is positive sign for the business. As per the Tesco in year 2018 it shows
2.01 and in year 2019 it shows 2.07 which shows increase in profitability and firm
manages its resources effectively and efficiently. As per the Sainsburry, the net profit
ratio shows 0.11 and 0.01 in year 2019 which shows firm has increased its costs. From
this calculation it shows Tesco has higher performance than Sainsburry (Moeen, 2017).10/07/1905
11/07/1905
051015202530 24.49
16.97
10.85
4.64
Chart Title
Tesco Sainsburry

Earning per share ratio: It shows how much firm earns for its each share. It refers to
amount earns by the company on its each shares. Higher the ratio shows higher value and
image of the company. Which helps firms for getting more investments from the
investors because it increases firms value. Higher the ratio shows better financial position
of the company. In context to Tesco and Sainsburry, it shows Sainsburry has higher
performance than Tesco as its share price are more than Tesco which shows firms higher
value in the market (Sawik, 2017).
Dividend payout ratio: Dividend payout ratio is about firms efficiency to pay its
shareholders. How much amount company pays for its shareholders for their investments.
Higher the dividend shows higher profitability of the company so that company pays
10/07/1905
11/07/1905
00.511.522.5 2.097 2.07
0.11 0.006
Chart Title
Tesco Sainsburry
10/07/1905
11/07/1905
01020304050
9.35 13.65
22
46
Chart Title
Tesco Sainsburry
⊘ This is a preview!⊘
Do you want full access?
Subscribe today to unlock all pages.

Trusted by 1+ million students worldwide

higher. It is the income earns by the shareholders for their money related to the profits of
the company. As per the above data it shows ratios of Tesco and Sainsburry for the year
2108 and 2019. for the year 2018, it shows 0.27 and 0.68 for the year 2019. as per the
Sainsburry data it shows 1.33% in year 2018 and 0.76 in year 2019. it shows Sainsburry
pays higher dividend than Tesco which shows higher profitability of the company.
Inventory turnover ratio: It is about the how company manages its inventory and the
sales of the company. It is about how many times firms replace its inventory in the
specific period. This shows efficiency of the company for managing its sales. It is shows
in days which tells the inventory replacement time for the company. To keeping stock for
the shorter period shows higher the sales of the company. As per the above data it shows
Sainsburry has higher sales than Tesco which shows its efficiency in order to managing
its inventory.
10/07/1905
11/07/1905
00.511.5
0.68
0.27
0.76
1.33
Chart Title
Tesco Sainsburry
Paraphrase This Document
Need a fresh take? Get an instant paraphrase of this document with our AI Paraphraser

Capital gearing ratio: It is about the amount of debts which is related to the equity. This
is using to measure financial risks and shows amount of debts for the equity. The ratio 2
means the debts are twice to its equity. It is calculated by dividing shareholders equity by
the interest amount. The ideal ratio shows between 25% to 50%. as per the data for Tesco
and Sainsburry it shows Tesco has less risks than Sainsburry in 2018 while Sainsburry
has doubled risks in year 2019.
Return on capital employed ratio: Return on capital employed shows how much
company earns for its capital. It is about how company utilises its resources for getting
higher returns. Higher the ratios shows better utilisation of its resources. As per the data
10/07/1905
11/07/1905
051015202530 25.91 28.52
15.87 15.51
Chart Title
Tesco Sainsburry
10/07/1905
11/07/1905
04080120
4.28 3.301
34.44
97.75
Chart Title
Tesco Sainsburry

of Sainsburry and Tesco it shows Tesco has higher returns than Sainsburry by managing
its resources. As per the above data it shows, Tesco has 5.13 and 6.86 while Sainsburry
has 4.65 and 3.84 for the year 2018 and year 2019 (Symitsi and Chalvatzis, 2019).
Recommendation:
As per the above calculation and analysis it shows liquidity and profits of the Tesco is
higher but the equity value of the Sainsburry is higher. Firms should use its resources
properly. Better utilisation of resources leads to higher the profitability.
Tesco should use its resources efficiently because it has less liquidity for paying its short
term debts.
For running daily activities firms should maintain cash and bank balances so that it can
pay its debts.
Tesco should maintain its profits and sales because it can be reason of lower value of its
shares because if company wants to expand its business it should maintain its sales for
getting investments from investors.
Firms should manage their gross profits because higher the gross profit leads to higher
net profits of the company.
It is important to manage firms resources efficiently because it helps in giving costs
advantages which leads to achieve higher profitability for the company.
10/07/1905
11/07/1905
012345678
5.13
6.86
4.65 3.84
Chart Title
Tesco Sainsburry
⊘ This is a preview!⊘
Do you want full access?
Subscribe today to unlock all pages.

Trusted by 1+ million students worldwide
1 out of 18
Related Documents
Your All-in-One AI-Powered Toolkit for Academic Success.
+13062052269
info@desklib.com
Available 24*7 on WhatsApp / Email
Unlock your academic potential
Copyright © 2020–2025 A2Z Services. All Rights Reserved. Developed and managed by ZUCOL.


