Tesco Stock Price Analysis Report - Finance Module - Semester 1

Verified

Added on  2022/12/15

|5
|388
|50
Report
AI Summary
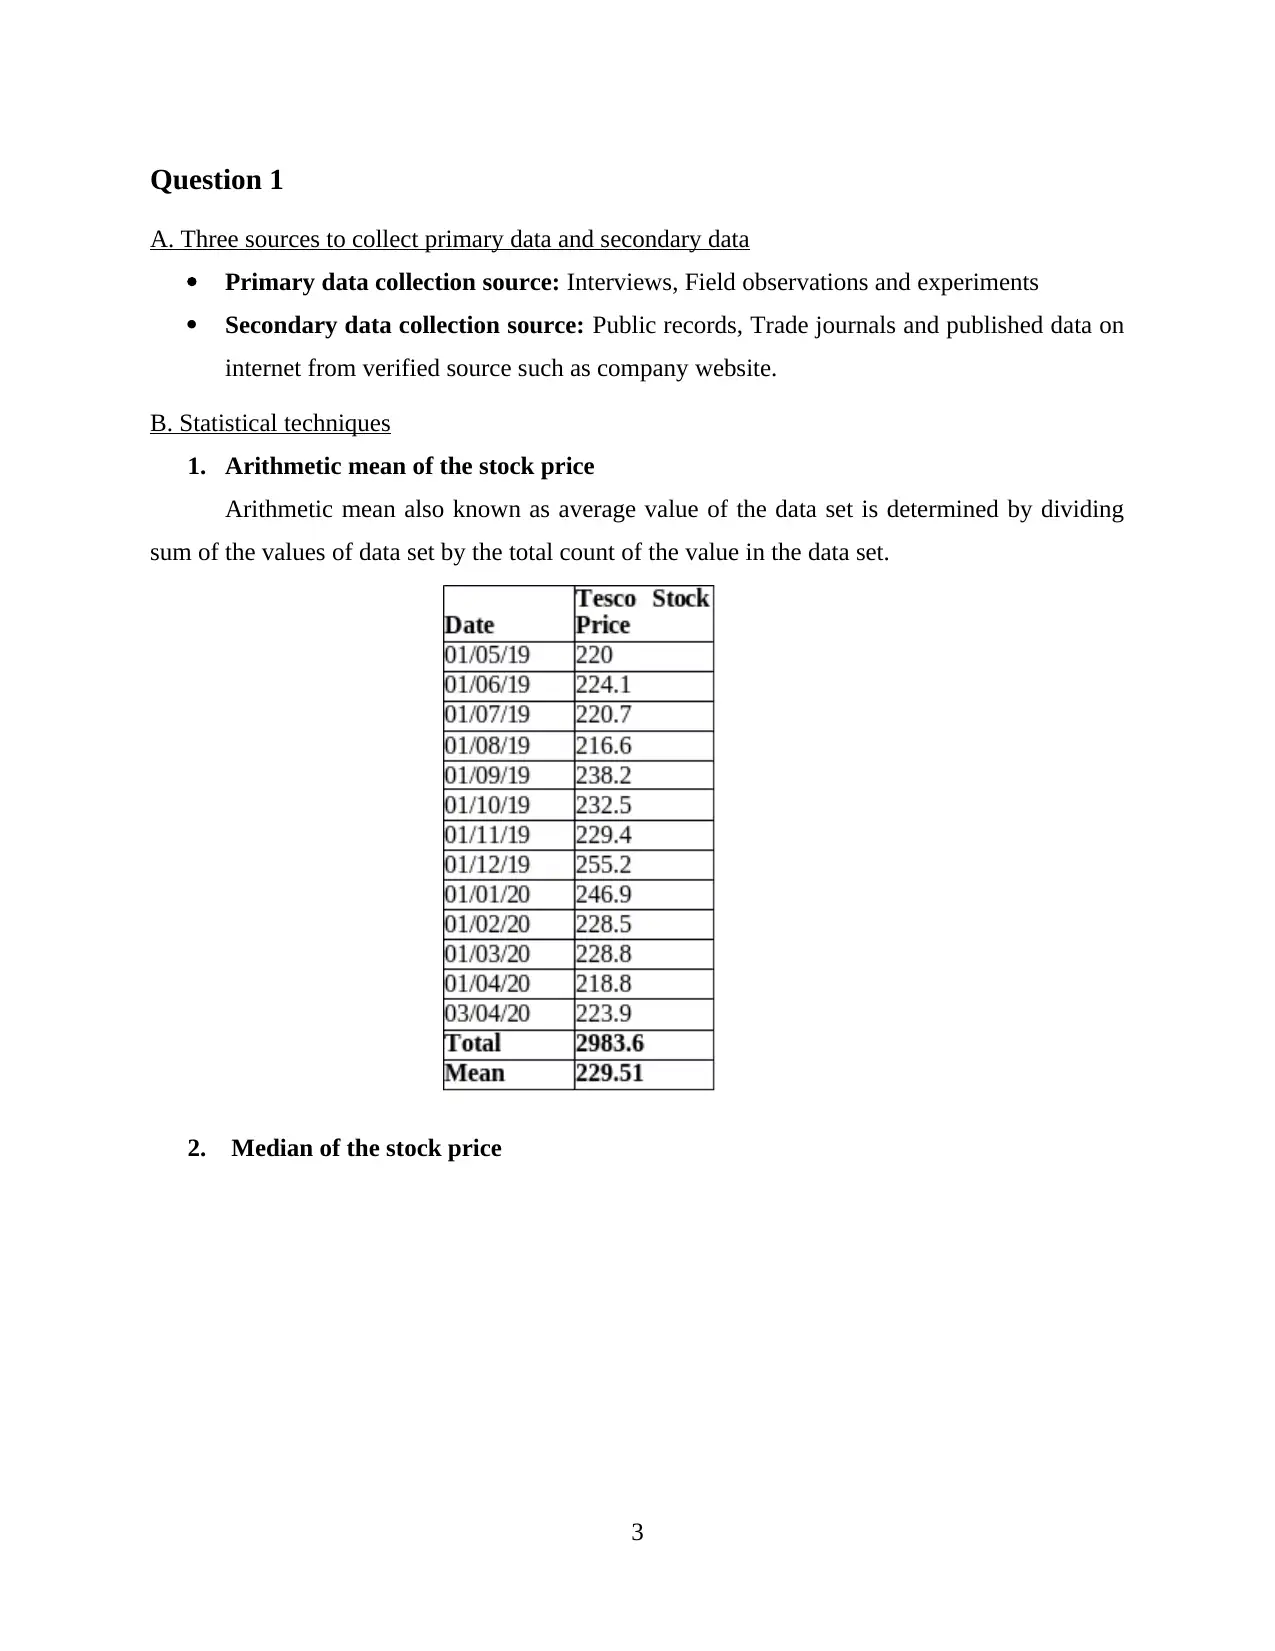
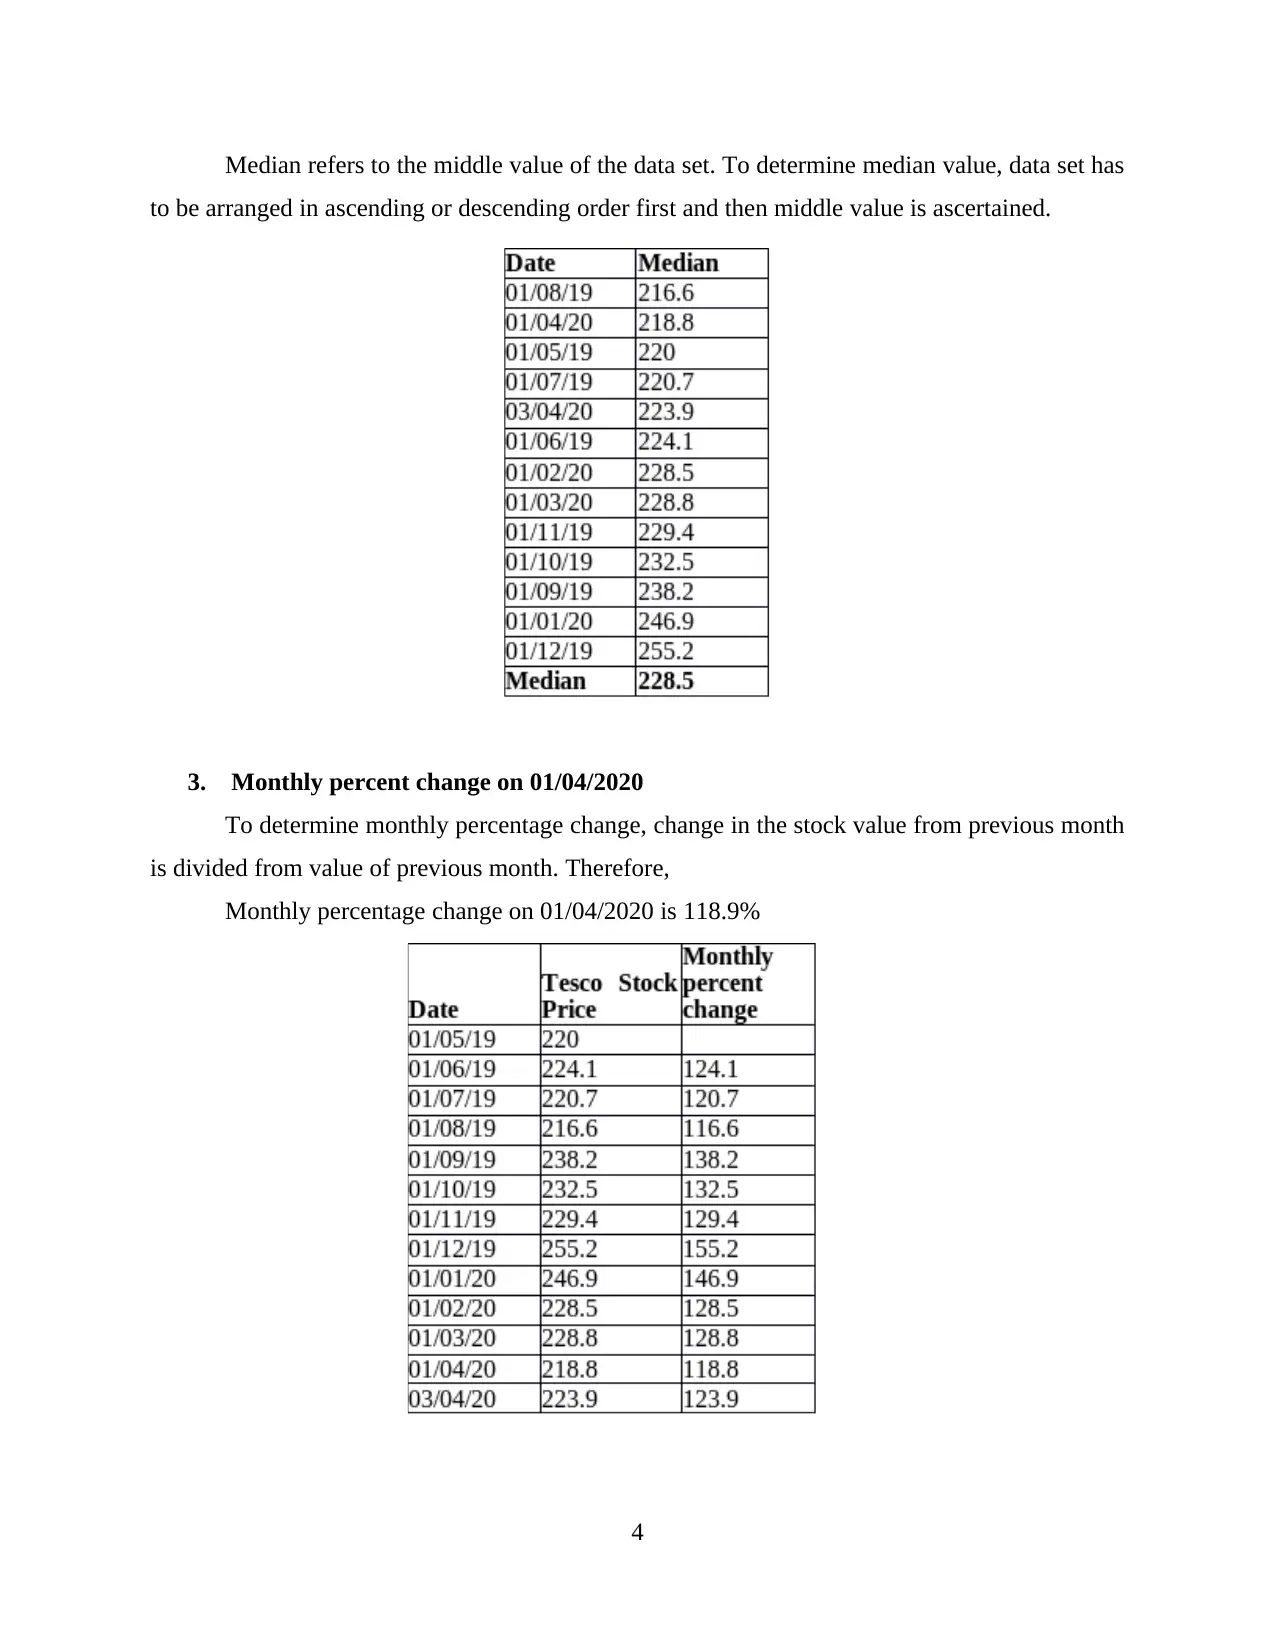
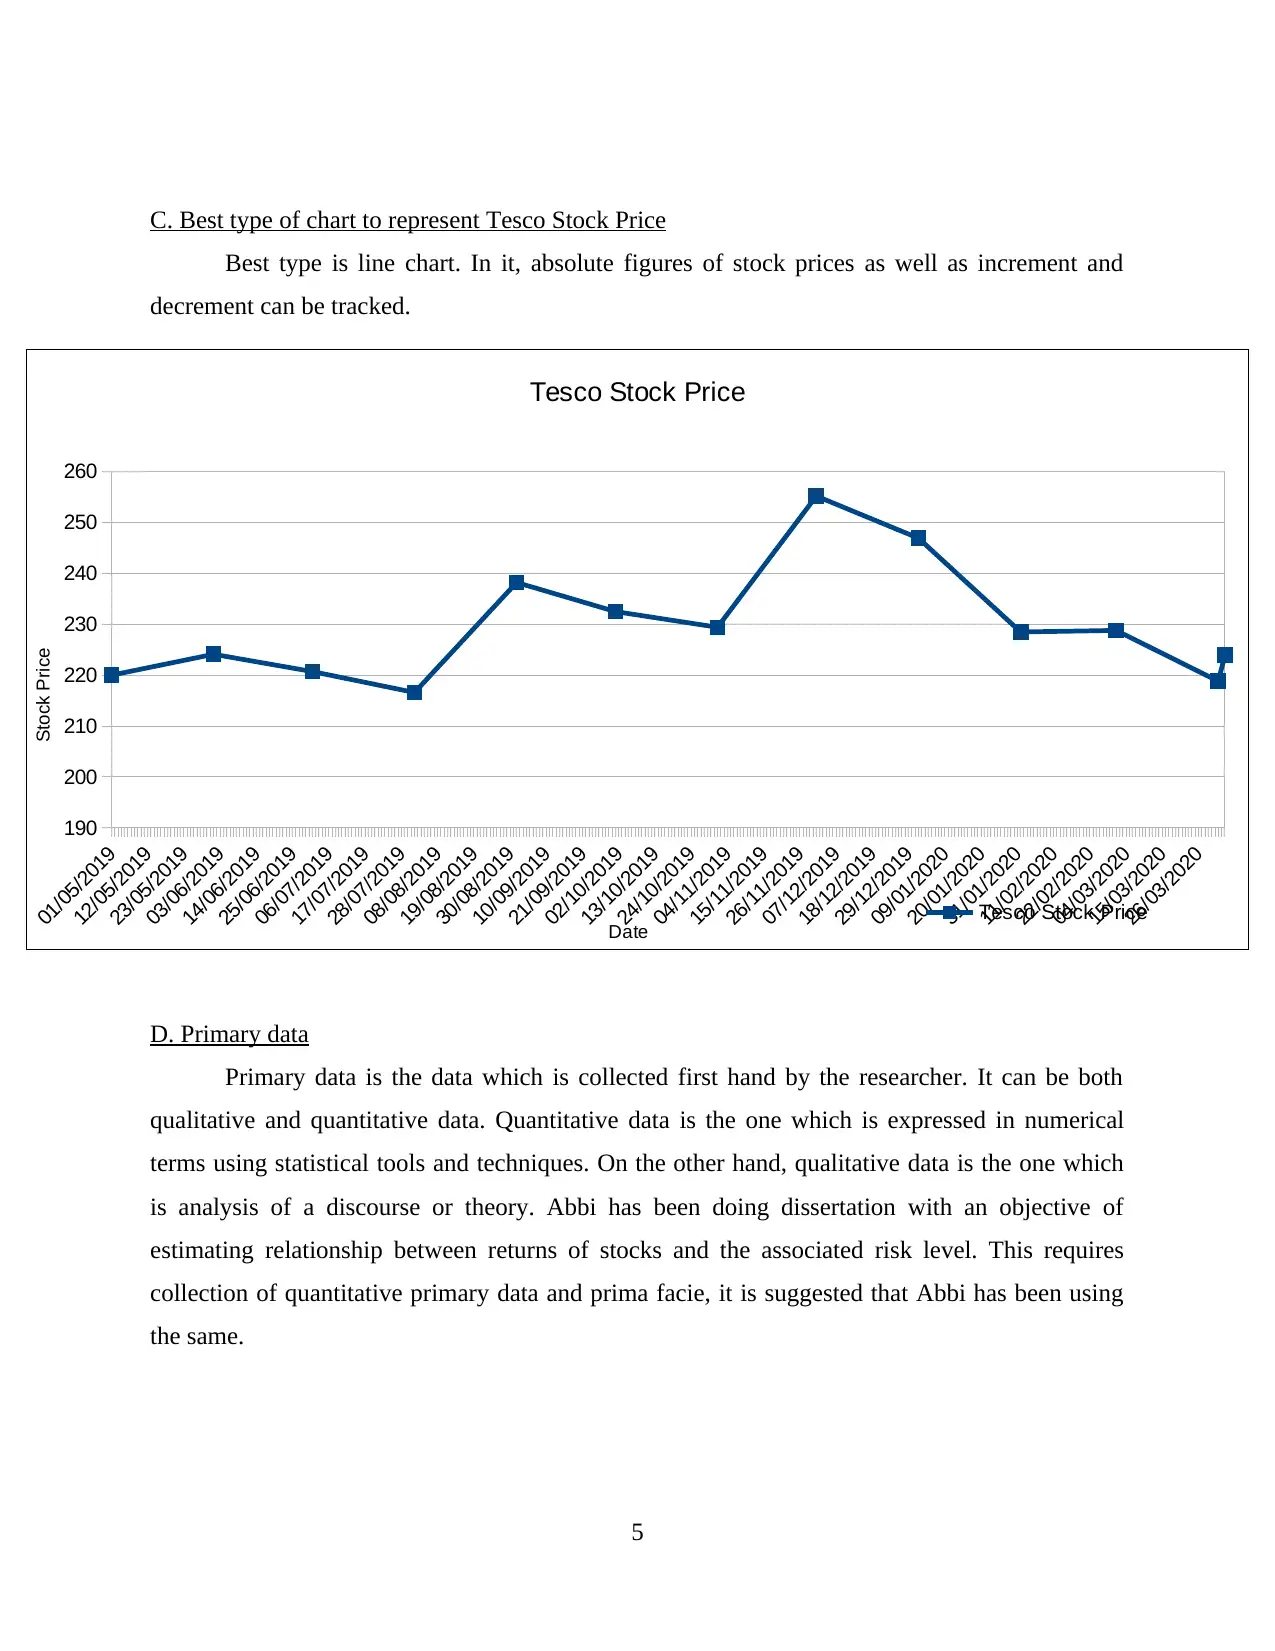
This report analyzes Tesco's stock price, encompassing primary and secondary data sources, statistical techniques, and a line chart to represent the data. The report details the collection of primary data through interviews, field observations, and experiments, as well as the use of public records and trade journals for secondary data. It utilizes statistical techniques such as calculating the arithmetic mean, identifying the median, and determining monthly percentage changes. A line chart is recommended for visualizing stock price fluctuations. The report also distinguishes between quantitative and qualitative data, referencing a dissertation example to illustrate the application of primary data in estimating the relationship between stock returns and risk levels. This analysis provides a comprehensive overview of data analysis techniques in a financial context.
Document Page
Managing data
1
tabler-icon-diamond-filled.svg

Paraphrase This Document

Need a fresh take? Get an instant paraphrase of this document with our AI Paraphraser
Document Page
Table of Contents
Question 1........................................................................................................................................3
A. Three sources to collect primary data and secondary data.....................................................3
B. Statistical techniques..............................................................................................................3
C. Best type of chart to represent Tesco Stock Price..................................................................5
D. Primary data...........................................................................................................................6
2
Document Page
Question 1
A. Three sources to collect primary data and secondary data
Primary data collection source: Interviews, Field observations and experiments
Secondary data collection source: Public records, Trade journals and published data on
internet from verified source such as company website.
B. Statistical techniques
1. Arithmetic mean of the stock price
Arithmetic mean also known as average value of the data set is determined by dividing
sum of the values of data set by the total count of the value in the data set.
2. Median of the stock price
3
Document Page
Median refers to the middle value of the data set. To determine median value, data set has
to be arranged in ascending or descending order first and then middle value is ascertained.
3. Monthly percent change on 01/04/2020
To determine monthly percentage change, change in the stock value from previous month
is divided from value of previous month. Therefore,
Monthly percentage change on 01/04/2020 is 118.9%
4
tabler-icon-diamond-filled.svg

Paraphrase This Document

Need a fresh take? Get an instant paraphrase of this document with our AI Paraphraser
Document Page
C. Best type of chart to represent Tesco Stock Price
Best type is line chart. In it, absolute figures of stock prices as well as increment and
decrement can be tracked.
D. Primary data
Primary data is the data which is collected first hand by the researcher. It can be both
qualitative and quantitative data. Quantitative data is the one which is expressed in numerical
terms using statistical tools and techniques. On the other hand, qualitative data is the one which
is analysis of a discourse or theory. Abbi has been doing dissertation with an objective of
estimating relationship between returns of stocks and the associated risk level. This requires
collection of quantitative primary data and prima facie, it is suggested that Abbi has been using
the same.
5
01/05/2019
12/05/2019
23/05/2019
03/06/2019
14/06/2019
25/06/2019
06/07/2019
17/07/2019
28/07/2019
08/08/2019
19/08/2019
30/08/2019
10/09/2019
21/09/2019
02/10/2019
13/10/2019
24/10/2019
04/11/2019
15/11/2019
26/11/2019
07/12/2019
18/12/2019
29/12/2019
09/01/2020
20/01/2020
31/01/2020
11/02/2020
22/02/2020
04/03/2020
15/03/2020
26/03/2020
190
200
210
220
230
240
250
260
Tesco Stock Price
Tesco Stock Price
Date
Stock Price
chevron_up_icon
1 out of 5
circle_padding
hide_on_mobile
zoom_out_icon
[object Object]