Detailed Analysis of Finance and Funding in Travel and Tourism Sector
VerifiedAdded on 2020/01/21
|18
|4804
|46
Report
AI Summary
This report provides a detailed analysis of finance and funding within the travel and tourism sector. It begins with an introduction to the importance of finance in the industry, followed by an in-depth exploration of Cost-Volume-Profit (CVP) analysis and its application. The report then examines various pricing methods, including competitive, geographical, cost-plus margin, and penetration pricing policies. It also discusses factors influencing profits, such as costs, volume, and price. Furthermore, the report delves into management accounting information, including budgeting, cost accounting, and ratio analysis, and how these tools are utilized in decision-making. Investment appraisal techniques, such as payback period, accounting rate of return (ARR), net present value (NPV), and internal rate of return (IRR), are also analyzed. The report includes an interpretation of financial statements from Thomas Cook Group PLC, focusing on profitability, liquidity, and investment ratios. Finally, it explores various sources of finance available to the tourism industry, including both internal and external options, providing a comprehensive overview of financial strategies and their practical application within the sector.

Finance and Funding in the Travel and Tourism Sector
1
1
Paraphrase This Document
Need a fresh take? Get an instant paraphrase of this document with our AI Paraphraser
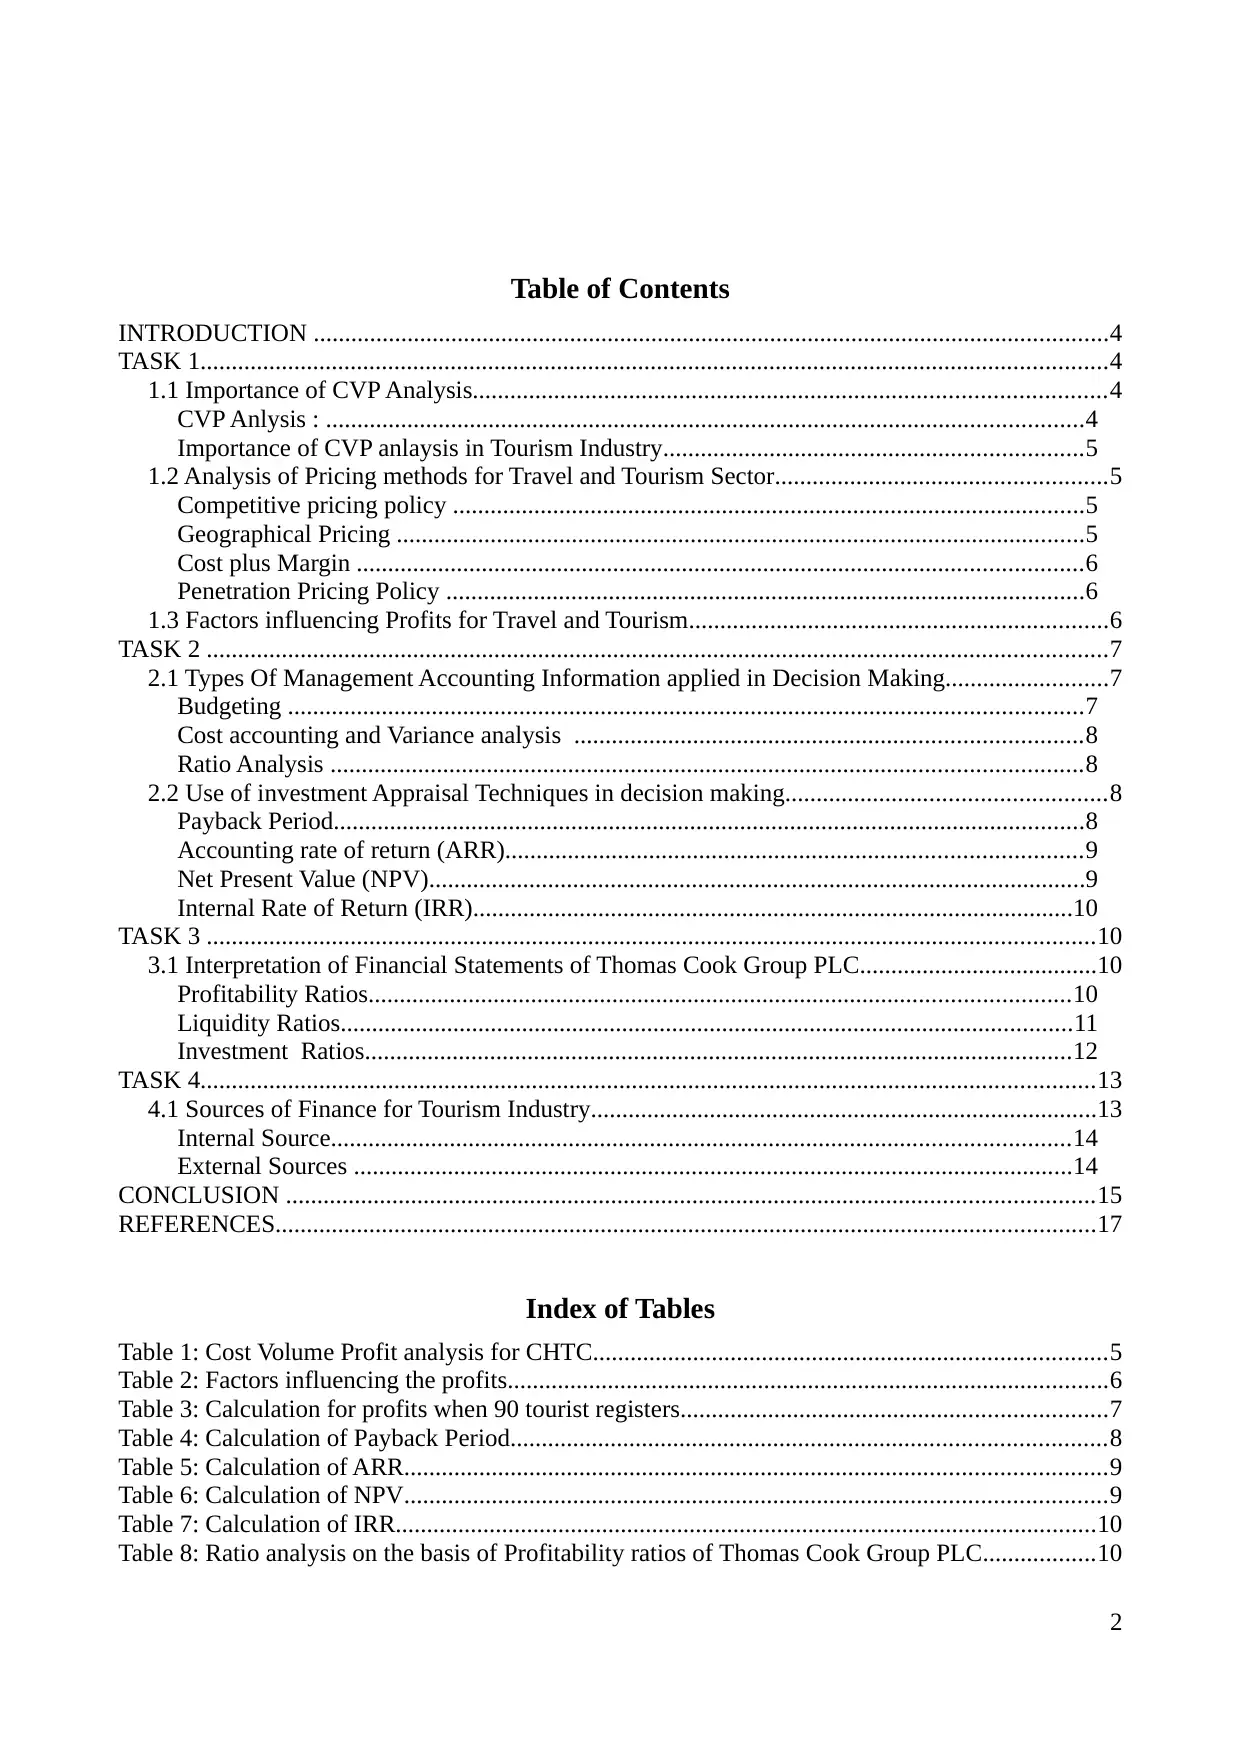
Table of Contents
INTRODUCTION ...............................................................................................................................4
TASK 1.................................................................................................................................................4
1.1 Importance of CVP Analysis.....................................................................................................4
CVP Anlysis : .........................................................................................................................4
Importance of CVP anlaysis in Tourism Industry...................................................................5
1.2 Analysis of Pricing methods for Travel and Tourism Sector.....................................................5
Competitive pricing policy .....................................................................................................5
Geographical Pricing ..............................................................................................................5
Cost plus Margin ....................................................................................................................6
Penetration Pricing Policy ......................................................................................................6
1.3 Factors influencing Profits for Travel and Tourism...................................................................6
TASK 2 ................................................................................................................................................7
2.1 Types Of Management Accounting Information applied in Decision Making..........................7
Budgeting ...............................................................................................................................7
Cost accounting and Variance analysis .................................................................................8
Ratio Analysis ........................................................................................................................8
2.2 Use of investment Appraisal Techniques in decision making...................................................8
Payback Period........................................................................................................................8
Accounting rate of return (ARR)............................................................................................9
Net Present Value (NPV).........................................................................................................9
Internal Rate of Return (IRR)................................................................................................10
TASK 3 ..............................................................................................................................................10
3.1 Interpretation of Financial Statements of Thomas Cook Group PLC......................................10
Profitability Ratios................................................................................................................10
Liquidity Ratios.....................................................................................................................11
Investment Ratios.................................................................................................................12
TASK 4...............................................................................................................................................13
4.1 Sources of Finance for Tourism Industry.................................................................................13
Internal Source......................................................................................................................14
External Sources ...................................................................................................................14
CONCLUSION .................................................................................................................................15
REFERENCES...................................................................................................................................17
Index of Tables
Table 1: Cost Volume Profit analysis for CHTC..................................................................................5
Table 2: Factors influencing the profits................................................................................................6
Table 3: Calculation for profits when 90 tourist registers....................................................................7
Table 4: Calculation of Payback Period...............................................................................................8
Table 5: Calculation of ARR................................................................................................................9
Table 6: Calculation of NPV................................................................................................................9
Table 7: Calculation of IRR................................................................................................................10
Table 8: Ratio analysis on the basis of Profitability ratios of Thomas Cook Group PLC..................10
2

Table 9: Ratio analysis on the basis of Liquidity ratios of Thomas Cook Group PLC......................11
Table 10: Ratio analysis on the basis of Investment ratios of Thomas Cook Group PLC.................12
Table 11: Analysis of Internal Sources of Finance.............................................................................14
Table 12: Analysis of External Sources of Finance............................................................................14
Illustration Index
Illustration 1: Cost Volume Profit (CVP) analysis ..............................................................................4
Illustration 2: Management Accounting information functions...........................................................7
Illustration 3: Profitability ratios of Thomas Cook Group PLC.........................................................11
Illustration 4: Liquidity ratios of Thomas Cook Group PLC.............................................................12
Illustration 5: Investment ratios of Thomas Cook Group PLC..........................................................13
3
⊘ This is a preview!⊘
Do you want full access?
Subscribe today to unlock all pages.
Trusted by 1+ million students worldwide
INTRODUCTION
Finance is a pillar of success and growth for business in every sector and Travel and tourism
is no exception. Carib Happy Tours Company(CHTC) is a company engaged in arranging tours
across the globe. This report reflects the application of CVP analysis and its importance in addition
to evaluation of factors influencing profits of the CHTC. Although management decisions are based
on the intuitions and market conditions but information regarding management accounting plays
vital role in the same. Further this report displays investment appraisal techniques and its use in
decision making. Moreover Thomas Cook Group PLC is selected for performance measurement
under the financial microscope. Finance being major function, this report described the sources of
finance available for the expansion projects of travel and tourism companies.
TASK 1
1.1 Importance of CVP Analysis
CVP Anlysis :
CVP analysis depicts the relationship between cost , volume and profits of the organisation.
It describes various levels of operation which will generate profits or loss for the enterprise. CHTC
with the help of CVP analysis can determine the break even number of customers to be taken on trip
to land into situation of no profit and no loss. Break even point is the level of sales where company
is at indifferent situation and anything above break even will result in profits and below the same
will be loss(Kumar, 2016).
4
Illustration 1: Cost Volume Profit (CVP) analysis
(Source: Cost Volume Profit (CVP) analysis, 2017.)
Paraphrase This Document
Need a fresh take? Get an instant paraphrase of this document with our AI Paraphraser
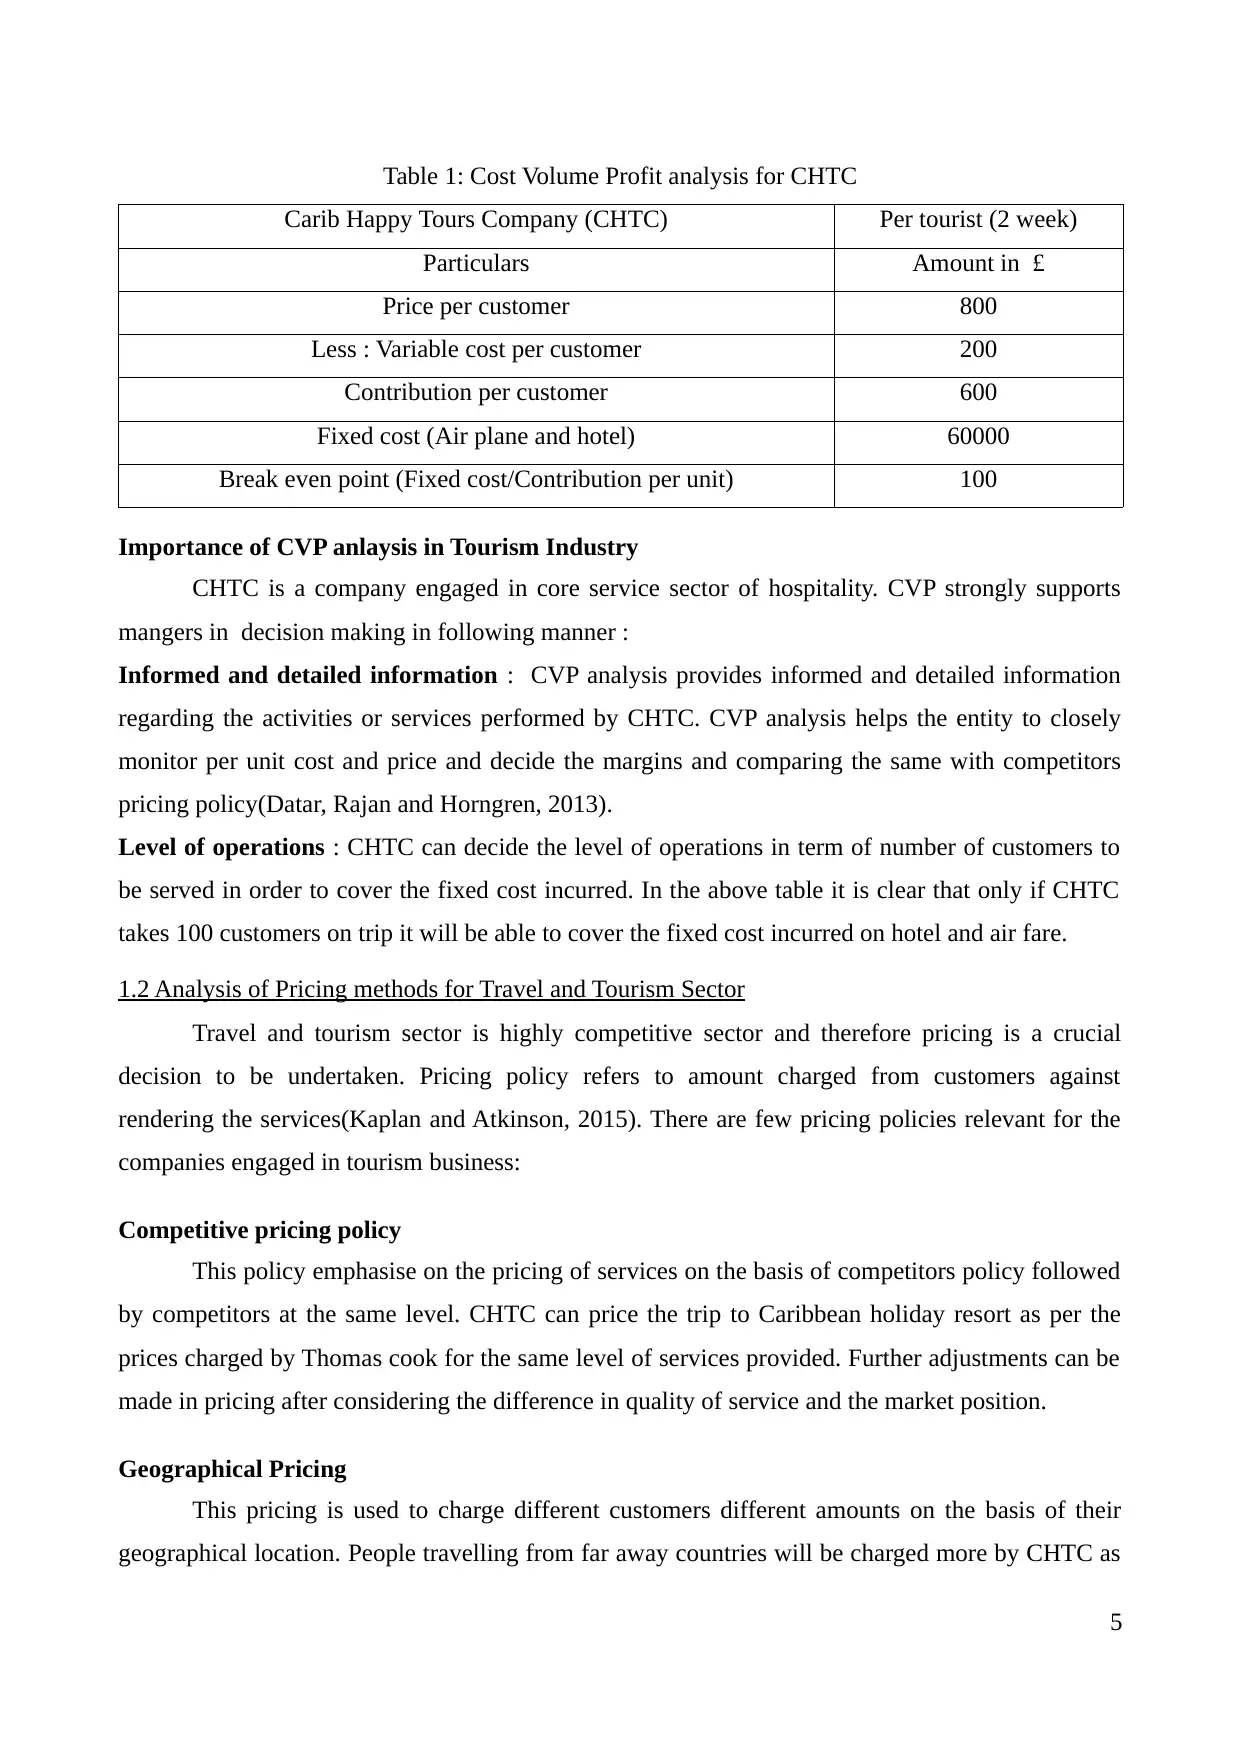
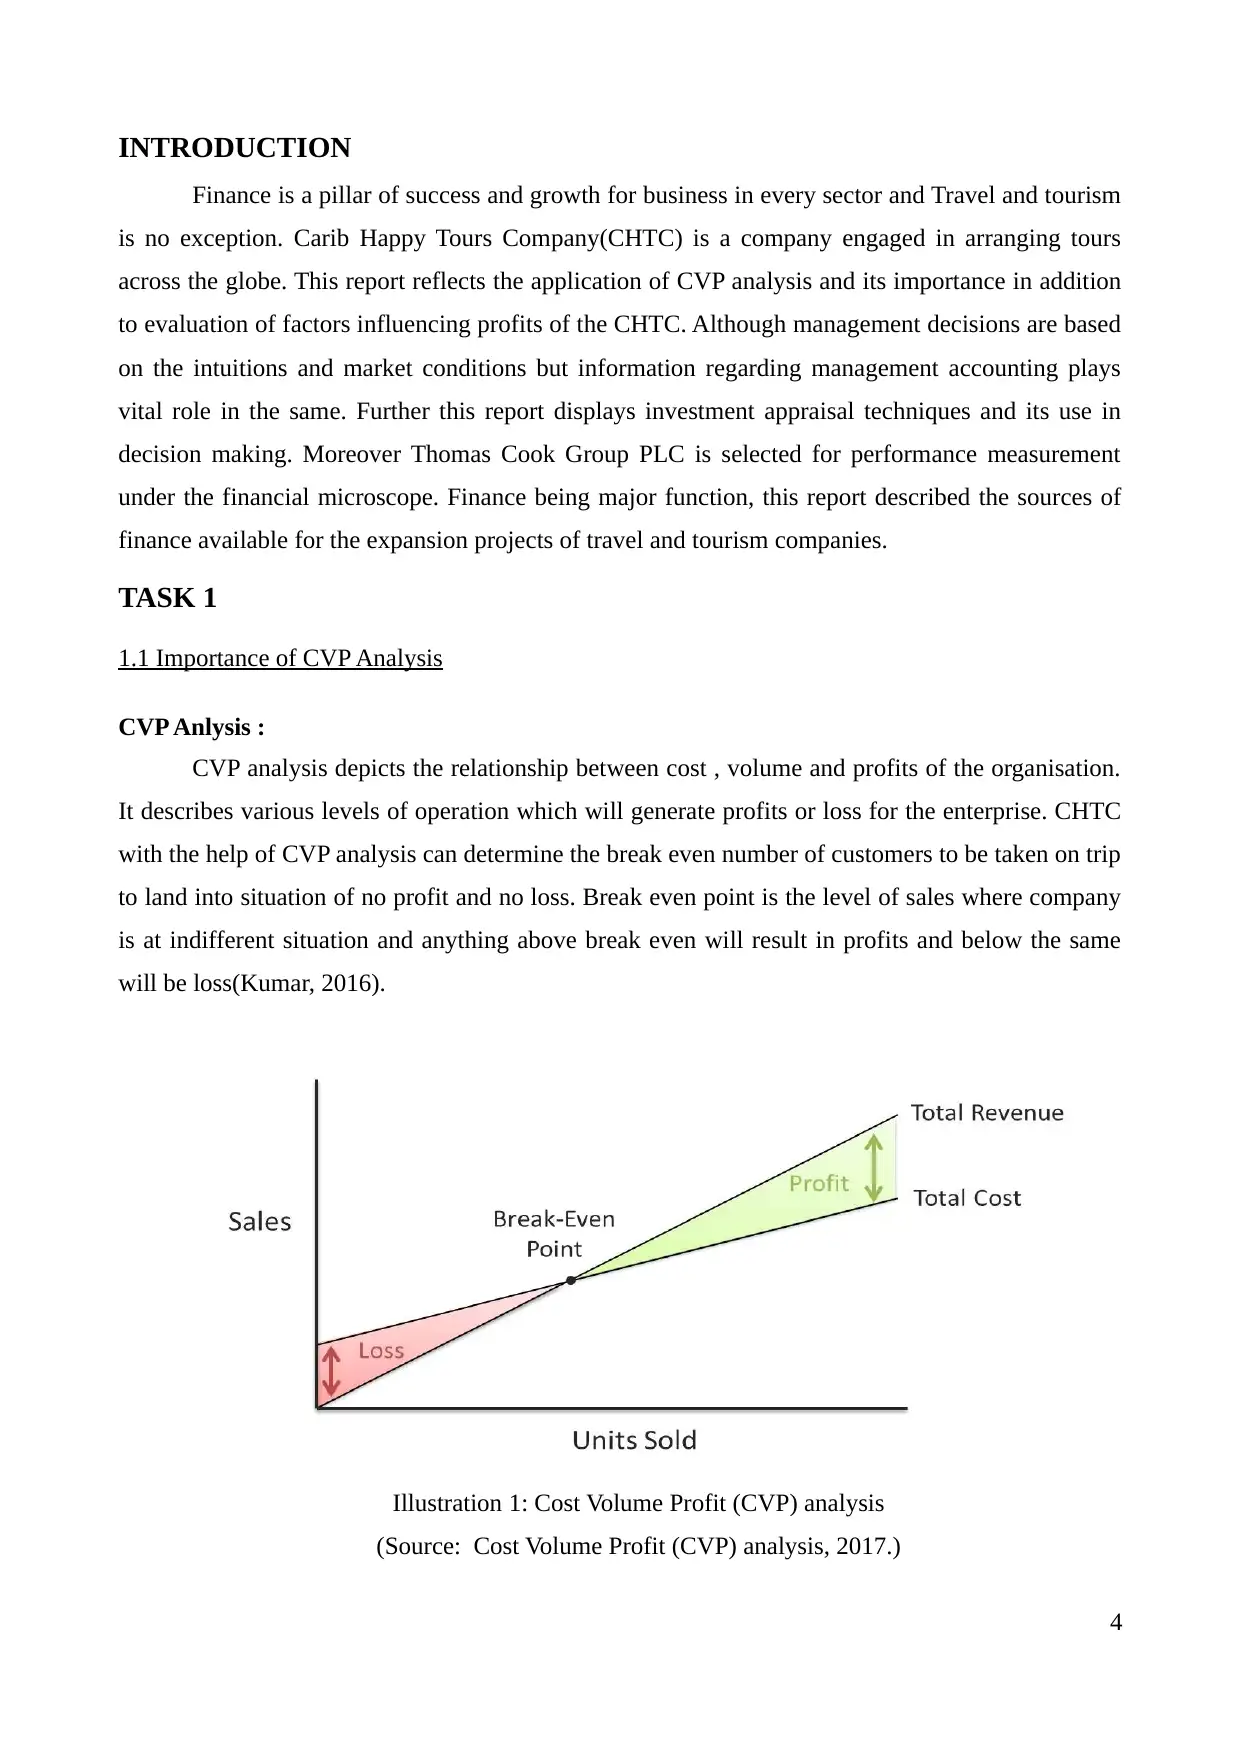
Table 1: Cost Volume Profit analysis for CHTC
Carib Happy Tours Company (CHTC) Per tourist (2 week)
Particulars Amount in £
Price per customer 800
Less : Variable cost per customer 200
Contribution per customer 600
Fixed cost (Air plane and hotel) 60000
Break even point (Fixed cost/Contribution per unit) 100
Importance of CVP anlaysis in Tourism Industry
CHTC is a company engaged in core service sector of hospitality. CVP strongly supports
mangers in decision making in following manner :
Informed and detailed information : CVP analysis provides informed and detailed information
regarding the activities or services performed by CHTC. CVP analysis helps the entity to closely
monitor per unit cost and price and decide the margins and comparing the same with competitors
pricing policy(Datar, Rajan and Horngren, 2013).
Level of operations : CHTC can decide the level of operations in term of number of customers to
be served in order to cover the fixed cost incurred. In the above table it is clear that only if CHTC
takes 100 customers on trip it will be able to cover the fixed cost incurred on hotel and air fare.
1.2 Analysis of Pricing methods for Travel and Tourism Sector
Travel and tourism sector is highly competitive sector and therefore pricing is a crucial
decision to be undertaken. Pricing policy refers to amount charged from customers against
rendering the services(Kaplan and Atkinson, 2015). There are few pricing policies relevant for the
companies engaged in tourism business:
Competitive pricing policy
This policy emphasise on the pricing of services on the basis of competitors policy followed
by competitors at the same level. CHTC can price the trip to Caribbean holiday resort as per the
prices charged by Thomas cook for the same level of services provided. Further adjustments can be
made in pricing after considering the difference in quality of service and the market position.
Geographical Pricing
This pricing is used to charge different customers different amounts on the basis of their
geographical location. People travelling from far away countries will be charged more by CHTC as
5
compared to North America as the flight charges for later would be less due to minimal
geographical distance.
Cost plus Margin
This is the best pricing policy to be adopted to ascertain minimum profits in the form of margin
over cost. As per thsi pricing policy CHTC should prefer this policy for lareadyt established tour
packages as the cosyt is already known and only desired margin is to be sadded. However this
cannot be applied on new tour packages as exact costs are not clearly defined .
Penetration Pricing Policy
Penetration pricing policy is adopted when demand is elastic with prices and company wants
to act as entry barrier for the new entrants. Penetration policy emphasise on keeping the prices
lower at the initial stage of launching the service to gain the market share(Zadek, Evans and Pruzan,
2013). CHTC can launch the summer holiday trip to Caribbean at lower prices in comparison to
competitors and gain on volumes.
1.3 Factors influencing Profits for Travel and Tourism
Profits are the function of several factors affecting directly or indirectly. However cost, price
and volume affects the profits directly. Further changes in consumer taste and preferences or market
conditions will affect the volume and cost respectively.
Table 2: Factors influencing the profits
Factors Meaning Influence on profits
Cost Cost refers to the expense incurred for
making the services deliverable for the
client. It includes all the direct and
indirect cost. For example: air fare, hotel
rent, food, commission to agents etc.
Cost is in inverse relation with profits. If
the cost of CHTC increase the profits
will decline as the spread between price
and cost will reduce.
Volume Volume refers to number of customers
served. Volume is elastic to the price
charged.
This is in direct relation with profits. If
the number of customers increase the
profitability of CHTC will increase
automatically.
Price Price is the amount charged from
customer for the services. Price drives
Price is directly in relation with profits. If
the price of the services increases the
6
⊘ This is a preview!⊘
Do you want full access?
Subscribe today to unlock all pages.
Trusted by 1+ million students worldwide
the customer preference and ratings to
the company.
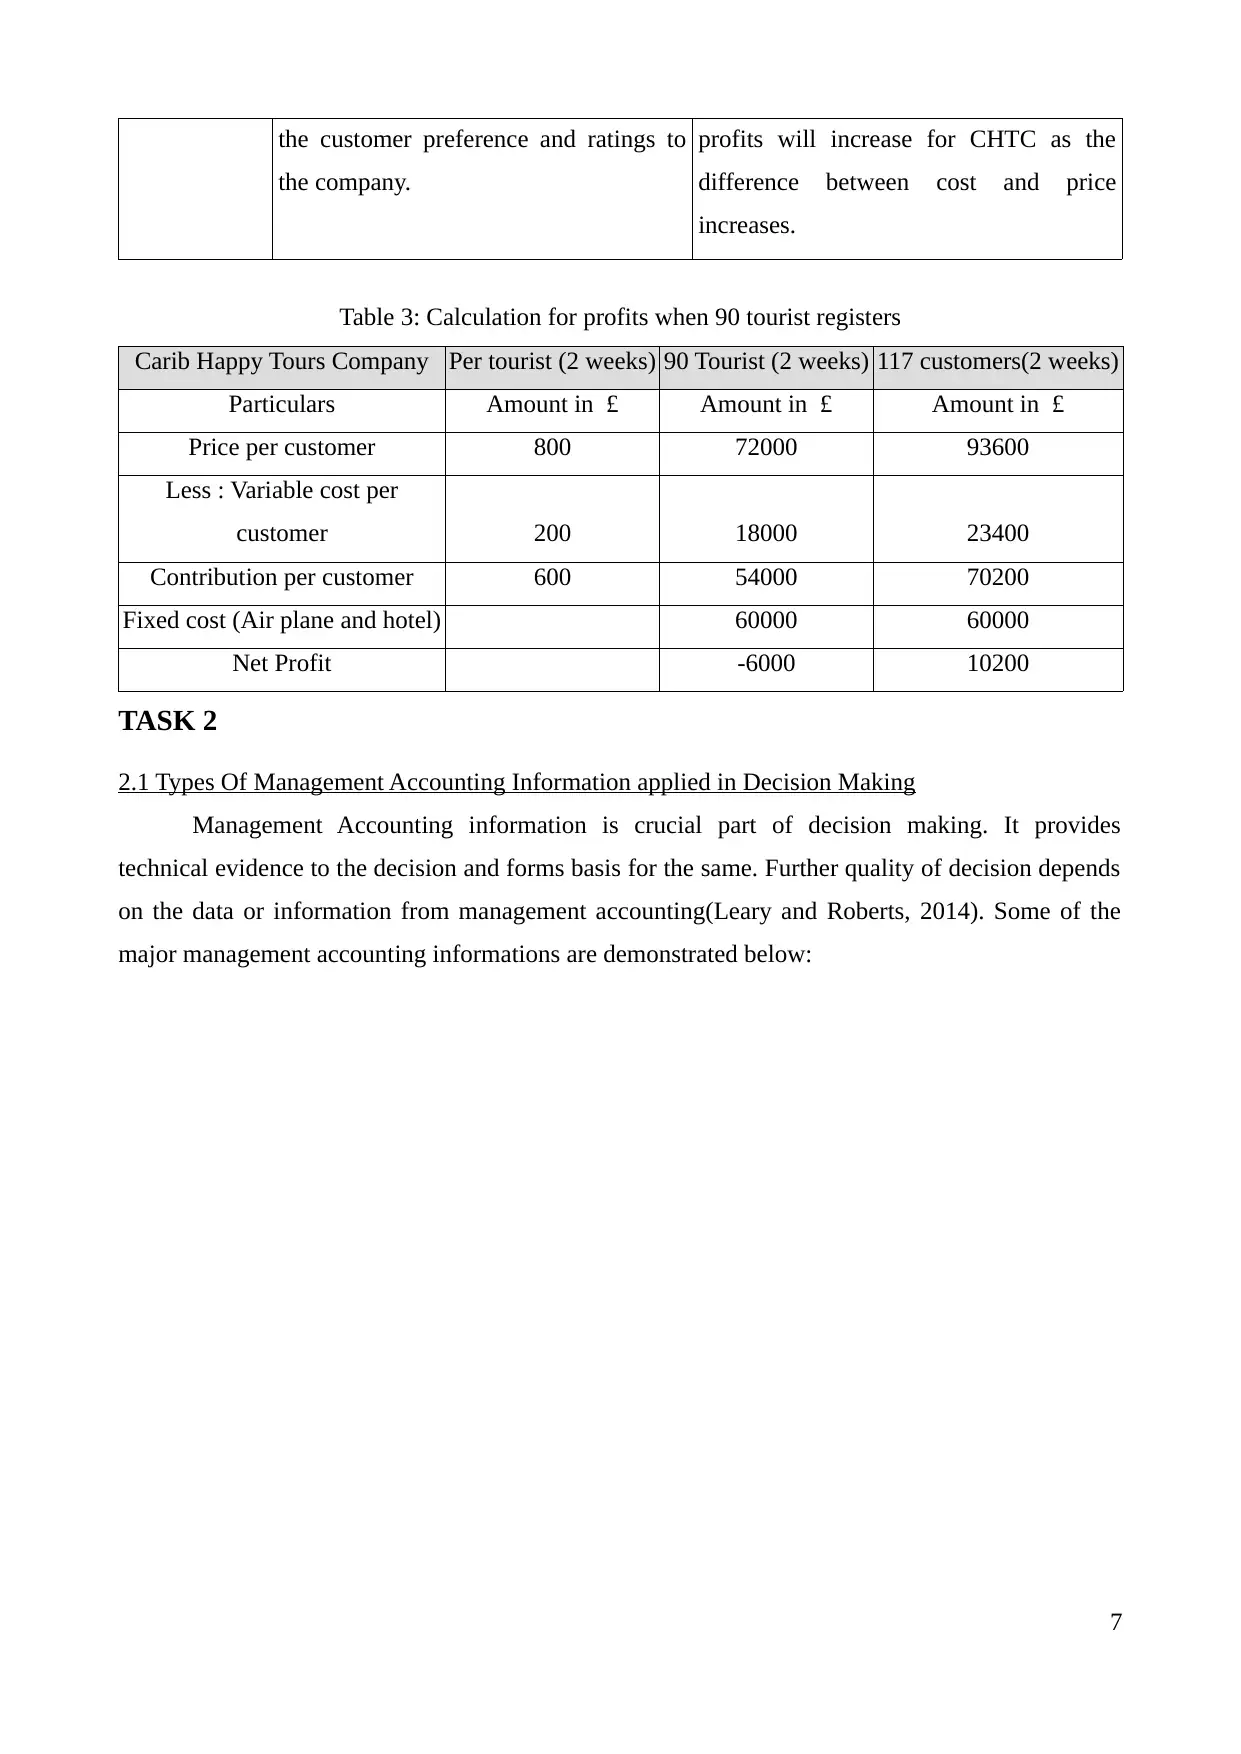
profits will increase for CHTC as the
difference between cost and price
increases.
Table 3: Calculation for profits when 90 tourist registers
Carib Happy Tours Company Per tourist (2 weeks) 90 Tourist (2 weeks) 117 customers(2 weeks)
Particulars Amount in £ Amount in £ Amount in £
Price per customer 800 72000 93600
Less : Variable cost per
customer 200 18000 23400
Contribution per customer 600 54000 70200
Fixed cost (Air plane and hotel) 60000 60000
Net Profit -6000 10200
TASK 2
2.1 Types Of Management Accounting Information applied in Decision Making
Management Accounting information is crucial part of decision making. It provides
technical evidence to the decision and forms basis for the same. Further quality of decision depends
on the data or information from management accounting(Leary and Roberts, 2014). Some of the
major management accounting informations are demonstrated below:
7
the company.
profits will increase for CHTC as the
difference between cost and price
increases.
Table 3: Calculation for profits when 90 tourist registers
Carib Happy Tours Company Per tourist (2 weeks) 90 Tourist (2 weeks) 117 customers(2 weeks)
Particulars Amount in £ Amount in £ Amount in £
Price per customer 800 72000 93600
Less : Variable cost per
customer 200 18000 23400
Contribution per customer 600 54000 70200
Fixed cost (Air plane and hotel) 60000 60000
Net Profit -6000 10200
TASK 2
2.1 Types Of Management Accounting Information applied in Decision Making
Management Accounting information is crucial part of decision making. It provides
technical evidence to the decision and forms basis for the same. Further quality of decision depends
on the data or information from management accounting(Leary and Roberts, 2014). Some of the
major management accounting informations are demonstrated below:
7
Paraphrase This Document
Need a fresh take? Get an instant paraphrase of this document with our AI Paraphraser
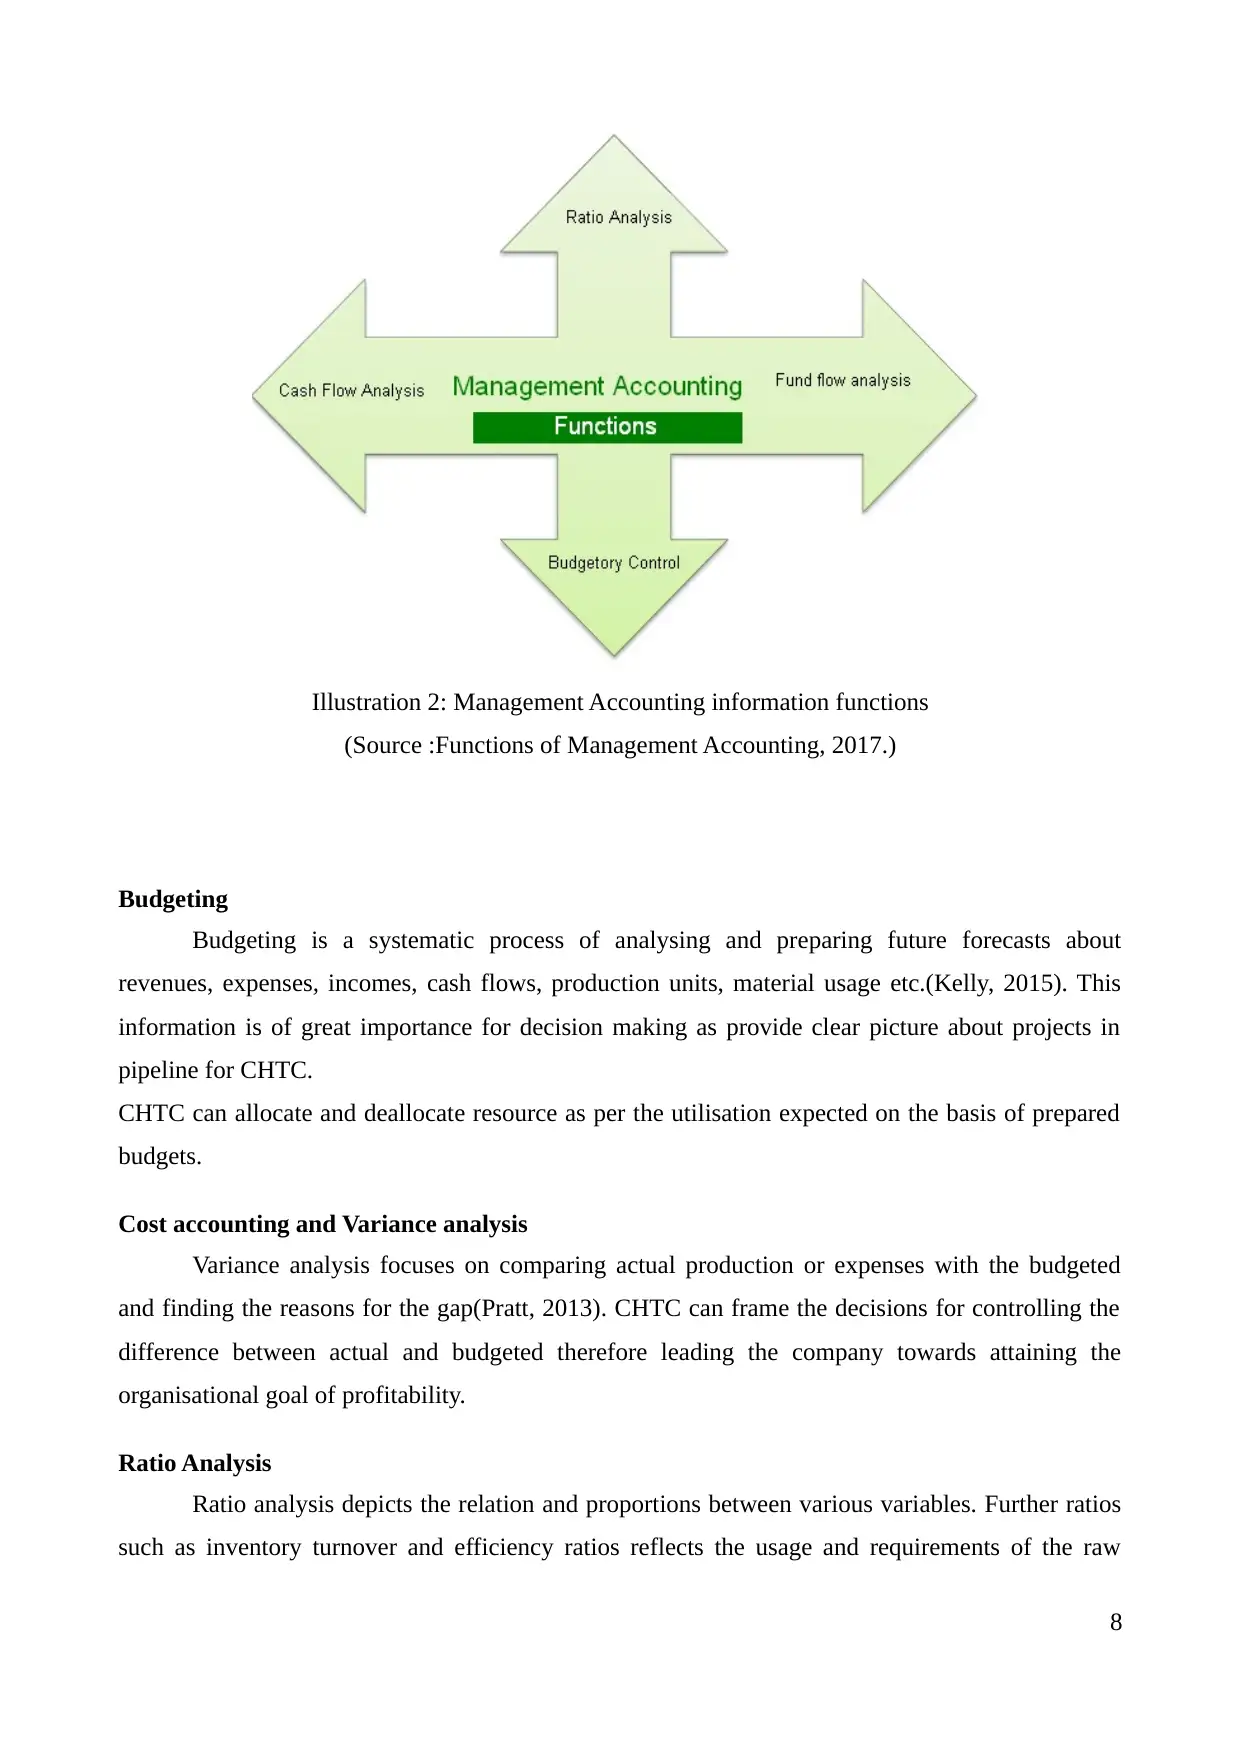
Budgeting
Budgeting is a systematic process of analysing and preparing future forecasts about
revenues, expenses, incomes, cash flows, production units, material usage etc.(Kelly, 2015). This
information is of great importance for decision making as provide clear picture about projects in
pipeline for CHTC.
CHTC can allocate and deallocate resource as per the utilisation expected on the basis of prepared
budgets.
Cost accounting and Variance analysis
Variance analysis focuses on comparing actual production or expenses with the budgeted
and finding the reasons for the gap(Pratt, 2013). CHTC can frame the decisions for controlling the
difference between actual and budgeted therefore leading the company towards attaining the
organisational goal of profitability.
Ratio Analysis
Ratio analysis depicts the relation and proportions between various variables. Further ratios
such as inventory turnover and efficiency ratios reflects the usage and requirements of the raw
8
Illustration 2: Management Accounting information functions
(Source :Functions of Management Accounting, 2017.)
material(Vogel, 2014). CHTC can utilise the data of ratios to take effective decisions for betterment
of company.
2.2 Use of investment Appraisal Techniques in decision making
Investment appraisal techniques are applied in business to evaluate projects which involves
huge initial cost since they are irreversible in nature and employed for long period of time(Baum
and Crosby, 2014). Generally projects are mutually exclusive due to some or the other constraint
such as funds therefore selection of best is desired outcome. Some of the investment appraisal
techniques are listed below with their respective application in tourism industry:
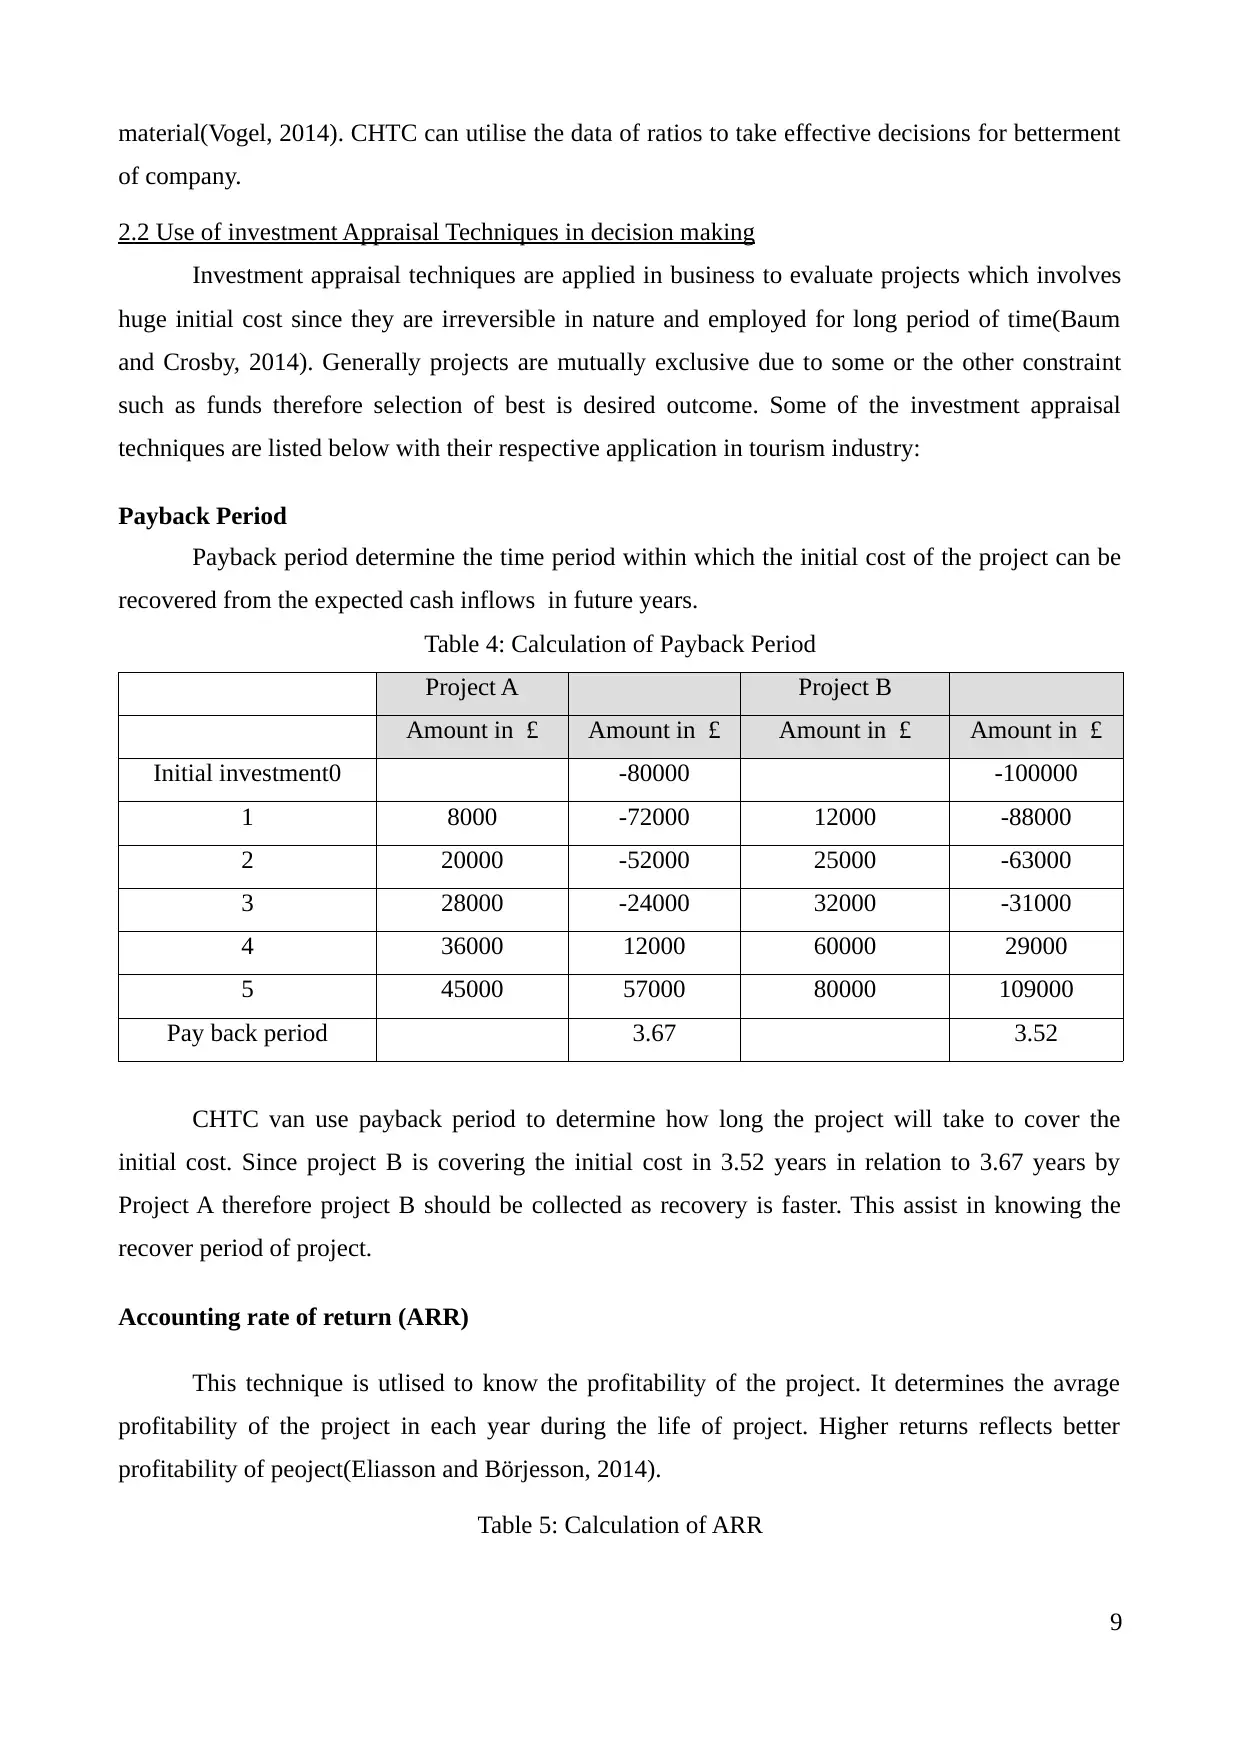
Payback Period
Payback period determine the time period within which the initial cost of the project can be
recovered from the expected cash inflows in future years.
Table 4: Calculation of Payback Period
Project A Project B
Amount in £ Amount in £ Amount in £ Amount in £
Initial investment0 -80000 -100000
1 8000 -72000 12000 -88000
2 20000 -52000 25000 -63000
3 28000 -24000 32000 -31000
4 36000 12000 60000 29000
5 45000 57000 80000 109000
Pay back period 3.67 3.52
CHTC van use payback period to determine how long the project will take to cover the
initial cost. Since project B is covering the initial cost in 3.52 years in relation to 3.67 years by
Project A therefore project B should be collected as recovery is faster. This assist in knowing the
recover period of project.
Accounting rate of return (ARR)
This technique is utlised to know the profitability of the project. It determines the avrage
profitability of the project in each year during the life of project. Higher returns reflects better
profitability of peoject(Eliasson and Börjesson, 2014).
Table 5: Calculation of ARR
9
of company.
2.2 Use of investment Appraisal Techniques in decision making
Investment appraisal techniques are applied in business to evaluate projects which involves
huge initial cost since they are irreversible in nature and employed for long period of time(Baum
and Crosby, 2014). Generally projects are mutually exclusive due to some or the other constraint
such as funds therefore selection of best is desired outcome. Some of the investment appraisal
techniques are listed below with their respective application in tourism industry:
Payback Period
Payback period determine the time period within which the initial cost of the project can be
recovered from the expected cash inflows in future years.
Table 4: Calculation of Payback Period
Project A Project B
Amount in £ Amount in £ Amount in £ Amount in £
Initial investment0 -80000 -100000
1 8000 -72000 12000 -88000
2 20000 -52000 25000 -63000
3 28000 -24000 32000 -31000
4 36000 12000 60000 29000
5 45000 57000 80000 109000
Pay back period 3.67 3.52
CHTC van use payback period to determine how long the project will take to cover the
initial cost. Since project B is covering the initial cost in 3.52 years in relation to 3.67 years by
Project A therefore project B should be collected as recovery is faster. This assist in knowing the
recover period of project.
Accounting rate of return (ARR)
This technique is utlised to know the profitability of the project. It determines the avrage
profitability of the project in each year during the life of project. Higher returns reflects better
profitability of peoject(Eliasson and Börjesson, 2014).
Table 5: Calculation of ARR
9
⊘ This is a preview!⊘
Do you want full access?
Subscribe today to unlock all pages.
Trusted by 1+ million students worldwide
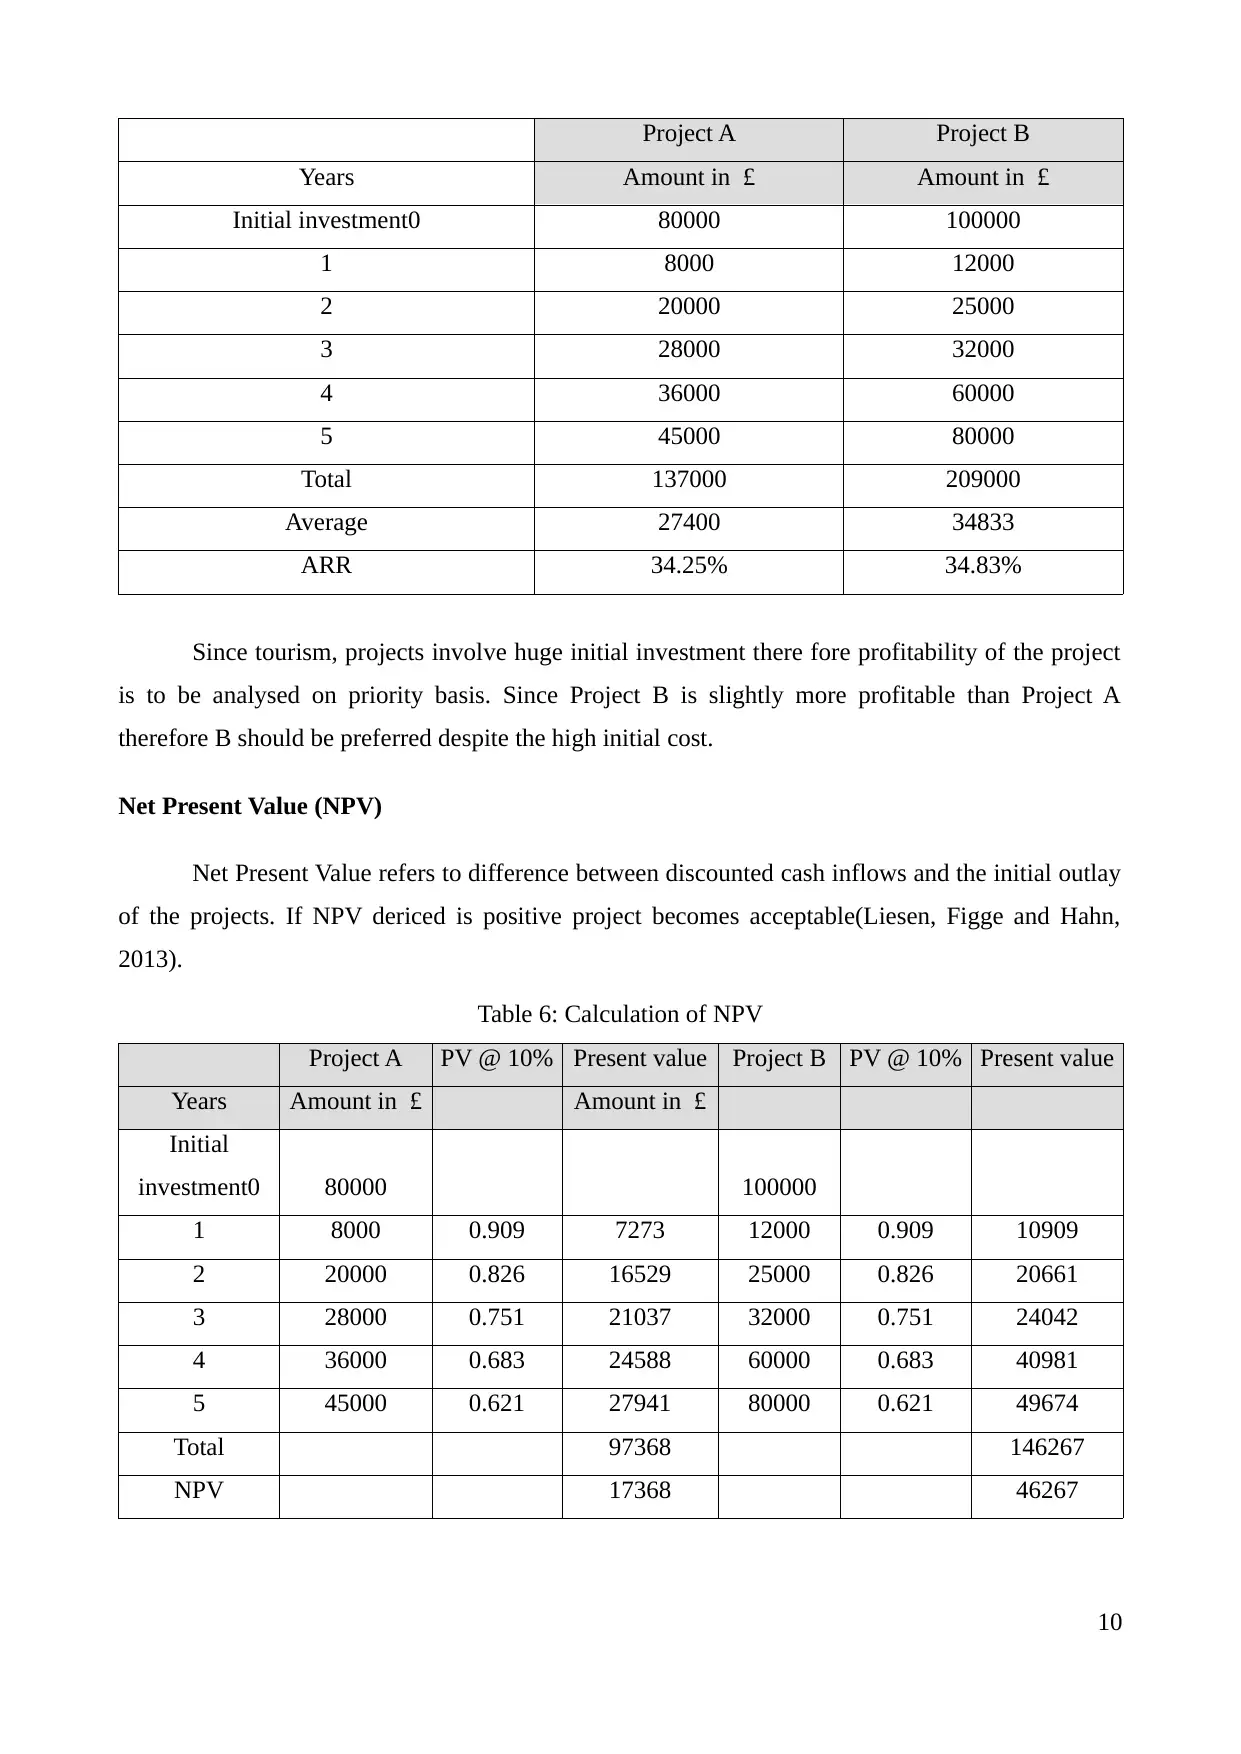
Project A Project B
Years Amount in £ Amount in £
Initial investment0 80000 100000
1 8000 12000
2 20000 25000
3 28000 32000
4 36000 60000
5 45000 80000
Total 137000 209000
Average 27400 34833
ARR 34.25% 34.83%
Since tourism, projects involve huge initial investment there fore profitability of the project
is to be analysed on priority basis. Since Project B is slightly more profitable than Project A
therefore B should be preferred despite the high initial cost.
Net Present Value (NPV)
Net Present Value refers to difference between discounted cash inflows and the initial outlay
of the projects. If NPV dericed is positive project becomes acceptable(Liesen, Figge and Hahn,
2013).
Table 6: Calculation of NPV
Project A PV @ 10% Present value Project B PV @ 10% Present value
Years Amount in £ Amount in £
Initial
investment0 80000 100000
1 8000 0.909 7273 12000 0.909 10909
2 20000 0.826 16529 25000 0.826 20661
3 28000 0.751 21037 32000 0.751 24042
4 36000 0.683 24588 60000 0.683 40981
5 45000 0.621 27941 80000 0.621 49674
Total 97368 146267
NPV 17368 46267
10
Years Amount in £ Amount in £
Initial investment0 80000 100000
1 8000 12000
2 20000 25000
3 28000 32000
4 36000 60000
5 45000 80000
Total 137000 209000
Average 27400 34833
ARR 34.25% 34.83%
Since tourism, projects involve huge initial investment there fore profitability of the project
is to be analysed on priority basis. Since Project B is slightly more profitable than Project A
therefore B should be preferred despite the high initial cost.
Net Present Value (NPV)
Net Present Value refers to difference between discounted cash inflows and the initial outlay
of the projects. If NPV dericed is positive project becomes acceptable(Liesen, Figge and Hahn,
2013).
Table 6: Calculation of NPV
Project A PV @ 10% Present value Project B PV @ 10% Present value
Years Amount in £ Amount in £
Initial
investment0 80000 100000
1 8000 0.909 7273 12000 0.909 10909
2 20000 0.826 16529 25000 0.826 20661
3 28000 0.751 21037 32000 0.751 24042
4 36000 0.683 24588 60000 0.683 40981
5 45000 0.621 27941 80000 0.621 49674
Total 97368 146267
NPV 17368 46267
10
Paraphrase This Document
Need a fresh take? Get an instant paraphrase of this document with our AI Paraphraser
This is most suitable tool of capital budgeting as it considers time value of money. Further
since the projects are mutually exclusive project B should be adopted with higher NPV generated.
NPV calculates the value added to CHTC with the acceptance of project.
Internal Rate of Return (IRR)
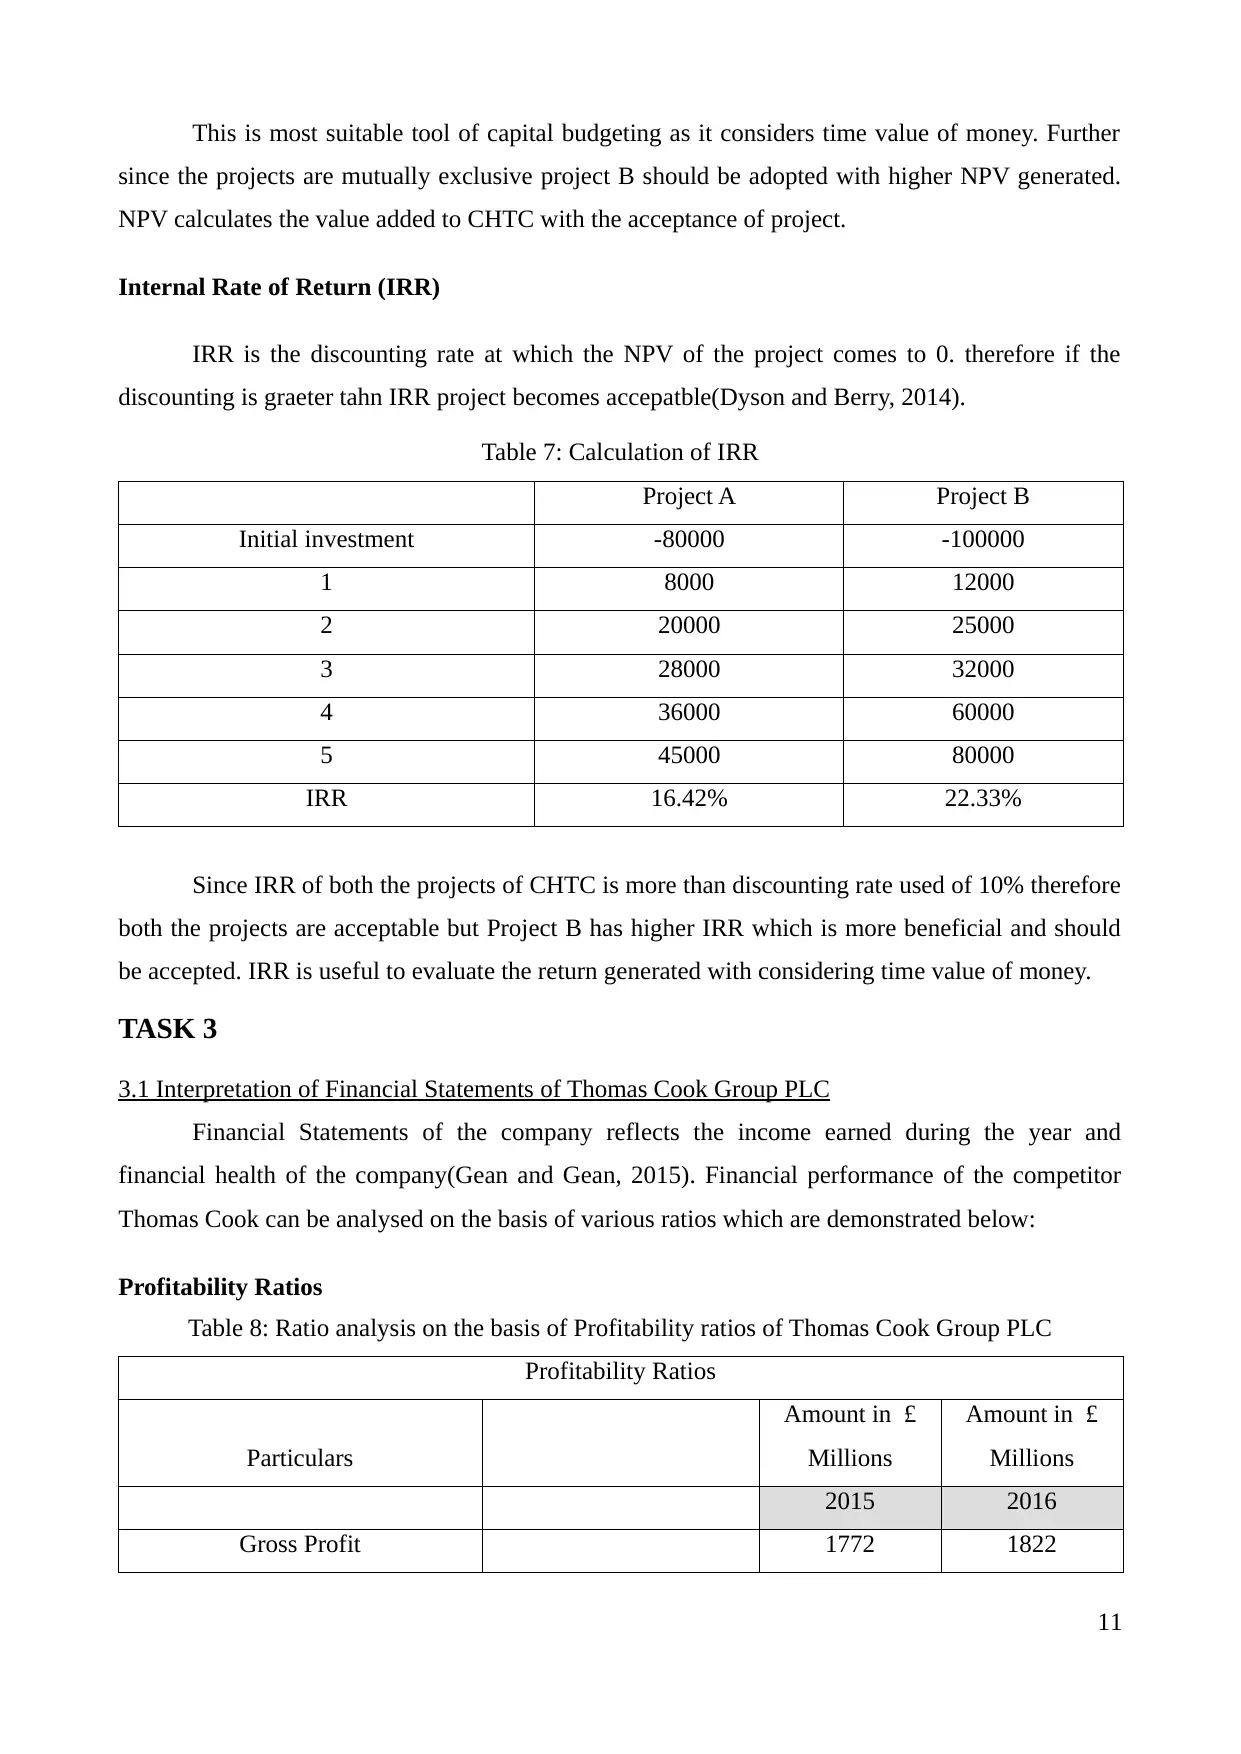
IRR is the discounting rate at which the NPV of the project comes to 0. therefore if the
discounting is graeter tahn IRR project becomes accepatble(Dyson and Berry, 2014).
Table 7: Calculation of IRR
Project A Project B
Initial investment -80000 -100000
1 8000 12000
2 20000 25000
3 28000 32000
4 36000 60000
5 45000 80000
IRR 16.42% 22.33%
Since IRR of both the projects of CHTC is more than discounting rate used of 10% therefore
both the projects are acceptable but Project B has higher IRR which is more beneficial and should
be accepted. IRR is useful to evaluate the return generated with considering time value of money.
TASK 3
3.1 Interpretation of Financial Statements of Thomas Cook Group PLC
Financial Statements of the company reflects the income earned during the year and
financial health of the company(Gean and Gean, 2015). Financial performance of the competitor
Thomas Cook can be analysed on the basis of various ratios which are demonstrated below:
Profitability Ratios
Table 8: Ratio analysis on the basis of Profitability ratios of Thomas Cook Group PLC
Profitability Ratios
Particulars
Amount in £
Millions
Amount in £
Millions
2015 2016
Gross Profit 1772 1822
11
since the projects are mutually exclusive project B should be adopted with higher NPV generated.
NPV calculates the value added to CHTC with the acceptance of project.
Internal Rate of Return (IRR)
IRR is the discounting rate at which the NPV of the project comes to 0. therefore if the
discounting is graeter tahn IRR project becomes accepatble(Dyson and Berry, 2014).
Table 7: Calculation of IRR
Project A Project B
Initial investment -80000 -100000
1 8000 12000
2 20000 25000
3 28000 32000
4 36000 60000
5 45000 80000
IRR 16.42% 22.33%
Since IRR of both the projects of CHTC is more than discounting rate used of 10% therefore
both the projects are acceptable but Project B has higher IRR which is more beneficial and should
be accepted. IRR is useful to evaluate the return generated with considering time value of money.
TASK 3
3.1 Interpretation of Financial Statements of Thomas Cook Group PLC
Financial Statements of the company reflects the income earned during the year and
financial health of the company(Gean and Gean, 2015). Financial performance of the competitor
Thomas Cook can be analysed on the basis of various ratios which are demonstrated below:
Profitability Ratios
Table 8: Ratio analysis on the basis of Profitability ratios of Thomas Cook Group PLC
Profitability Ratios
Particulars
Amount in £
Millions
Amount in £
Millions
2015 2016
Gross Profit 1772 1822
11
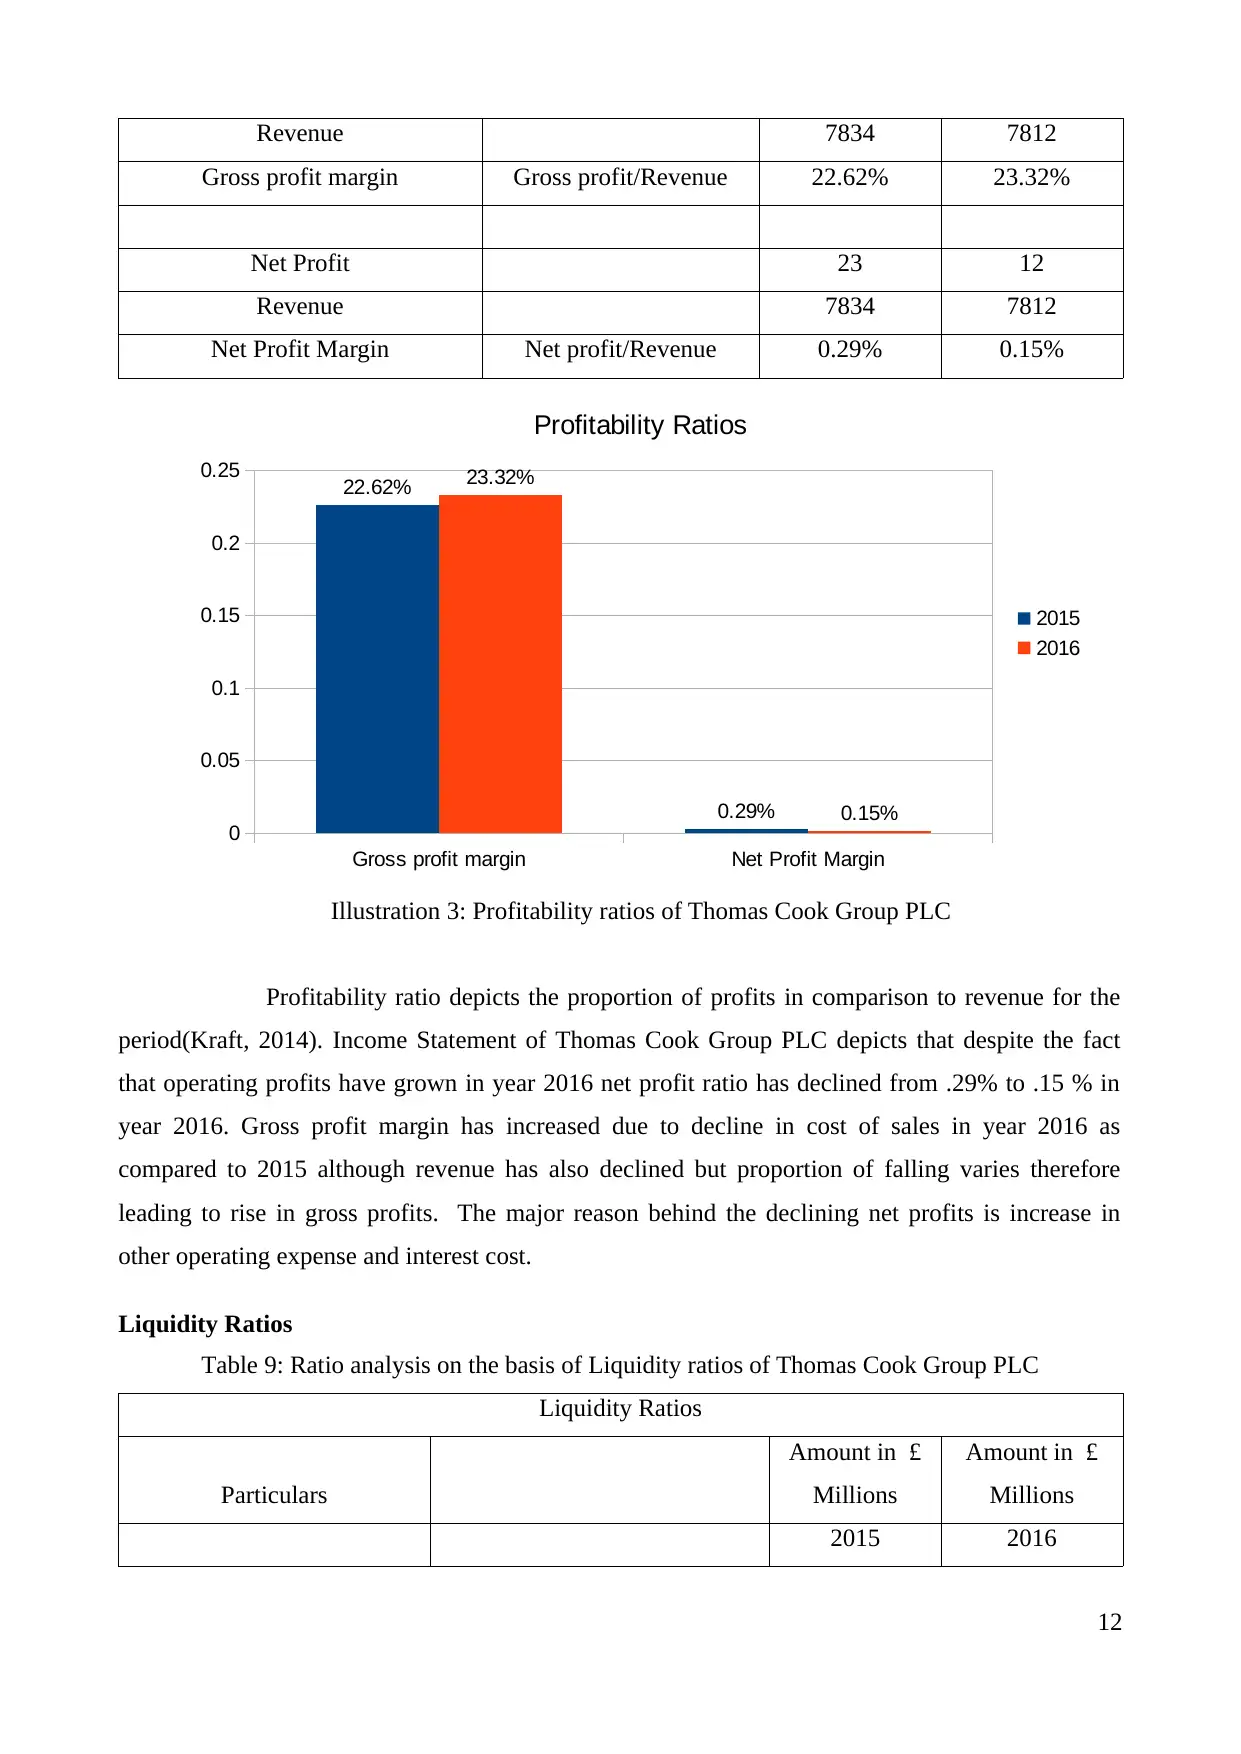
Revenue 7834 7812
Gross profit margin Gross profit/Revenue 22.62% 23.32%
Net Profit 23 12
Revenue 7834 7812
Net Profit Margin Net profit/Revenue 0.29% 0.15%
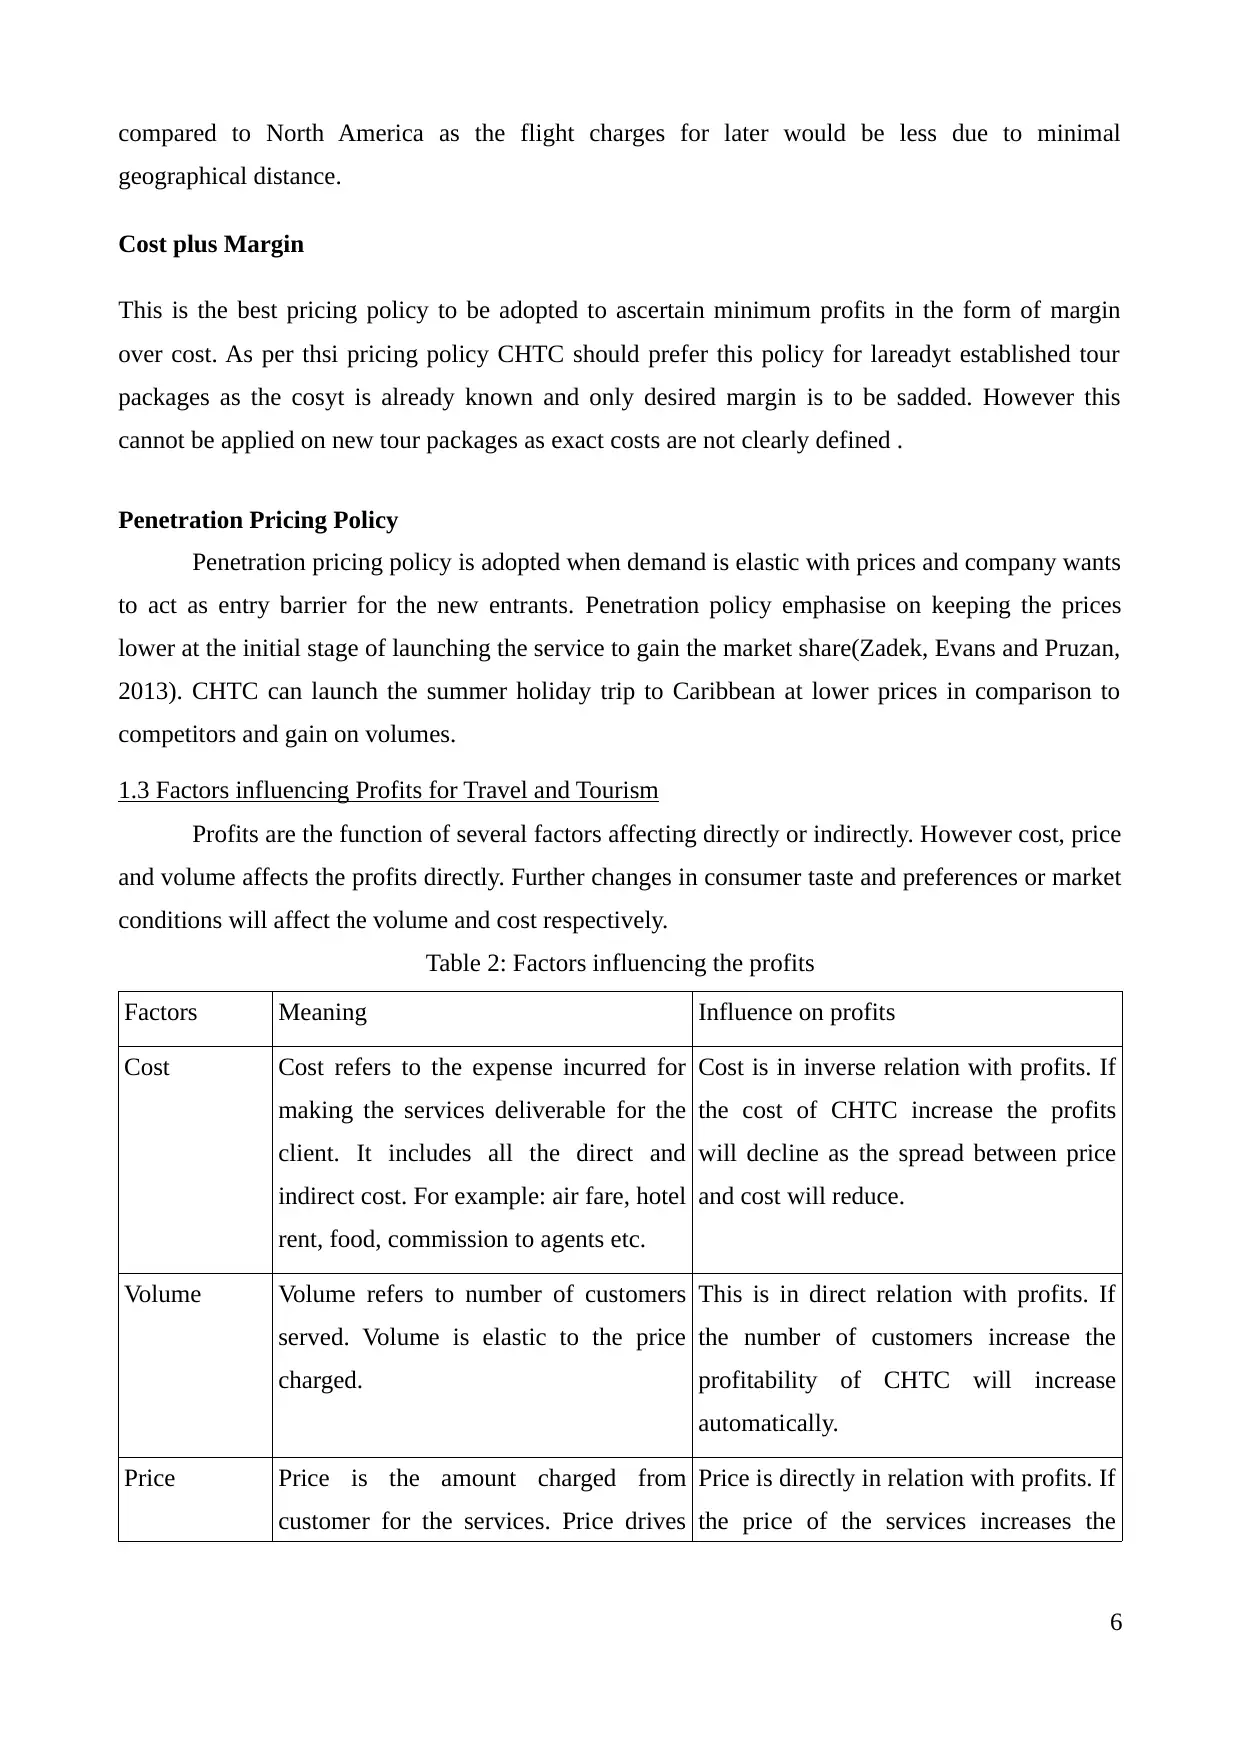
Profitability ratio depicts the proportion of profits in comparison to revenue for the
period(Kraft, 2014). Income Statement of Thomas Cook Group PLC depicts that despite the fact
that operating profits have grown in year 2016 net profit ratio has declined from .29% to .15 % in
year 2016. Gross profit margin has increased due to decline in cost of sales in year 2016 as
compared to 2015 although revenue has also declined but proportion of falling varies therefore
leading to rise in gross profits. The major reason behind the declining net profits is increase in
other operating expense and interest cost.
Liquidity Ratios
Table 9: Ratio analysis on the basis of Liquidity ratios of Thomas Cook Group PLC
Liquidity Ratios
Particulars
Amount in £
Millions
Amount in £
Millions
2015 2016
12
Gross profit margin Net Profit Margin
0
0.05
0.1
0.15
0.2
0.25 22.62%
0.29%
23.32%
0.15%
Profitability Ratios
2015
2016
Illustration 3: Profitability ratios of Thomas Cook Group PLC
Gross profit margin Gross profit/Revenue 22.62% 23.32%
Net Profit 23 12
Revenue 7834 7812
Net Profit Margin Net profit/Revenue 0.29% 0.15%
Profitability ratio depicts the proportion of profits in comparison to revenue for the
period(Kraft, 2014). Income Statement of Thomas Cook Group PLC depicts that despite the fact
that operating profits have grown in year 2016 net profit ratio has declined from .29% to .15 % in
year 2016. Gross profit margin has increased due to decline in cost of sales in year 2016 as
compared to 2015 although revenue has also declined but proportion of falling varies therefore
leading to rise in gross profits. The major reason behind the declining net profits is increase in
other operating expense and interest cost.
Liquidity Ratios
Table 9: Ratio analysis on the basis of Liquidity ratios of Thomas Cook Group PLC
Liquidity Ratios
Particulars
Amount in £
Millions
Amount in £
Millions
2015 2016
12
Gross profit margin Net Profit Margin
0
0.05
0.1
0.15
0.2
0.25 22.62%
0.29%
23.32%
0.15%
Profitability Ratios
2015
2016
Illustration 3: Profitability ratios of Thomas Cook Group PLC
⊘ This is a preview!⊘
Do you want full access?
Subscribe today to unlock all pages.
Trusted by 1+ million students worldwide
1 out of 18
Related Documents


Your All-in-One AI-Powered Toolkit for Academic Success.
+13062052269
info@desklib.com
Available 24*7 on WhatsApp / Email
![[object Object]](/_next/static/media/star-bottom.7253800d.svg)
Unlock your academic potential
Copyright © 2020–2026 A2Z Services. All Rights Reserved. Developed and managed by ZUCOL.