Finance and Funding in the Travel and Tourism Sector Report
VerifiedAdded on 2019/12/17
|13
|4190
|165
Report
AI Summary
This report provides a comprehensive analysis of finance and funding within the travel and tourism sector. It begins with an introduction to financial management, emphasizing the importance of costs and volume. The report delves into cost-volume-profit analysis, pricing methods (cost-plus, demand, and competition-based pricing), and factors influencing profitability, such as selling price, costs, sales volume, and market fluctuations. The report further interprets financial statements to assess the financial health of The Restaurant Group (TRG), utilizing ratio analysis as a key tool. Moreover, it explores the sources of finance relevant to the travel and tourism industry, concluding with an overview of the key financial considerations for businesses in this sector. The report uses Merlin Entertainment Plc and The Restaurant Group (TRG) as case studies to illustrate key concepts.
Finance and Funding in the Travel
and Tourism Sector
1
and Tourism Sector
1
Paraphrase This Document
Need a fresh take? Get an instant paraphrase of this document with our AI Paraphraser

TABLE OF CONTENTS
INTRODUCTION ..........................................................................................................................3
TASK 1............................................................................................................................................3
1.1 Importance of costs and volume in financial management of travel and tourism business ..3
1.2 Analysis of pricing methods used in travel and tourism sector ............................................4
1.3 Analysis of factors influencing profit for travel and tourism business .................................5
TASK 2............................................................................................................................................7
TASK 3 ...........................................................................................................................................7
3.1 Interpretation of Financial Statements...................................................................................7
TASK 4..........................................................................................................................................10
4.1 Analysis of Sources of Finance...........................................................................................10
CONCLUSION .............................................................................................................................11
REFERENCES..............................................................................................................................12
2
INTRODUCTION
Finance is at root of every business and growth of business depends on how effectively
the roots are managed. Merlin Entertainments Plc being one of the leading company in leisure
industry with foot prints across major continents. Tourism industry is one of the modern and
highly competitive industry with wide scope of innovation its pattern of providing services. This
report demonstrates the CVP analysis in the tourism industry and its applications. Further
management informations systems are explained with their roles in the decision making process.
Moreover this report lays focus on the sources of finance and their application in the tourism
industry (WisCombe and et.al., 2016). Performance evaluation of one of the leading restaurant
group of UK, The Restaurant Group (TRG) is conducted to assess the financial health of the
company.
TASK 1
1.1 Importance of costs and volume in financial management of travel and tourism business
The major concern of the owner of management is towards determination of the cost that
would be borne in future course of time. Such is required to be predicted on prior basis in order
to cut down the costs. There is presence of several types of costs that are being borne within the
organization of travel and tourism sector (Stewart, 2014). This has been enumerated in the
manner as below:
Variable cost: It is regarded as the cost which is borne by the firm and this changes with the
increase or decrease in the sales volume in the firm such as Merlin Entertainment. It is
considered as one of the essential segment that is being utilized in firm like commission paid to
all the travel agents appointed for the sake of selling all services related with travel. The variable
nature of the services that are being offered would be liable to offer commission to all the agents
who are specifically being appointed for such purpose. The services relating with advertising and
marketing would be incurred by this business so as to attract greater number of customers
towards firm that is Merlin Entertainment as it is faces tough competition from its rivalries in the
market (Ciplet, Roberts and Khan, 2013).
Fixed cost: The rigid expenses are borne within the organization which are not influenced with
the sales volume that is prevailing in the firm. The expenses such as rent space taken on rent for
3
⊘ This is a preview!⊘
Do you want full access?
Subscribe today to unlock all pages.
Trusted by 1+ million students worldwide
establishment of the office is considered as fixed cost that is considered as fixed cots. This is
required to be paid every month whether it is being taken into utilization or it is left idle. The
cost of licensing is also fixed for the business that has to be repaid at specific duration of time
without seeking for the profitability that is earned by business.
Cost volume profit analysis is considered as most common tool that is being used in
management accounting. It has major role in determination of the cost that is borne by the firm in
bringing out the internal potential of the firm through assistance of breakeven point as well as
margin of safety (Huff and Rogers, 2015). The CVP analysis is useful for the management as
such it offers an understanding regarding the effects as well as interrelationship factors that
influence the profitability of the organization. The association among the cost, volume as well as
profit makes up the structure of profit of the business. Thus CVP relationship becomes important
for the budgeting as well as planning of the profitability. Cost volume profit analysis is one that
Merlin Entertainment can use towards figuring out the manner in which changes in the cost as
well as profit affects the operating income and net income. It works through comparison of
varied association like cost of operating as well as production of goods, the amount of goods sold
as well as profit that is being generated from the sales of those products (Inderst, 2013).
1.2 Analysis of pricing methods used in travel and tourism sector
The role of travel and tourism sector has enhanced with the external difficulties
increasing in the external business environment. It is considered as one of the integral parts of
the entire hospitality sector as there is increase in the global exposure of this sector that is
increasing the level of the specific travel and tourism sector. The firm is required to meet varied
quality assurance tools for the purpose of making delivery of quality relates services to all kinds
of customers (Bennett, Naylor and Mellor, 2015). The price sensitiveness can dominate the entire
market through affecting the business in terms of reducing the prices to attract higher customer
base for the product that is being offered by them. The development of varied tour packages is
important for the purpose of adding up extra features so as to lure varied variety of customers.
Pricing is considered as important segment of the standard marketing mix that enhances the
significance of pricing. As such just designing as well as manufacturing of the product is not
adequate until it is being sold to the final target market. The different pricing methods that are
being used by travel and tourism sector are enumerated in the manner stated as under:
4
Paraphrase This Document
Need a fresh take? Get an instant paraphrase of this document with our AI Paraphraser
Cost plus profit pricing: It is one of the widely used concept that assists in promoting the
primary aim of the firm that is towards attainment of profit while carrying out the
business operations in fair as well as ethical manner. Under this method a certain
percentage of profit margin is added to the overall cost of product or service. The cost
that is being includes in this is related with cost of designing, cost of rent, visa cost,
accommodation, cost of packaging and eating cost(Minsky, 2015). The tour package is
comprised of varied components that are being joint together. This increases the cost and
thereby affect the selling price of the product and service to a greater extent.
Demand pricing: It is considered as another pricing method wherein the price of product
is being finalized in accordance with the demand. In case demand of the product is higher
an organization can prefer to set higher prices of the product for the purpose of gaining
huge profitability. However in case the demand of the product is less is lower less prices
is being charged for attracting the customers. The success of the demand based pricing is
dependent on the potential of the marketers towards making analysis of the demand. Such
kind of pricing is popular in case of travel industry (Audretsch and et.al., 2016). For
instance, airlines while the period of lower demand charge lesser rates in comparison
with higher demand. Demand based pricing assist the business to earn greater
profitability in case the customers make acceptance of the product at the price more than
its cost.
Competition based pricing: It is considered as another method in which firm takes into
account the prices of the competitors product so as to set the prices of own products. The
firm can charge higher, lower or equal prices in comparison with the prices of
competitors. The aviation industry is regarded as the best example of the competition
based pricing wherein airlines charge the similar or fewer prices of the same routes as it
is being charged by their competitors (Eyckmans, Fankhauser and Kverndokk, 2016).
1.3 Analysis of factors influencing profit for travel and tourism business
The factors that dominates the whole market in beating varied kind of customers who are
influenced towards the reduction in the cost related activities of the business. It acts as an aid in
increasing the business through upliftment of the present status towards the higher position
within the market. Such achievement can be earned by means of making important changes
5
within the external market that is combination of varied factors that are influencing the present
performance of the organization. The firm is required to take into account several factors that
would act as an aid for the organization in enhancing their present financial situation. There is
presence of numerous factors that affects the business yield in positive or negative manner. The
factor that would affect the profit for travel and tourism business are enumerated in the manner
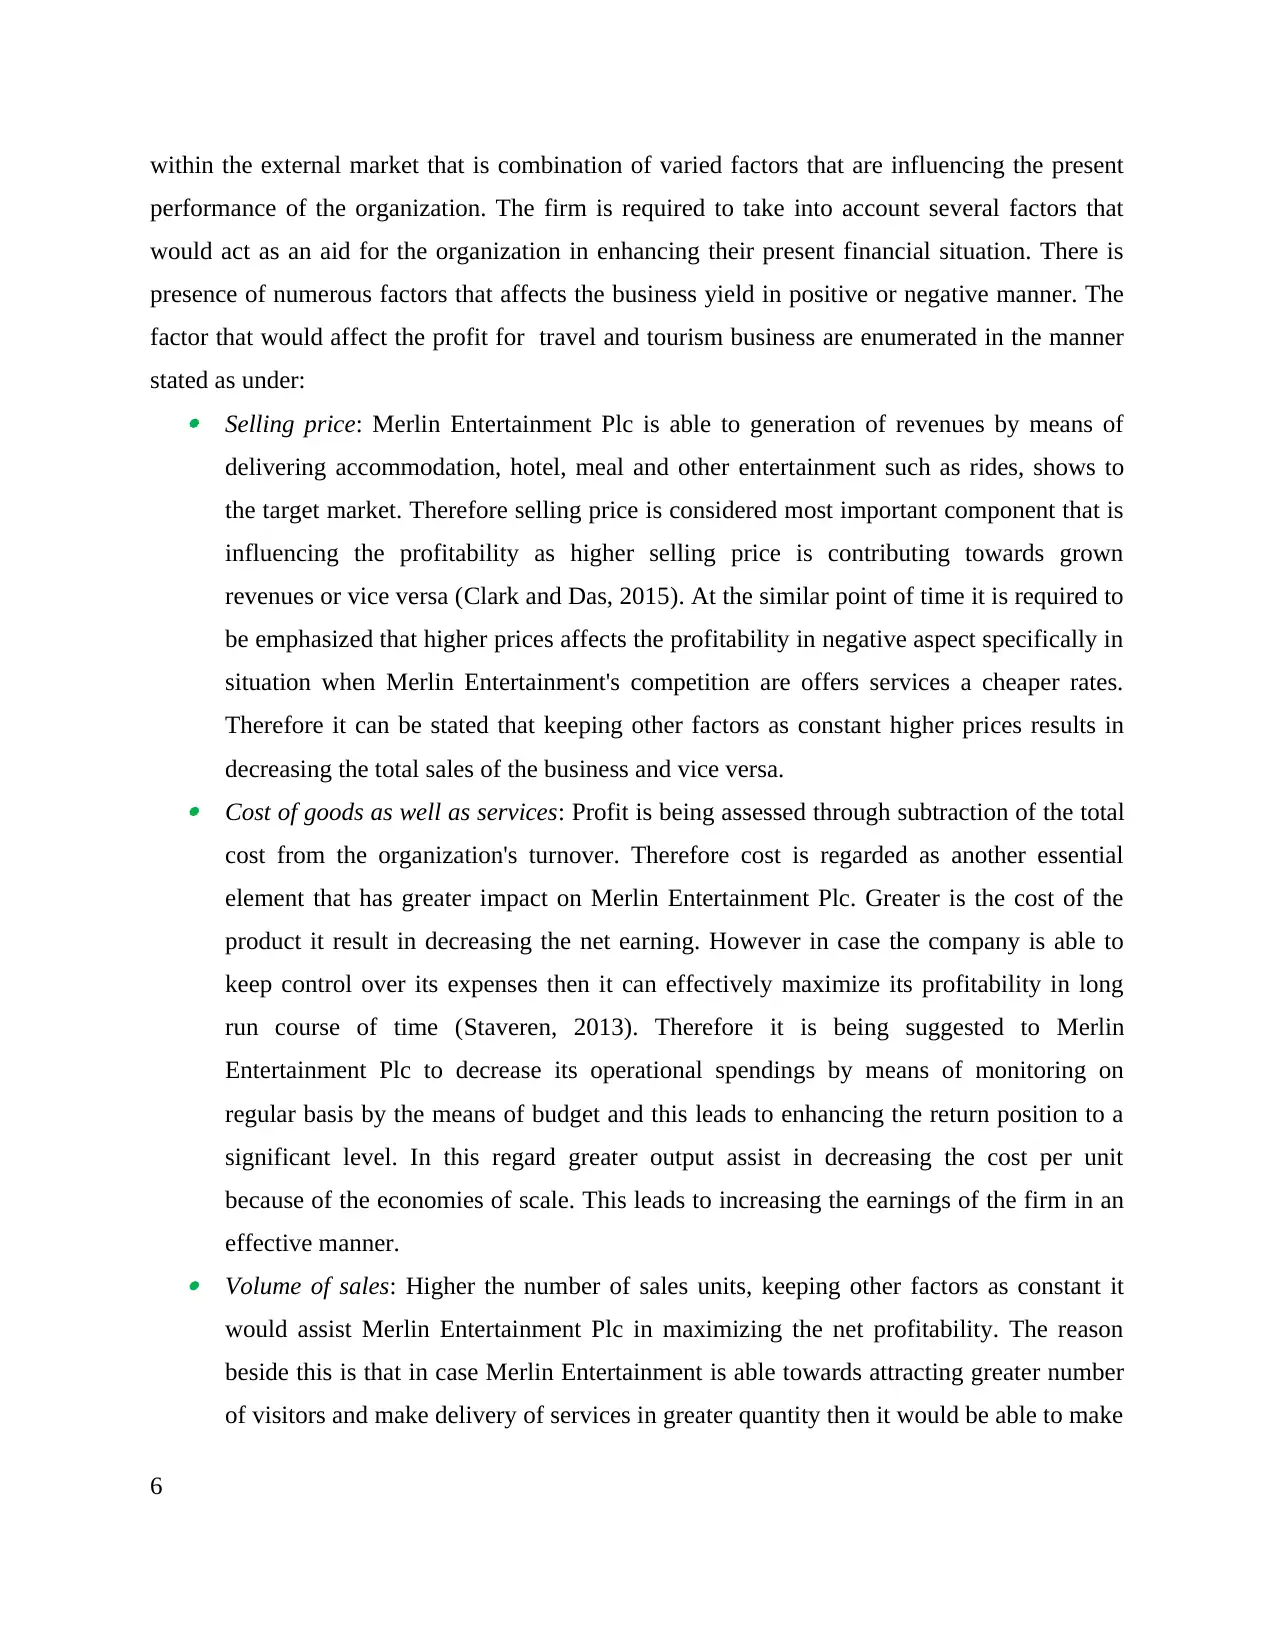
stated as under: Selling price: Merlin Entertainment Plc is able to generation of revenues by means of
delivering accommodation, hotel, meal and other entertainment such as rides, shows to
the target market. Therefore selling price is considered most important component that is
influencing the profitability as higher selling price is contributing towards grown
revenues or vice versa (Clark and Das, 2015). At the similar point of time it is required to
be emphasized that higher prices affects the profitability in negative aspect specifically in
situation when Merlin Entertainment's competition are offers services a cheaper rates.
Therefore it can be stated that keeping other factors as constant higher prices results in
decreasing the total sales of the business and vice versa. Cost of goods as well as services: Profit is being assessed through subtraction of the total
cost from the organization's turnover. Therefore cost is regarded as another essential
element that has greater impact on Merlin Entertainment Plc. Greater is the cost of the
product it result in decreasing the net earning. However in case the company is able to
keep control over its expenses then it can effectively maximize its profitability in long
run course of time (Staveren, 2013). Therefore it is being suggested to Merlin
Entertainment Plc to decrease its operational spendings by means of monitoring on
regular basis by the means of budget and this leads to enhancing the return position to a
significant level. In this regard greater output assist in decreasing the cost per unit
because of the economies of scale. This leads to increasing the earnings of the firm in an
effective manner. Volume of sales: Higher the number of sales units, keeping other factors as constant it
would assist Merlin Entertainment Plc in maximizing the net profitability. The reason
beside this is that in case Merlin Entertainment is able towards attracting greater number
of visitors and make delivery of services in greater quantity then it would be able to make
6
performance of the organization. The firm is required to take into account several factors that
would act as an aid for the organization in enhancing their present financial situation. There is
presence of numerous factors that affects the business yield in positive or negative manner. The
factor that would affect the profit for travel and tourism business are enumerated in the manner
stated as under: Selling price: Merlin Entertainment Plc is able to generation of revenues by means of
delivering accommodation, hotel, meal and other entertainment such as rides, shows to
the target market. Therefore selling price is considered most important component that is
influencing the profitability as higher selling price is contributing towards grown
revenues or vice versa (Clark and Das, 2015). At the similar point of time it is required to
be emphasized that higher prices affects the profitability in negative aspect specifically in
situation when Merlin Entertainment's competition are offers services a cheaper rates.
Therefore it can be stated that keeping other factors as constant higher prices results in
decreasing the total sales of the business and vice versa. Cost of goods as well as services: Profit is being assessed through subtraction of the total
cost from the organization's turnover. Therefore cost is regarded as another essential
element that has greater impact on Merlin Entertainment Plc. Greater is the cost of the
product it result in decreasing the net earning. However in case the company is able to
keep control over its expenses then it can effectively maximize its profitability in long
run course of time (Staveren, 2013). Therefore it is being suggested to Merlin
Entertainment Plc to decrease its operational spendings by means of monitoring on
regular basis by the means of budget and this leads to enhancing the return position to a
significant level. In this regard greater output assist in decreasing the cost per unit
because of the economies of scale. This leads to increasing the earnings of the firm in an
effective manner. Volume of sales: Higher the number of sales units, keeping other factors as constant it
would assist Merlin Entertainment Plc in maximizing the net profitability. The reason
beside this is that in case Merlin Entertainment is able towards attracting greater number
of visitors and make delivery of services in greater quantity then it would be able to make
6
⊘ This is a preview!⊘
Do you want full access?
Subscribe today to unlock all pages.
Trusted by 1+ million students worldwide
generation greater revenue at the similar level of the cost. Thus it acts as an aid in
increasing the profitability.
Market fluctuations: The hospitality industry success to a greater extent is based on the
level of the customer satisfaction. While within the market wider range of fluctuations
can be viewed with respect to customer taste, preferences as well as attitude. Therefore
Merlin Entertainment would be influenced by the seasonal variations as well as
alterations in the social preferences. Further the alterations within the political rules as
well as regulations and the economic condition influence the profitability of organization
to a significant level (McCann, 2014).
Therefore after taking into consideration all the components it can be suggested that
manager of Merlin Entertainment Plc needs to increase the sales and selling price upto a level
that is accepted. Further it is required to keep track on their routine expenses in order to
minimize the cost as well as increase the profitability to a significant level.
TASK 2
Covered in PPT
TASK 3
3.1 Interpretation of Financial Statements
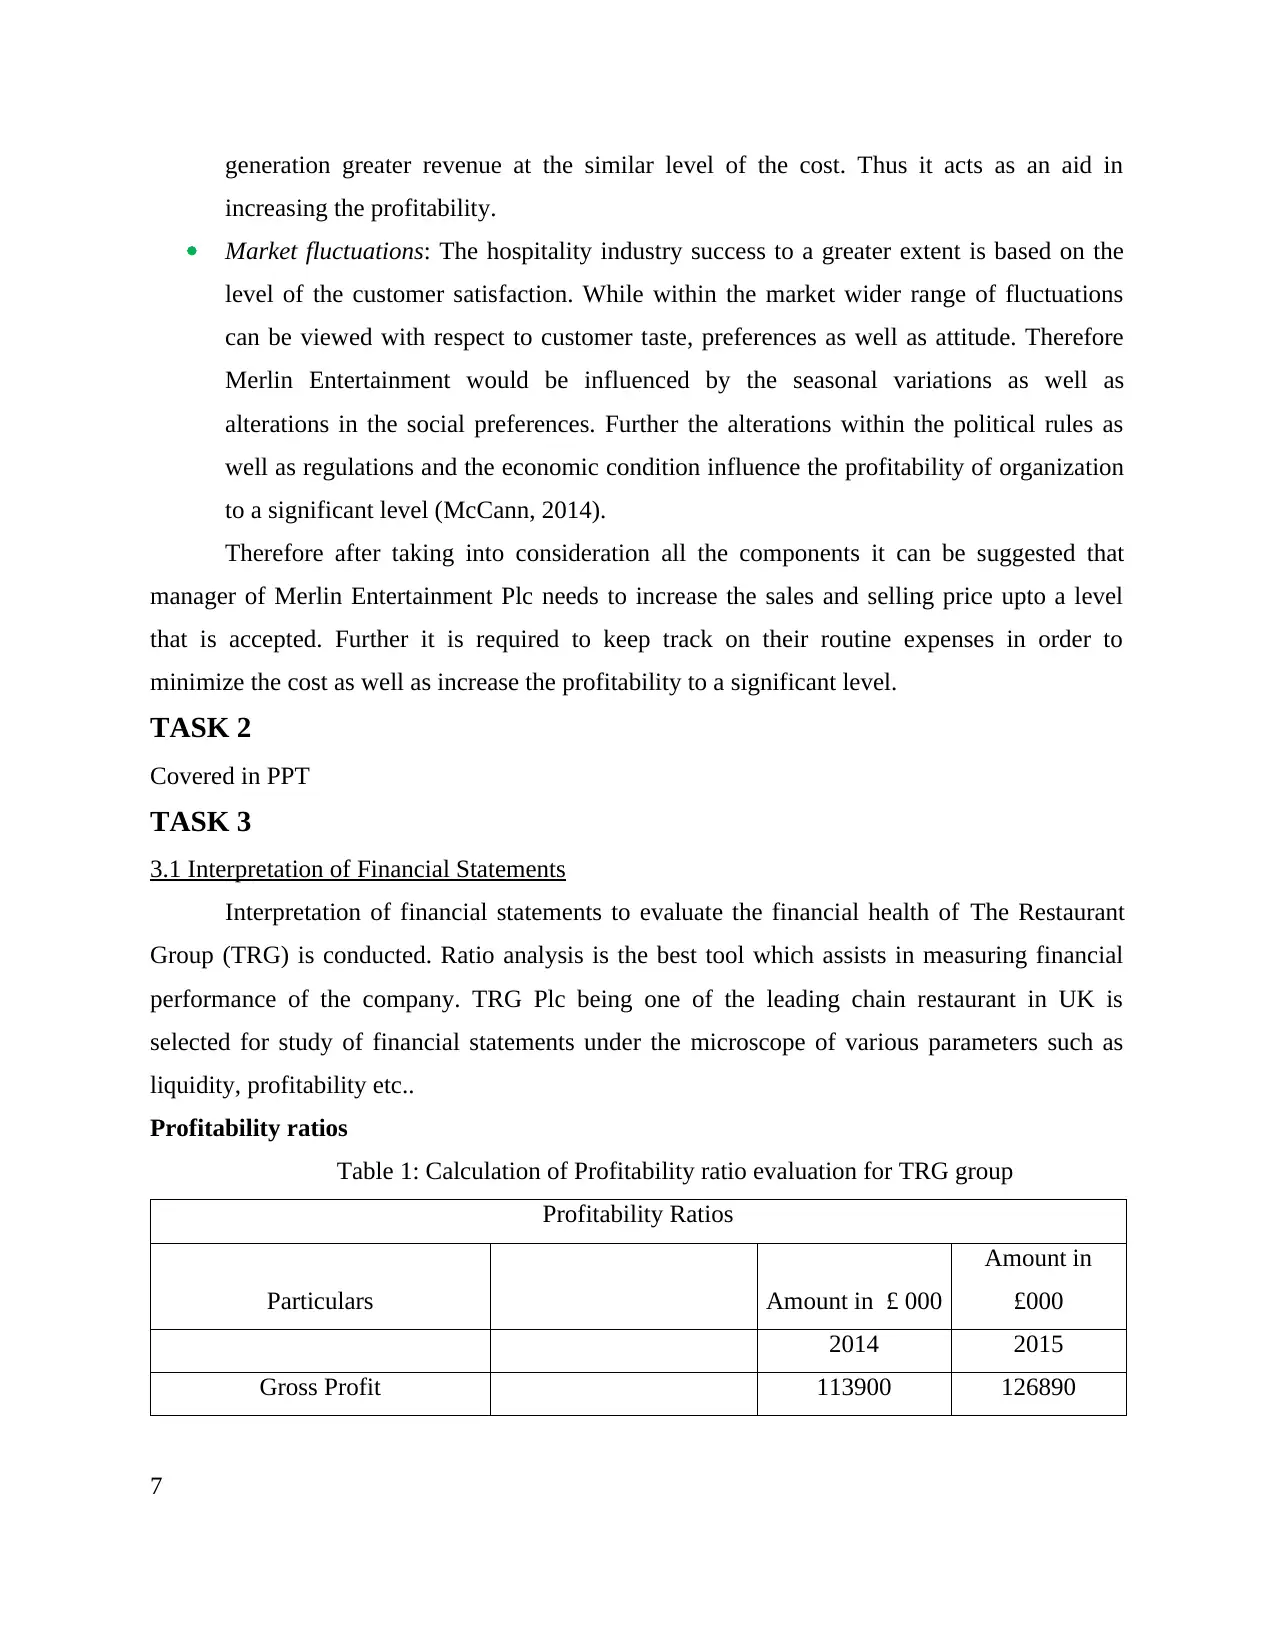
Interpretation of financial statements to evaluate the financial health of The Restaurant
Group (TRG) is conducted. Ratio analysis is the best tool which assists in measuring financial
performance of the company. TRG Plc being one of the leading chain restaurant in UK is
selected for study of financial statements under the microscope of various parameters such as
liquidity, profitability etc..
Profitability ratios
Table 1: Calculation of Profitability ratio evaluation for TRG group
Profitability Ratios
Particulars Amount in £ 000
Amount in
£000
2014 2015
Gross Profit 113900 126890
7
increasing the profitability.
Market fluctuations: The hospitality industry success to a greater extent is based on the
level of the customer satisfaction. While within the market wider range of fluctuations
can be viewed with respect to customer taste, preferences as well as attitude. Therefore
Merlin Entertainment would be influenced by the seasonal variations as well as
alterations in the social preferences. Further the alterations within the political rules as
well as regulations and the economic condition influence the profitability of organization
to a significant level (McCann, 2014).
Therefore after taking into consideration all the components it can be suggested that
manager of Merlin Entertainment Plc needs to increase the sales and selling price upto a level
that is accepted. Further it is required to keep track on their routine expenses in order to
minimize the cost as well as increase the profitability to a significant level.
TASK 2
Covered in PPT
TASK 3
3.1 Interpretation of Financial Statements
Interpretation of financial statements to evaluate the financial health of The Restaurant
Group (TRG) is conducted. Ratio analysis is the best tool which assists in measuring financial
performance of the company. TRG Plc being one of the leading chain restaurant in UK is
selected for study of financial statements under the microscope of various parameters such as
liquidity, profitability etc..
Profitability ratios
Table 1: Calculation of Profitability ratio evaluation for TRG group
Profitability Ratios
Particulars Amount in £ 000
Amount in
£000
2014 2015
Gross Profit 113900 126890
7
Paraphrase This Document
Need a fresh take? Get an instant paraphrase of this document with our AI Paraphraser
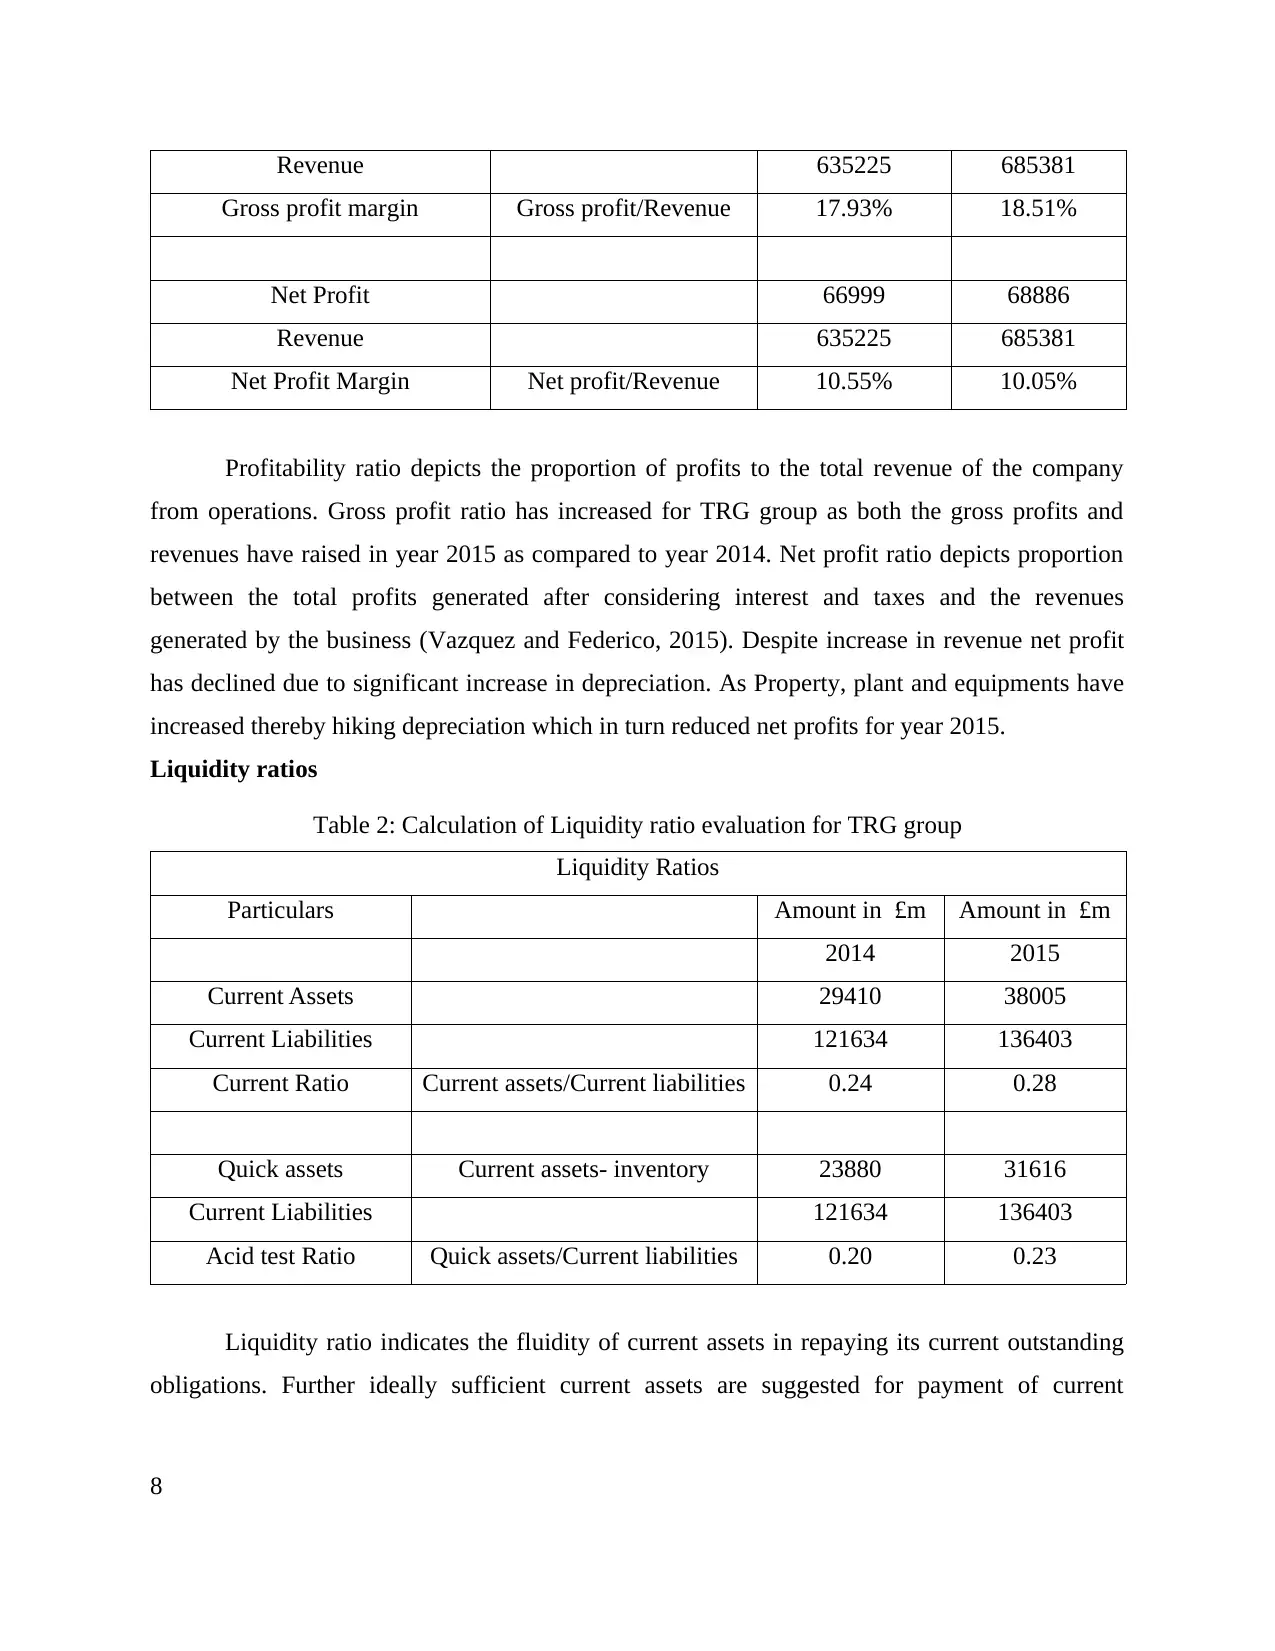
Revenue 635225 685381
Gross profit margin Gross profit/Revenue 17.93% 18.51%
Net Profit 66999 68886
Revenue 635225 685381
Net Profit Margin Net profit/Revenue 10.55% 10.05%
Profitability ratio depicts the proportion of profits to the total revenue of the company
from operations. Gross profit ratio has increased for TRG group as both the gross profits and
revenues have raised in year 2015 as compared to year 2014. Net profit ratio depicts proportion
between the total profits generated after considering interest and taxes and the revenues
generated by the business (Vazquez and Federico, 2015). Despite increase in revenue net profit
has declined due to significant increase in depreciation. As Property, plant and equipments have
increased thereby hiking depreciation which in turn reduced net profits for year 2015.
Liquidity ratios
Table 2: Calculation of Liquidity ratio evaluation for TRG group
Liquidity Ratios
Particulars Amount in £m Amount in £m
2014 2015
Current Assets 29410 38005
Current Liabilities 121634 136403
Current Ratio Current assets/Current liabilities 0.24 0.28
Quick assets Current assets- inventory 23880 31616
Current Liabilities 121634 136403
Acid test Ratio Quick assets/Current liabilities 0.20 0.23
Liquidity ratio indicates the fluidity of current assets in repaying its current outstanding
obligations. Further ideally sufficient current assets are suggested for payment of current
8
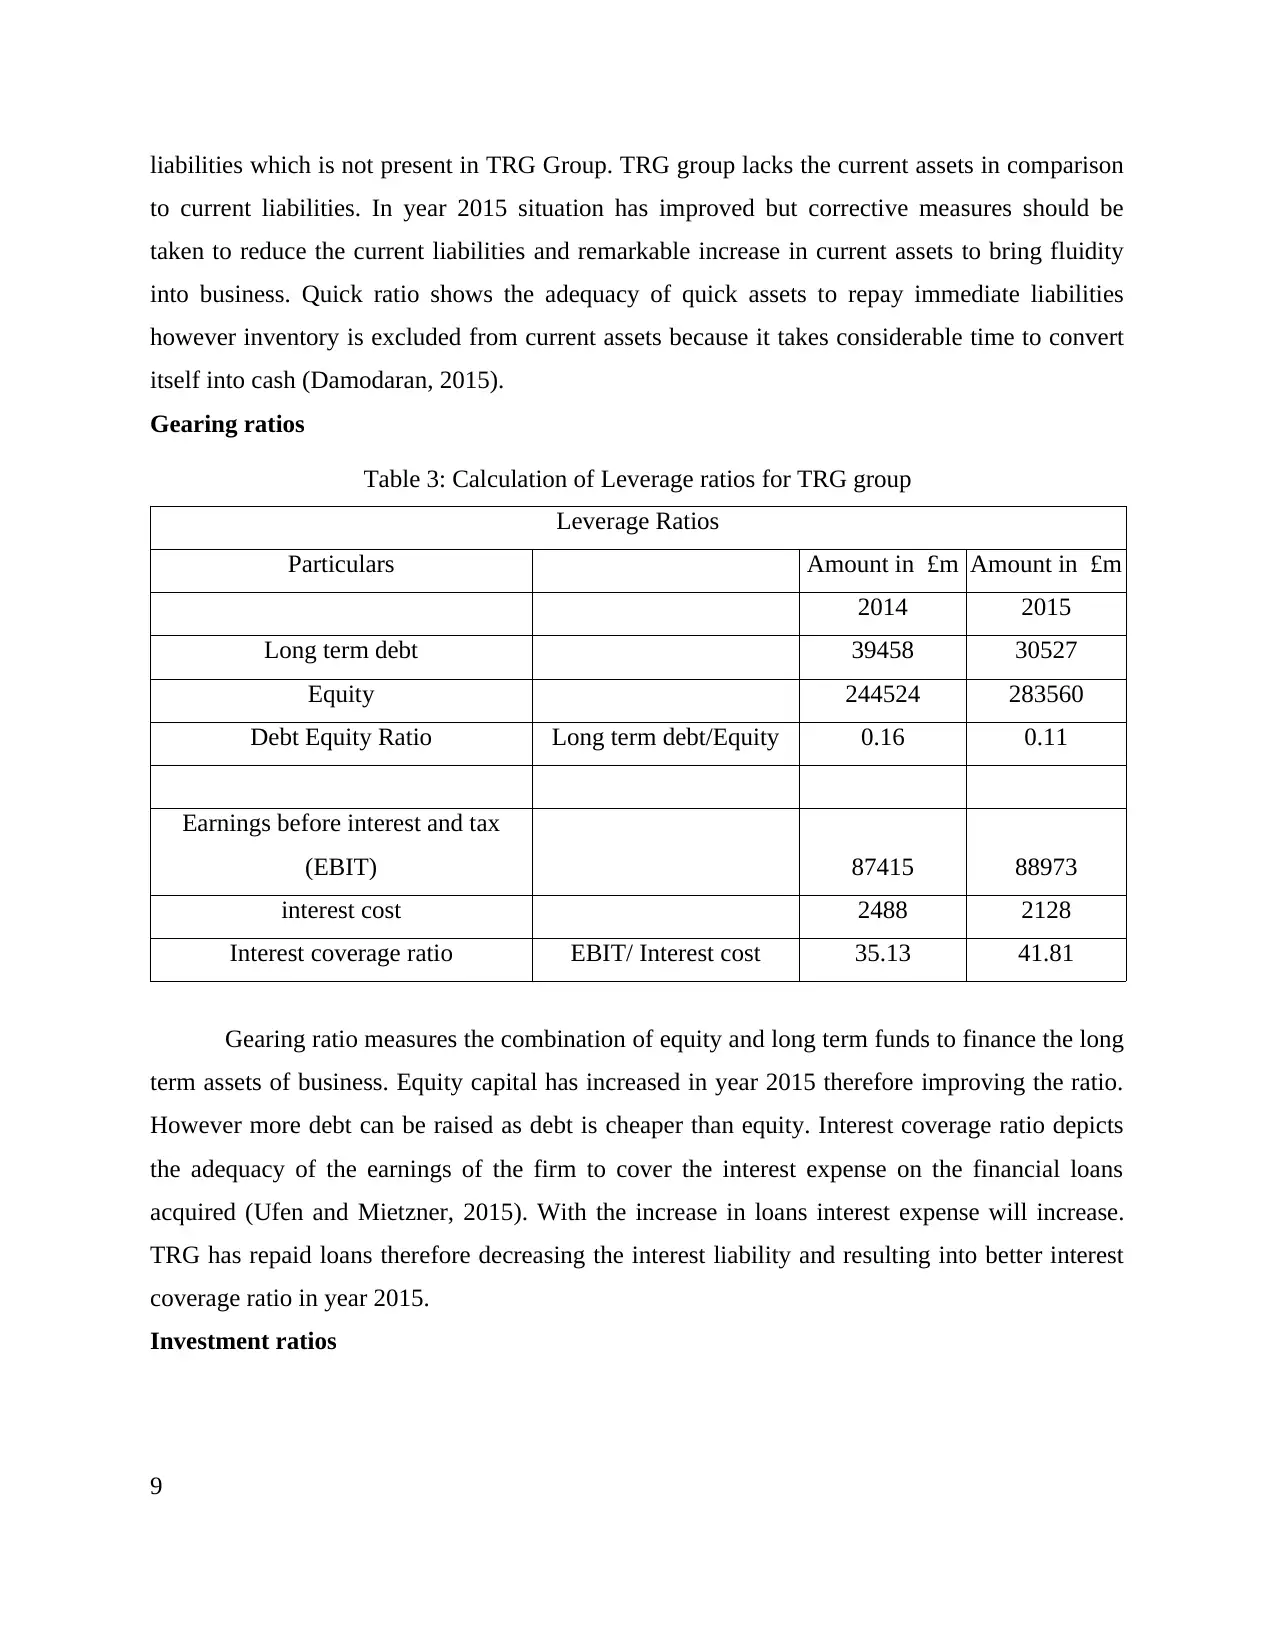
liabilities which is not present in TRG Group. TRG group lacks the current assets in comparison
to current liabilities. In year 2015 situation has improved but corrective measures should be
taken to reduce the current liabilities and remarkable increase in current assets to bring fluidity
into business. Quick ratio shows the adequacy of quick assets to repay immediate liabilities
however inventory is excluded from current assets because it takes considerable time to convert
itself into cash (Damodaran, 2015).
Gearing ratios
Table 3: Calculation of Leverage ratios for TRG group
Leverage Ratios
Particulars Amount in £m Amount in £m
2014 2015
Long term debt 39458 30527
Equity 244524 283560
Debt Equity Ratio Long term debt/Equity 0.16 0.11
Earnings before interest and tax
(EBIT) 87415 88973
interest cost 2488 2128
Interest coverage ratio EBIT/ Interest cost 35.13 41.81
Gearing ratio measures the combination of equity and long term funds to finance the long
term assets of business. Equity capital has increased in year 2015 therefore improving the ratio.
However more debt can be raised as debt is cheaper than equity. Interest coverage ratio depicts
the adequacy of the earnings of the firm to cover the interest expense on the financial loans
acquired (Ufen and Mietzner, 2015). With the increase in loans interest expense will increase.
TRG has repaid loans therefore decreasing the interest liability and resulting into better interest
coverage ratio in year 2015.
Investment ratios
9
⊘ This is a preview!⊘
Do you want full access?
Subscribe today to unlock all pages.
Trusted by 1+ million students worldwide
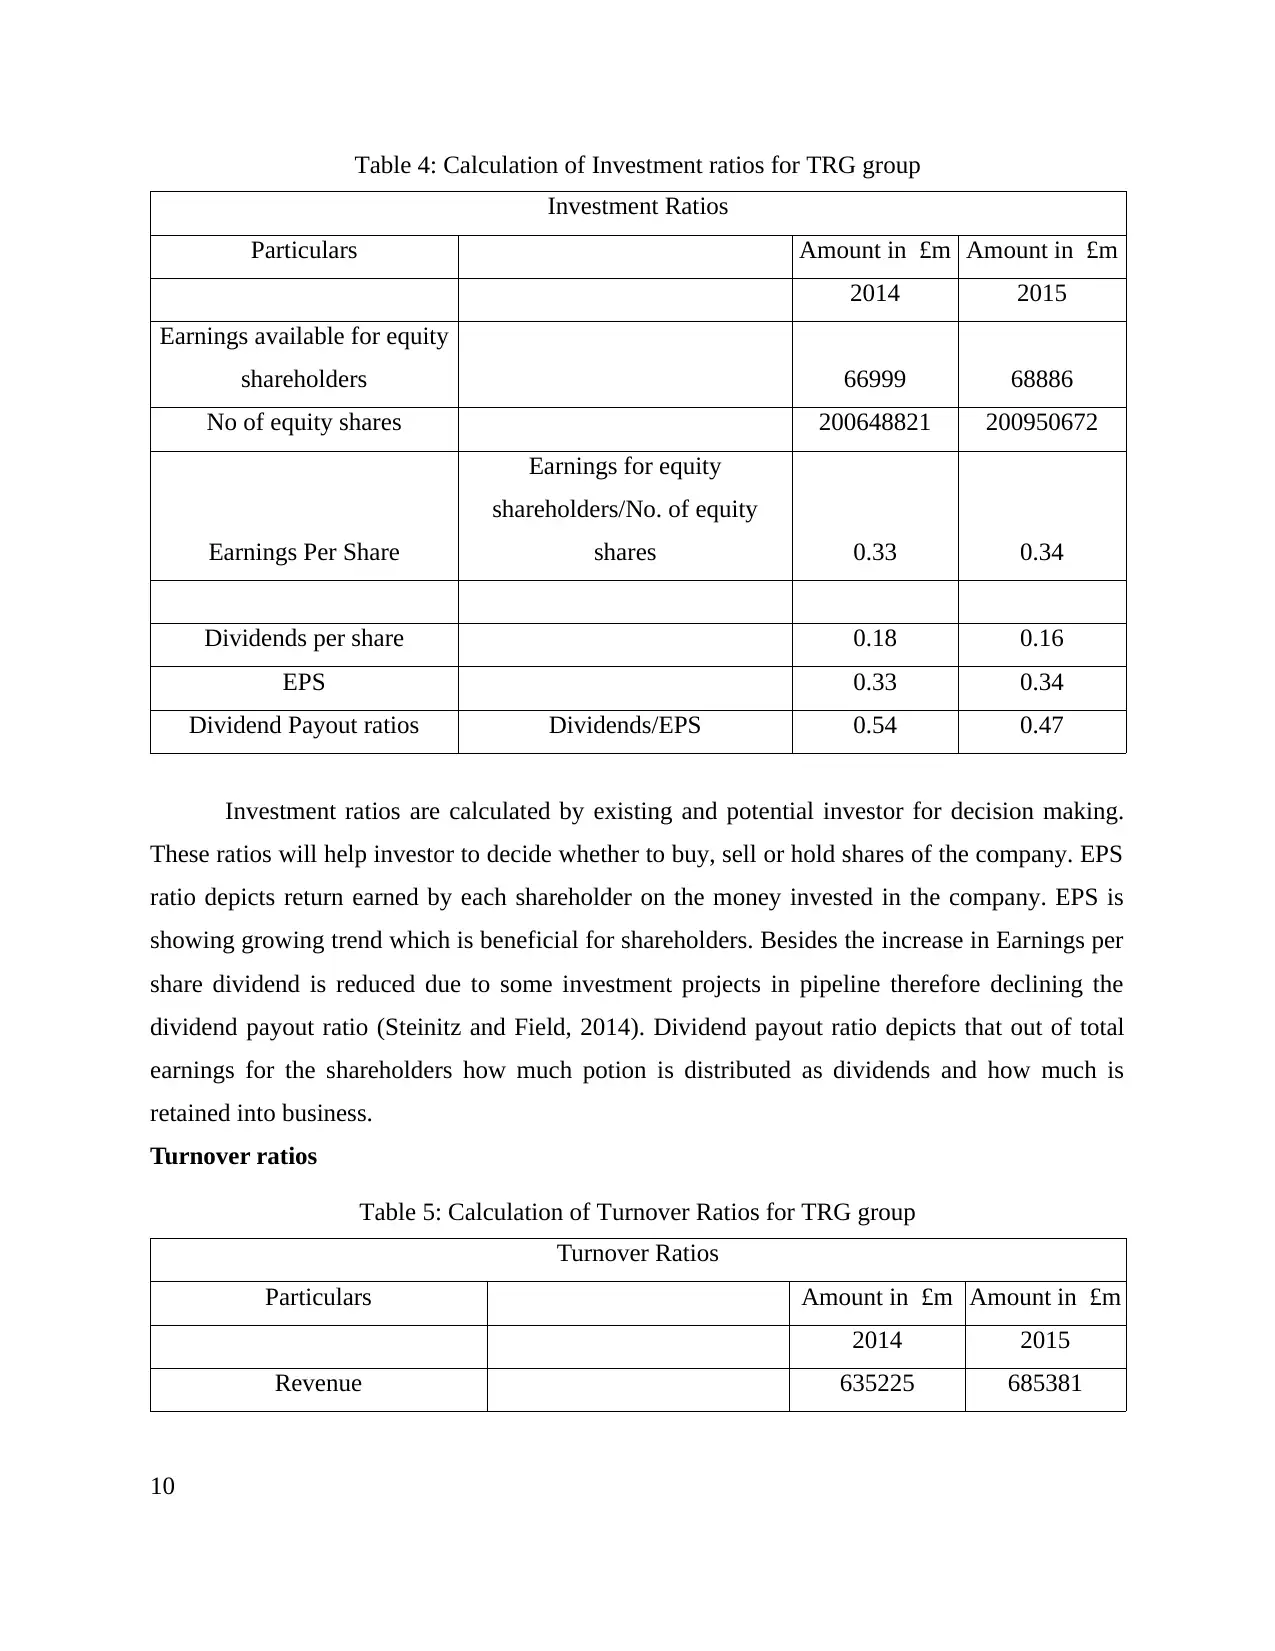
Table 4: Calculation of Investment ratios for TRG group
Investment Ratios
Particulars Amount in £m Amount in £m
2014 2015
Earnings available for equity
shareholders 66999 68886
No of equity shares 200648821 200950672
Earnings Per Share
Earnings for equity
shareholders/No. of equity
shares 0.33 0.34
Dividends per share 0.18 0.16
EPS 0.33 0.34
Dividend Payout ratios Dividends/EPS 0.54 0.47
Investment ratios are calculated by existing and potential investor for decision making.
These ratios will help investor to decide whether to buy, sell or hold shares of the company. EPS
ratio depicts return earned by each shareholder on the money invested in the company. EPS is
showing growing trend which is beneficial for shareholders. Besides the increase in Earnings per
share dividend is reduced due to some investment projects in pipeline therefore declining the
dividend payout ratio (Steinitz and Field, 2014). Dividend payout ratio depicts that out of total
earnings for the shareholders how much potion is distributed as dividends and how much is
retained into business.
Turnover ratios
Table 5: Calculation of Turnover Ratios for TRG group
Turnover Ratios
Particulars Amount in £m Amount in £m
2014 2015
Revenue 635225 685381
10
Paraphrase This Document
Need a fresh take? Get an instant paraphrase of this document with our AI Paraphraser
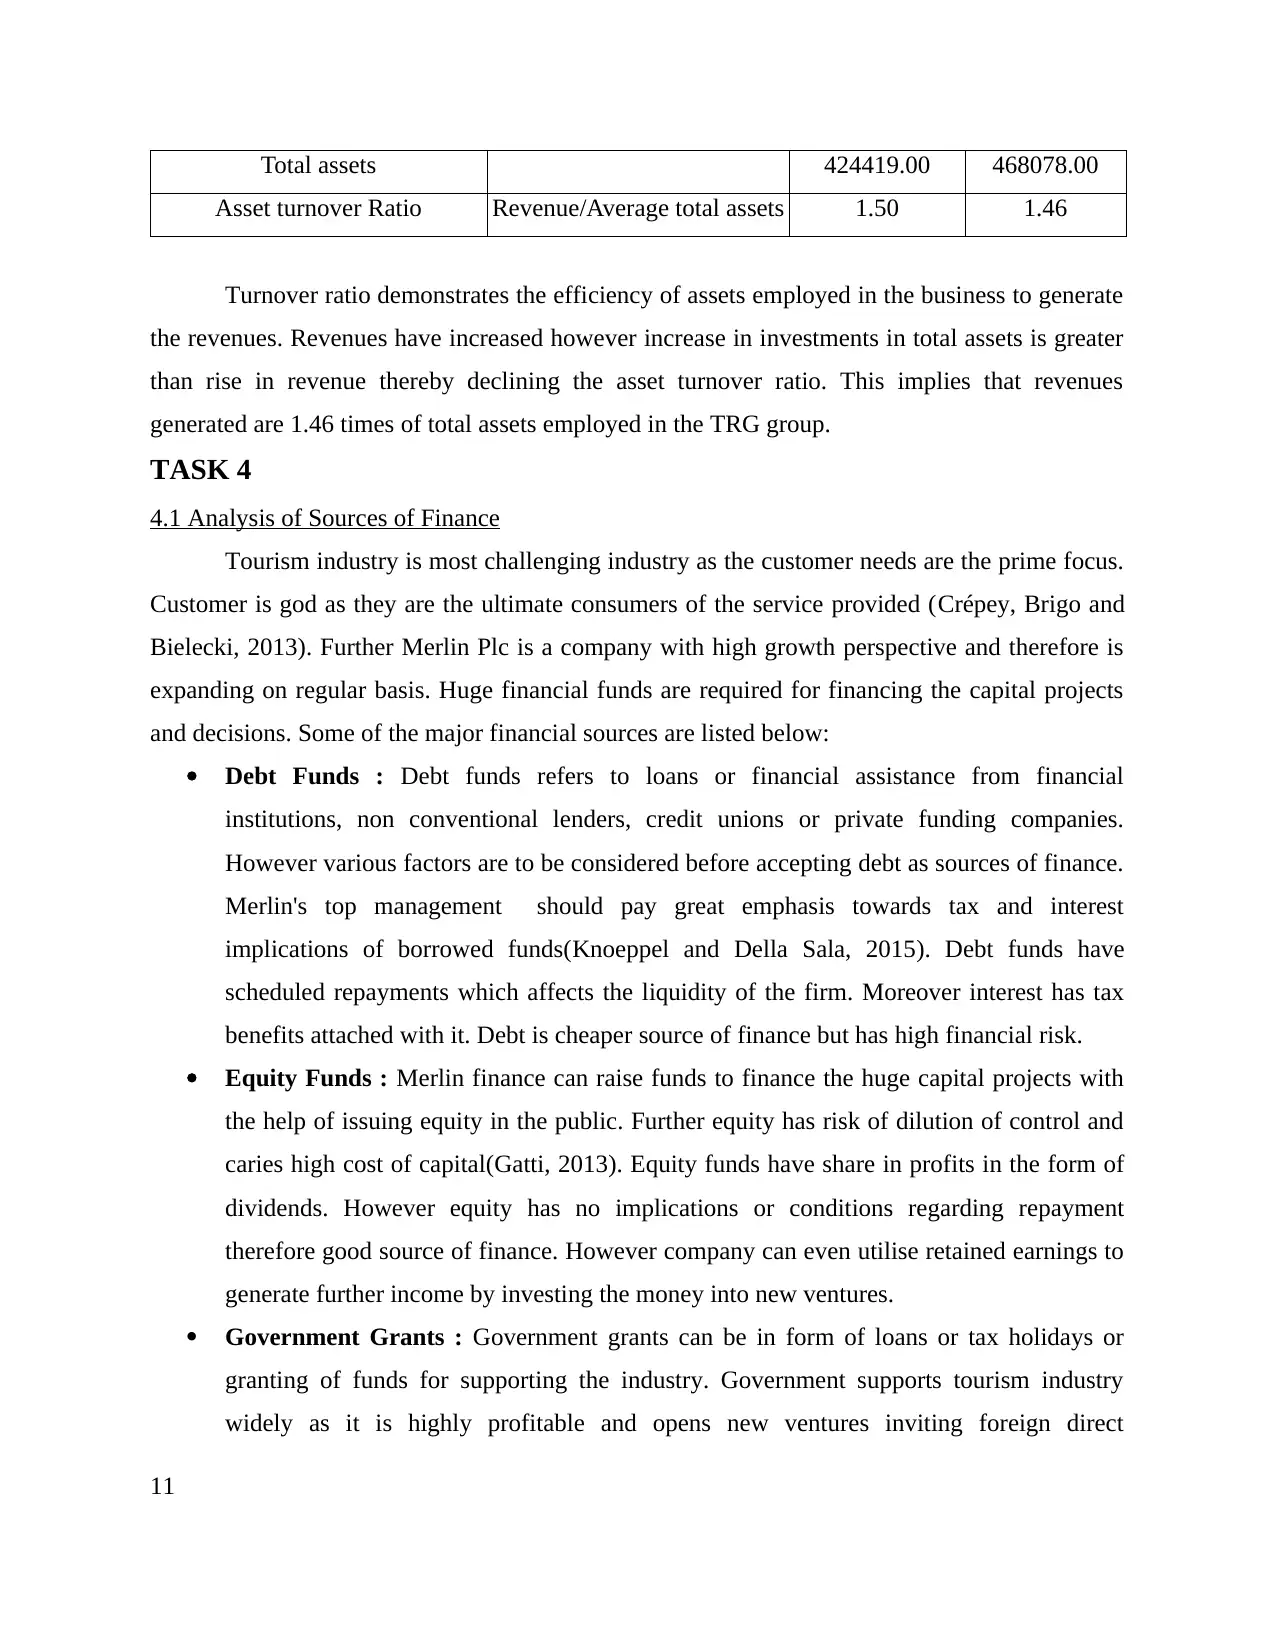
Total assets 424419.00 468078.00
Asset turnover Ratio Revenue/Average total assets 1.50 1.46
Turnover ratio demonstrates the efficiency of assets employed in the business to generate
the revenues. Revenues have increased however increase in investments in total assets is greater
than rise in revenue thereby declining the asset turnover ratio. This implies that revenues
generated are 1.46 times of total assets employed in the TRG group.
TASK 4
4.1 Analysis of Sources of Finance
Tourism industry is most challenging industry as the customer needs are the prime focus.
Customer is god as they are the ultimate consumers of the service provided (Crépey, Brigo and
Bielecki, 2013). Further Merlin Plc is a company with high growth perspective and therefore is
expanding on regular basis. Huge financial funds are required for financing the capital projects
and decisions. Some of the major financial sources are listed below:
Debt Funds : Debt funds refers to loans or financial assistance from financial
institutions, non conventional lenders, credit unions or private funding companies.
However various factors are to be considered before accepting debt as sources of finance.
Merlin's top management should pay great emphasis towards tax and interest
implications of borrowed funds(Knoeppel and Della Sala, 2015). Debt funds have
scheduled repayments which affects the liquidity of the firm. Moreover interest has tax
benefits attached with it. Debt is cheaper source of finance but has high financial risk.
Equity Funds : Merlin finance can raise funds to finance the huge capital projects with
the help of issuing equity in the public. Further equity has risk of dilution of control and
caries high cost of capital(Gatti, 2013). Equity funds have share in profits in the form of
dividends. However equity has no implications or conditions regarding repayment
therefore good source of finance. However company can even utilise retained earnings to
generate further income by investing the money into new ventures.
Government Grants : Government grants can be in form of loans or tax holidays or
granting of funds for supporting the industry. Government supports tourism industry
widely as it is highly profitable and opens new ventures inviting foreign direct
11
investments. However most of the government programs have entry and exit dates and
regulations attached which needs to be followed strictly. To enjoy the government grants
Merlin Plc should apply and present the exact and clear picture of the company and put
great efforts to gain the advantage under government schemes (Binks and Ennew, 2016).
CONCLUSION
As per the detailed analysis of Tourism industry under financial microscope it can be
concluded that CVP plays major role in setting the prices and controlling the cost. Further it can
be inferred from the report that management information tools present in the company provide
major assistance to Merlin Plc in finalising various decision regarding expansion and future
growth. Moreover debt can be treated as cheaper source of funds for funding thee expansion
project . However affecting the liquidity in business. Moreover financial performance of leading
restaurant group in UK is appreciable, despite the liquidity crunch faced by it although it is
growing in terms of magnitude in serving number of customers and profits.
12
⊘ This is a preview!⊘
Do you want full access?
Subscribe today to unlock all pages.
Trusted by 1+ million students worldwide
1 out of 13
Related Documents


Your All-in-One AI-Powered Toolkit for Academic Success.
+13062052269
info@desklib.com
Available 24*7 on WhatsApp / Email
![[object Object]](/_next/static/media/star-bottom.7253800d.svg)
Unlock your academic potential
Copyright © 2020–2026 A2Z Services. All Rights Reserved. Developed and managed by ZUCOL.