Project Report: Valuation Analysis of SamDee Inc. - Finance

Verified

Added on  2023/06/03

|7
|760
|199
Project
AI Summary
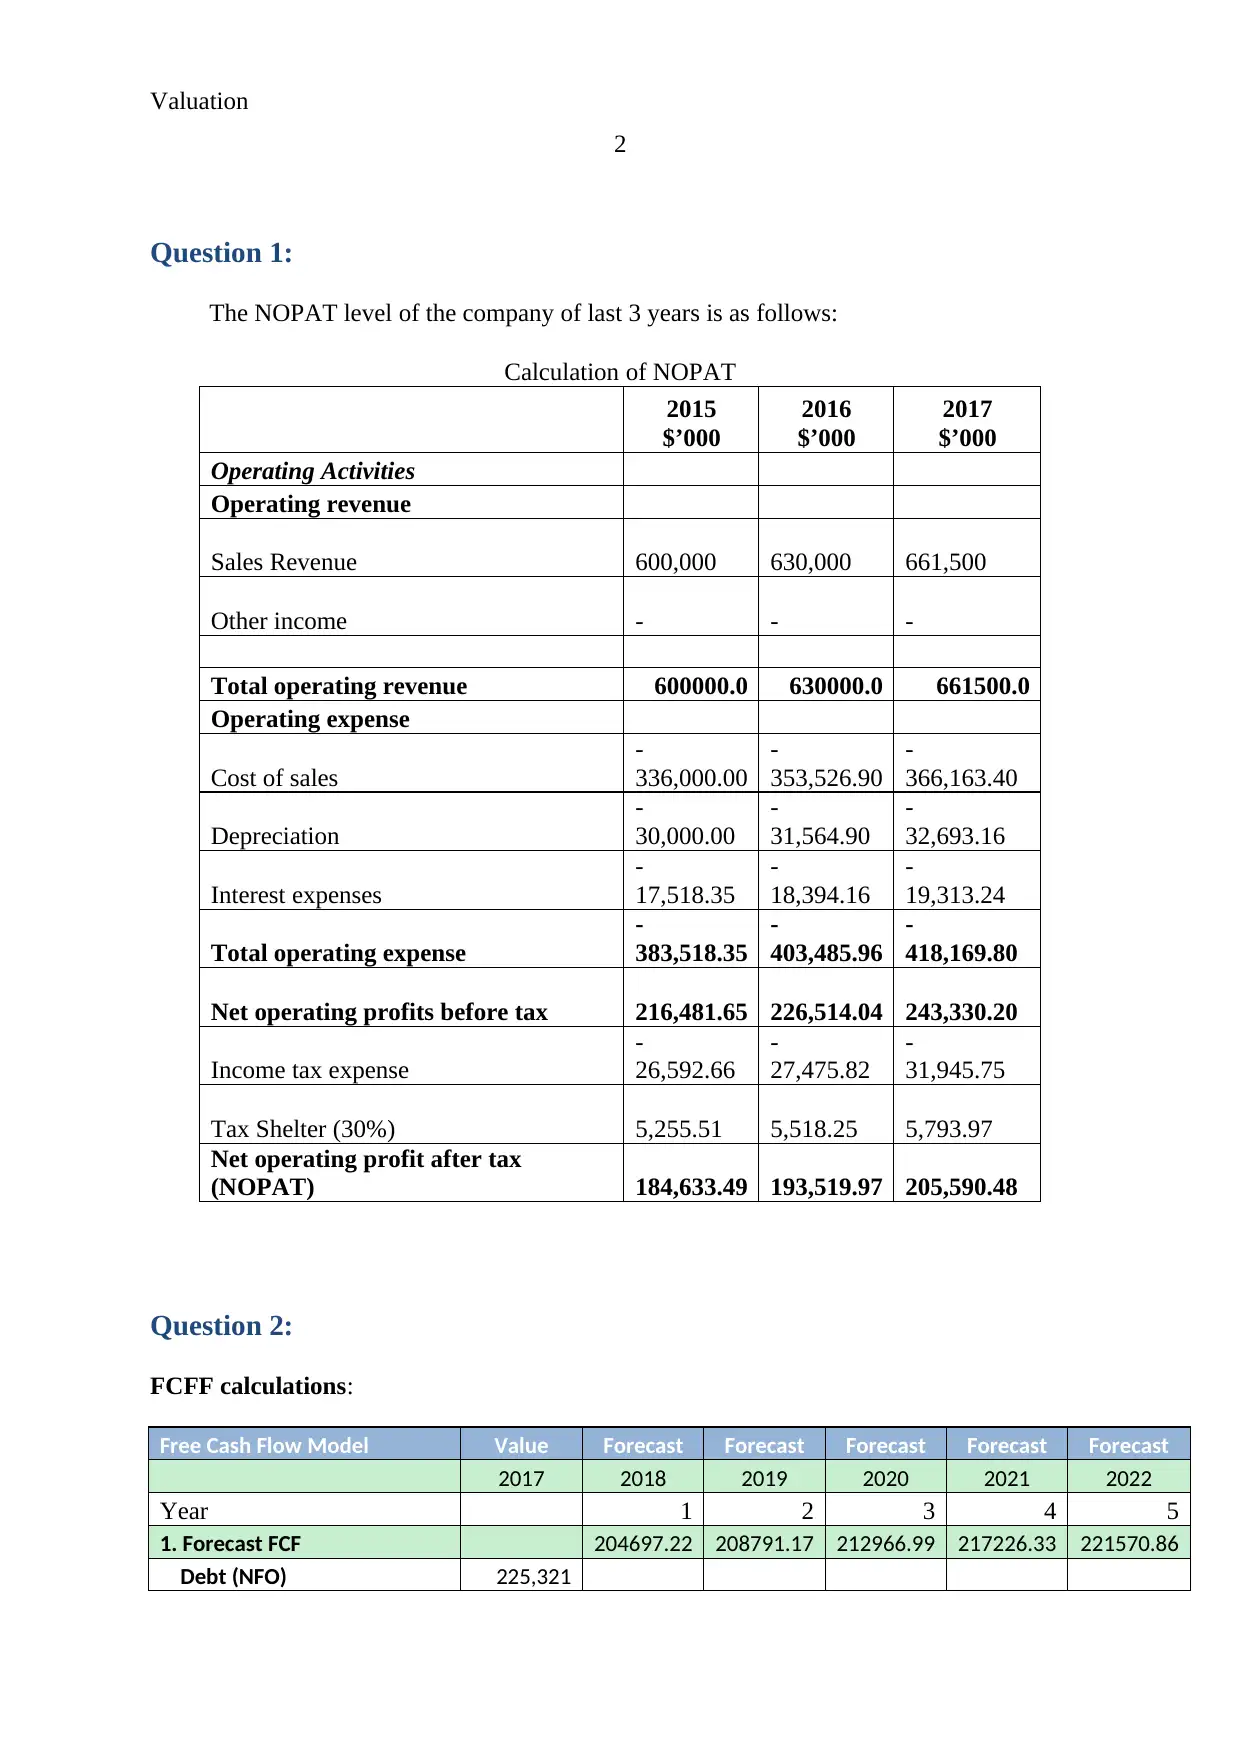
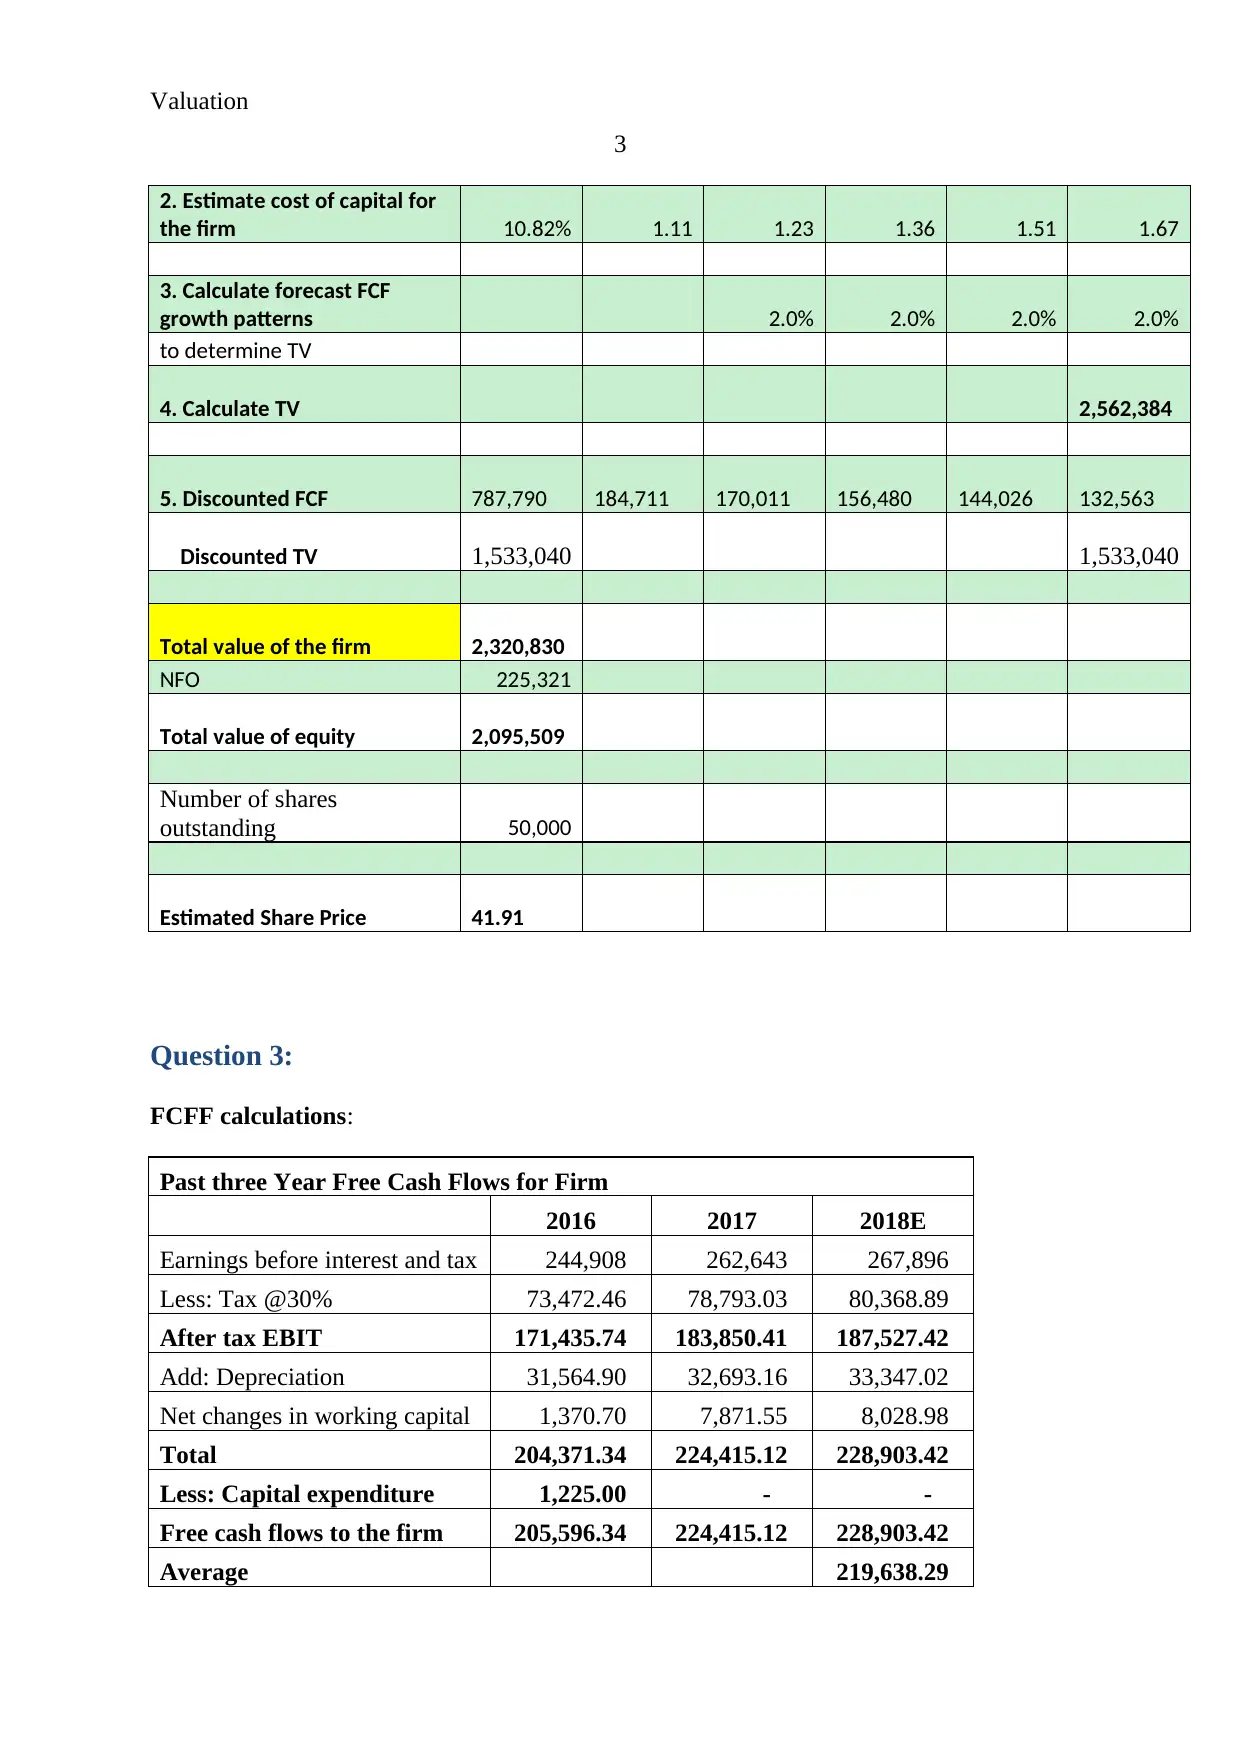
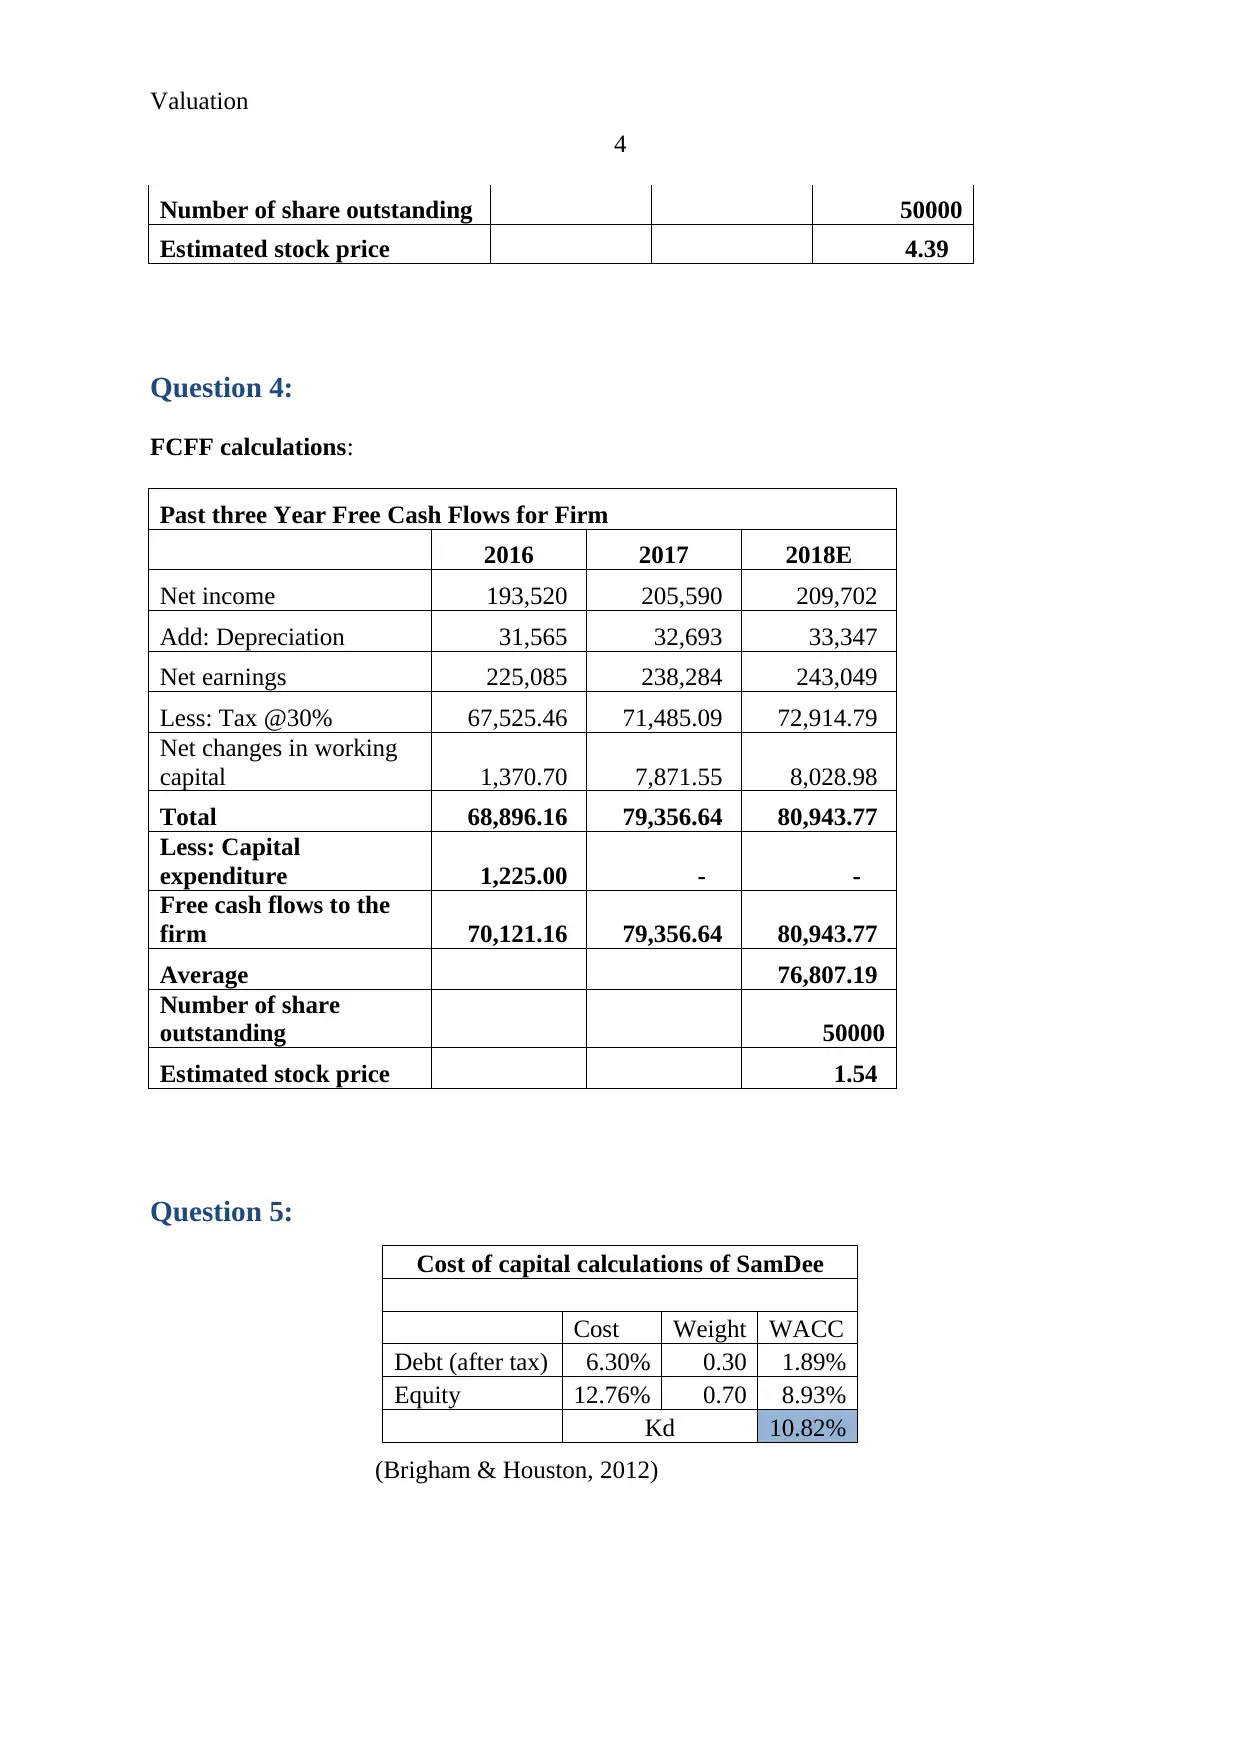
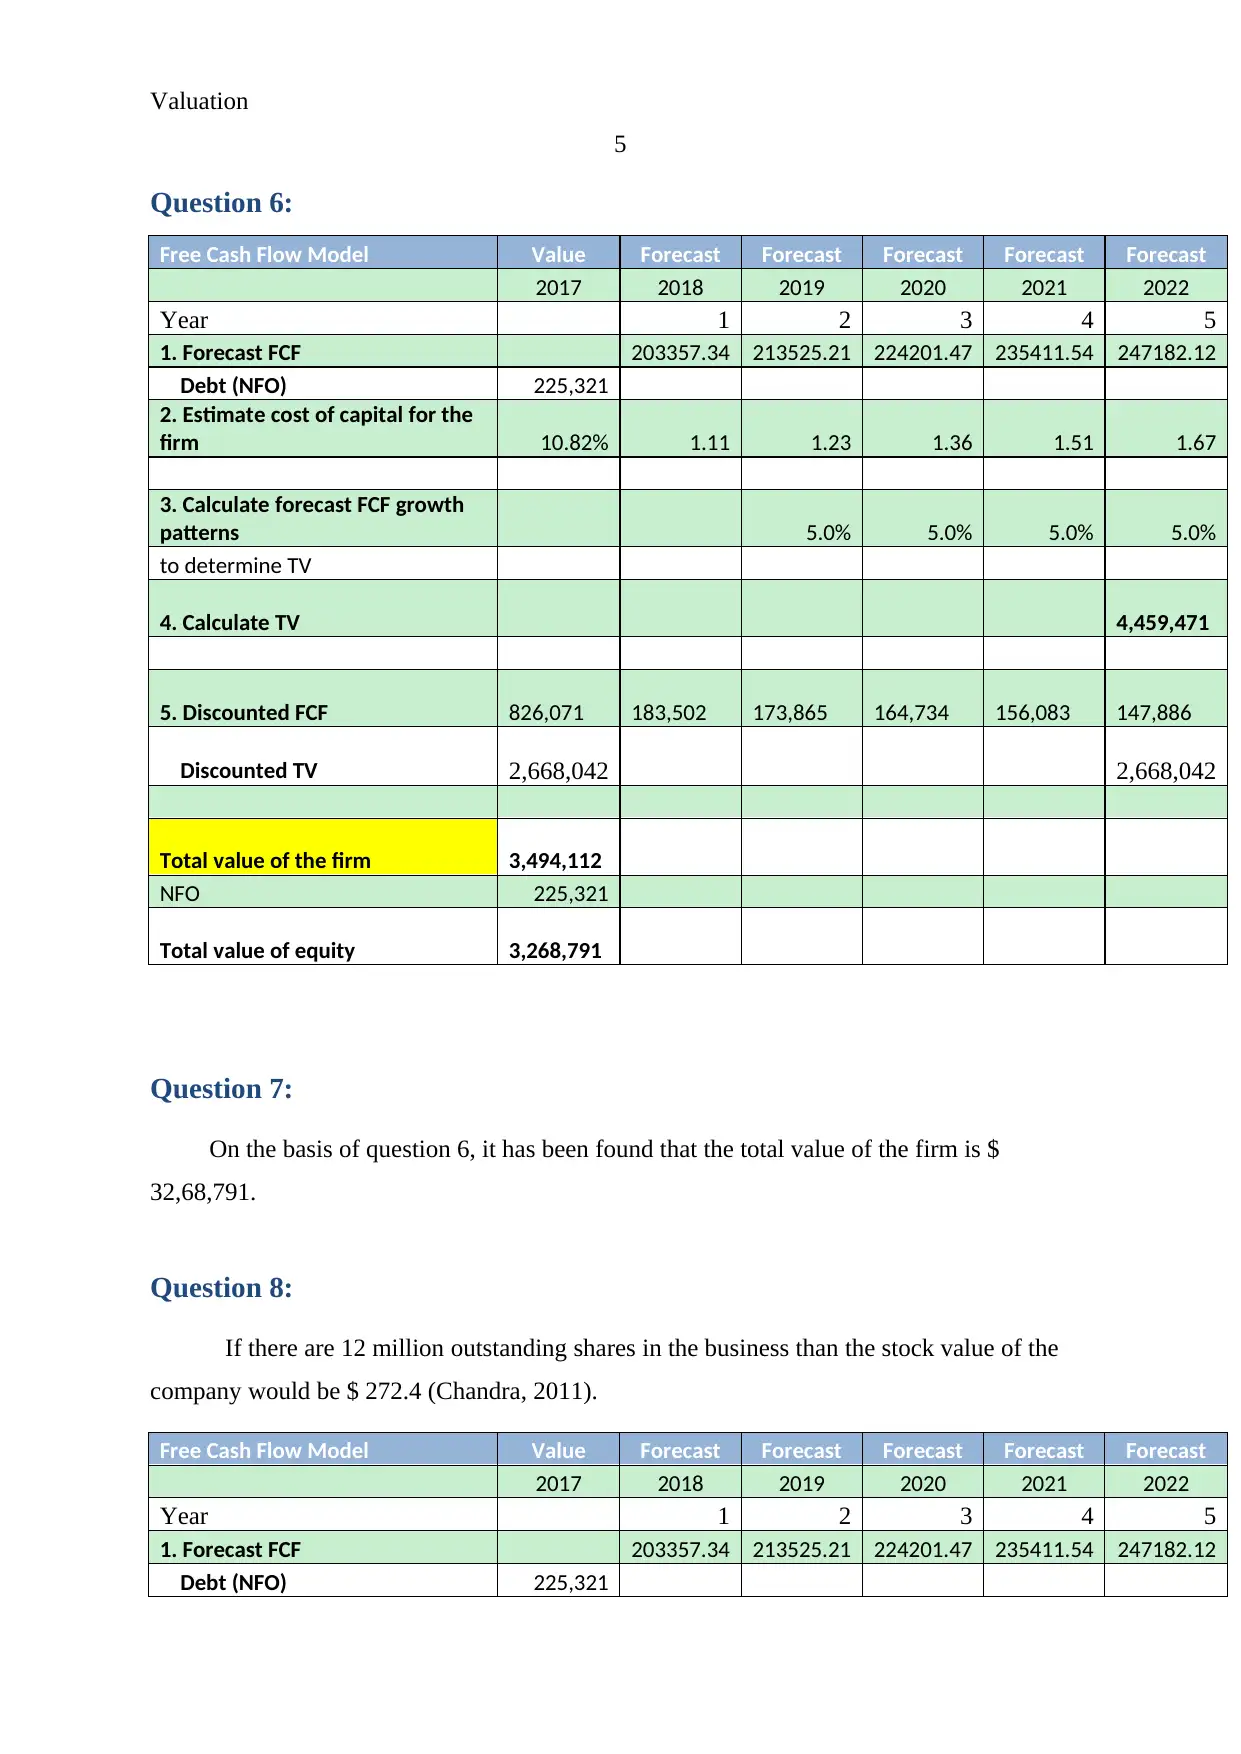
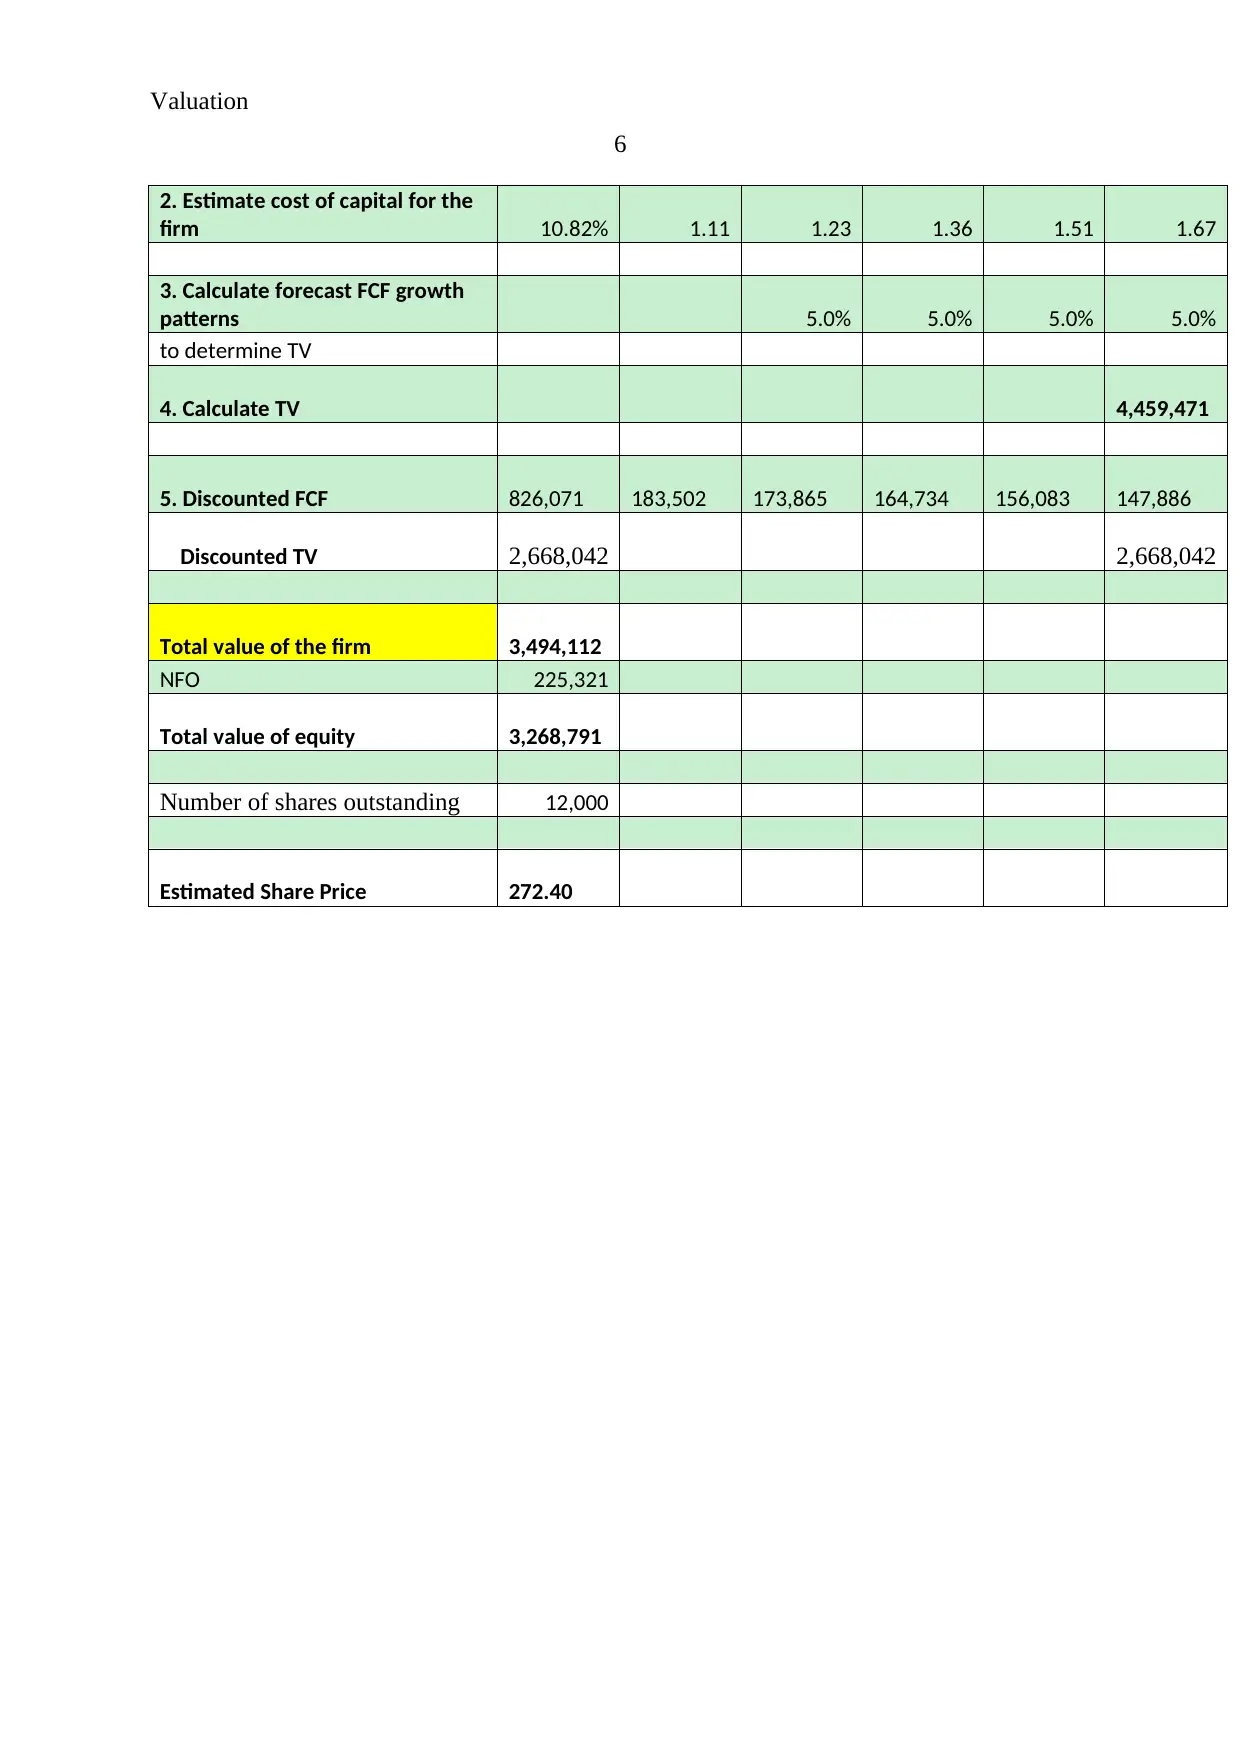
This project report presents a comprehensive valuation analysis of SamDee Inc., a large US entertainment firm. The report begins by calculating NOPAT for 2017 and proceeds to compute Free Cash Flow to the Firm (FCFF) using multiple methods, including the top-down and bottom-up approaches. It then estimates the cost of capital for SamDee Inc., considering the cost of equity and debt, and their respective weights in the capital structure. Further, the project uses the FCFF model to determine the total enterprise value, assuming a constant growth rate of 5%. Finally, the report calculates the equity value per share, given the number of outstanding shares, providing a complete valuation of the company's financial performance and market value. The report references key financial management concepts and includes relevant calculations to support the findings.
Document Page
Running Head: Valuation
1
Project Report: Valuation
tabler-icon-diamond-filled.svg

Paraphrase This Document

Need a fresh take? Get an instant paraphrase of this document with our AI Paraphraser
Document Page
Valuation
2
Question 1:
The NOPAT level of the company of last 3 years is as follows:
Calculation of NOPAT
2015
$’000
2016
$’000
2017
$’000
Operating Activities
Operating revenue
Sales Revenue 600,000 630,000 661,500
Other income - - -
Total operating revenue 600000.0 630000.0 661500.0
Operating expense
Cost of sales
-
336,000.00
-
353,526.90
-
366,163.40
Depreciation
-
30,000.00
-
31,564.90
-
32,693.16
Interest expenses
-
17,518.35
-
18,394.16
-
19,313.24
Total operating expense
-
383,518.35
-
403,485.96
-
418,169.80
Net operating profits before tax 216,481.65 226,514.04 243,330.20
Income tax expense
-
26,592.66
-
27,475.82
-
31,945.75
Tax Shelter (30%) 5,255.51 5,518.25 5,793.97
Net operating profit after tax
(NOPAT) 184,633.49 193,519.97 205,590.48
Question 2:
FCFF calculations:
Free Cash Flow Model Value Forecast Forecast Forecast Forecast Forecast
2017 2018 2019 2020 2021 2022
Year 1 2 3 4 5
1. Forecast FCF 204697.22 208791.17 212966.99 217226.33 221570.86
Debt (NFO) 225,321
Document Page
Valuation
3
2. Estimate cost of capital for
the firm 10.82% 1.11 1.23 1.36 1.51 1.67
3. Calculate forecast FCF
growth patterns 2.0% 2.0% 2.0% 2.0%
to determine TV
4. Calculate TV 2,562,384
5. Discounted FCF 787,790 184,711 170,011 156,480 144,026 132,563
Discounted TV 1,533,040 1,533,040
Total value of the firm 2,320,830
NFO 225,321
Total value of equity 2,095,509
Number of shares
outstanding 50,000
Estimated Share Price 41.91
Question 3:
FCFF calculations:
Past three Year Free Cash Flows for Firm
2016 2017 2018E
Earnings before interest and tax 244,908 262,643 267,896
Less: Tax @30% 73,472.46 78,793.03 80,368.89
After tax EBIT 171,435.74 183,850.41 187,527.42
Add: Depreciation 31,564.90 32,693.16 33,347.02
Net changes in working capital 1,370.70 7,871.55 8,028.98
Total 204,371.34 224,415.12 228,903.42
Less: Capital expenditure 1,225.00 - -
Free cash flows to the firm 205,596.34 224,415.12 228,903.42
Average 219,638.29
Document Page
Valuation
4
Number of share outstanding 50000
Estimated stock price 4.39
Question 4:
FCFF calculations:
Past three Year Free Cash Flows for Firm
2016 2017 2018E
Net income 193,520 205,590 209,702
Add: Depreciation 31,565 32,693 33,347
Net earnings 225,085 238,284 243,049
Less: Tax @30% 67,525.46 71,485.09 72,914.79
Net changes in working
capital 1,370.70 7,871.55 8,028.98
Total 68,896.16 79,356.64 80,943.77
Less: Capital
expenditure 1,225.00 - -
Free cash flows to the
firm 70,121.16 79,356.64 80,943.77
Average 76,807.19
Number of share
outstanding 50000
Estimated stock price 1.54
Question 5:
Cost of capital calculations of SamDee
Cost Weight WACC
Debt (after tax) 6.30% 0.30 1.89%
Equity 12.76% 0.70 8.93%
Kd 10.82%
(Brigham & Houston, 2012)
tabler-icon-diamond-filled.svg

Paraphrase This Document

Need a fresh take? Get an instant paraphrase of this document with our AI Paraphraser
Document Page
Valuation
5
Question 6:
Free Cash Flow Model Value Forecast Forecast Forecast Forecast Forecast
2017 2018 2019 2020 2021 2022
Year 1 2 3 4 5
1. Forecast FCF 203357.34 213525.21 224201.47 235411.54 247182.12
Debt (NFO) 225,321
2. Estimate cost of capital for the
firm 10.82% 1.11 1.23 1.36 1.51 1.67
3. Calculate forecast FCF growth
patterns 5.0% 5.0% 5.0% 5.0%
to determine TV
4. Calculate TV 4,459,471
5. Discounted FCF 826,071 183,502 173,865 164,734 156,083 147,886
Discounted TV 2,668,042 2,668,042
Total value of the firm 3,494,112
NFO 225,321
Total value of equity 3,268,791
Question 7:
On the basis of question 6, it has been found that the total value of the firm is $
32,68,791.
Question 8:
If there are 12 million outstanding shares in the business than the stock value of the
company would be $ 272.4 (Chandra, 2011).
Free Cash Flow Model Value Forecast Forecast Forecast Forecast Forecast
2017 2018 2019 2020 2021 2022
Year 1 2 3 4 5
1. Forecast FCF 203357.34 213525.21 224201.47 235411.54 247182.12
Debt (NFO) 225,321
Document Page
Valuation
6
2. Estimate cost of capital for the
firm 10.82% 1.11 1.23 1.36 1.51 1.67
3. Calculate forecast FCF growth
patterns 5.0% 5.0% 5.0% 5.0%
to determine TV
4. Calculate TV 4,459,471
5. Discounted FCF 826,071 183,502 173,865 164,734 156,083 147,886
Discounted TV 2,668,042 2,668,042
Total value of the firm 3,494,112
NFO 225,321
Total value of equity 3,268,791
Number of shares outstanding 12,000
Estimated Share Price 272.40
Document Page
Valuation
7
References:
Brigham, E. F., & Houston, J. F. (2012). Fundamentals of financial management. Cengage
Learning.
Chandra, P. (2011). Financial management. Tata McGraw-Hill Education.
chevron_up_icon
1 out of 7
circle_padding
hide_on_mobile
zoom_out_icon
[object Object]