HI5002 Finance: A2 Milk Company Performance Analysis Report
VerifiedAdded on 2022/11/16
|14
|4271
|219
Report
AI Summary
This report provides a comprehensive financial analysis of the A2 Milk Company Limited, an ASX-listed company. The analysis includes an overview of the company's operations, followed by a detailed examination of its financial performance using profitability and operating efficiency ratios from 2016 to 2018. The report evaluates gross margin, net margin, and return on capital employed (ROCE) to assess profitability. It also assesses operating efficiency through inventory turnover, receivables turnover, payables turnover, and cash conversion cycle. Furthermore, the report analyzes cash management, examining marketable securities, and conducts a sensitivity analysis to assess the impact of potential changes on project viability. The systemic and un-systemic risks are discussed, along with the company's dividend policy. Finally, the report provides recommendations to investors regarding investment in the A2 Milk Company Limited.
Running head: COMPANY PERFORMANCE ANALYSIS
Company Performance Analysis
Name of the Student:
Name of the University:
Author’s Note:
Course ID:
Company Performance Analysis
Name of the Student:
Name of the University:
Author’s Note:
Course ID:
Paraphrase This Document
Need a fresh take? Get an instant paraphrase of this document with our AI Paraphraser
1COMPANY PERFORMANCE ANALYSIS
Abstract:
The evaluation of the financial performance of the organisations is deemed to be a vital
tool for gauging the existing financial performance along with gaining an overview about
their future performance. It has been evaluated that the A2 Milk Company Limited is
operating in the Australian milk and dairy industry. It has been found that the
organisation has maintained both stable profitability and operating efficiency positions.
Moreover, the proposed project is observed to provide significant benefits to the
organisation in future. However, it has been analysed that the organisation follows zero
dividend policy and hence, it does not provide any return to its shareholders over the
year. Since majority of the financial aspects are found to be positive, it is recommended
to the investor to invest in the shares of the A2 Milk Company Limited for earning better
returns in future.
2COMPANY PERFORMANCE ANALYSIS
Table of Contents
I. Introduction:................................................................................................................3
II. Financial analysis of the A2 Milk Company Limited:.................................................3
2.1 Company description:..............................................................................................3
2.2 Computation and evaluation of performance ratios:................................................3
2.3 Cash management analysis:....................................................................................6
2.4 Sensitivity analysis:..................................................................................................7
2.5 Systemic and un-systemic risks:............................................................................10
2.6 Dividend payout ratio and dividend policy:............................................................10
III. Recommendation letter:.............................................................................................11
IV. Conclusion:.................................................................................................................11
References:......................................................................................................................12
⊘ This is a preview!⊘
Do you want full access?
Subscribe today to unlock all pages.
Trusted by 1+ million students worldwide
3COMPANY PERFORMANCE ANALYSIS
I. Introduction:
The evaluation of the financial performance of the organisations is deemed to be
a vital tool for gauging the existing financial performance along with gaining an overview
about their future performance (Alhabeeb 2014). Due to the same reason, the
investment professionals take into account the analysis of the financial performance of
the organisations as a vital part of the decision-making process related to investment.
There are various tools and methods used for meeting this purpose that include ratio
analysis of the chosen organisation, analysis of its risks, marketable securities and
others. The report intends to provide an in-depth overview of the financial performance
of an organisation listed in ASX in order to undertake investment decision. The
organisation chosen for this purpose is the A2 Milk Company Limited, which is a New
Zealand-based organisation dealing with milk-related products in the global market (The
a2 Milk Company 2019).
The entire report is segregated into different sections. The initial section would
provide a brief overview of the chosen organisation. The second section would focus on
the computation and analysis of various efficiency and profitability ratios of the A2 Milk
Company Limited. The next section would emphasise on the cash management
analysis of the firm by detecting its marketable securities. After this, sensitivity analysis
would be performed in order to ascertain the viability of the project. The next objective is
to determine the systemic and un-systemic risks of the A2 Milk Company. In addition,
the dividend payout ratio as well as the dividend policy of the firm would be identified.
Finally, the report would shed light on providing recommendation to the investors
regarding whether to invest in the organisation or not.
II. Financial analysis of the A2 Milk Company Limited:
2.1 Company description:
The A2 Milk Company Limited is an ASX 200 listed organisation engaging in the
commercialisation of intellectual property associated with A1 protein-free milk, which it
sells under the A2 milk brands as well as other milk-related products. Currently, the
head office of the organisation is in Sydney, Australia and it has been established in
2000. It operates in the dairy sector of Australia and it is one of the pioneers in the
entire sector (The a2 Milk Company 2019). The A2 Milk Company Limited has a
predecessor, which was A2 Corporation Limited. This is because A2 Corporation
Limited has sold its interest to A2 Australia, which is deemed to be the commencement
of operations of the A2 Milk Company Limited. However, since the organisation is a part
of the dairy and milk sector in Australia, it has to encounter significant competition and
some of its main rivals include Bega Cheese, Freedom Foods Group, Bellamy’s
Australia, Inghams Group and Freedom Foods Group.
2.2 Computation and evaluation of performance ratios:
The evaluation of operating efficiency and profitability is adjudged as the crucial
aspects in order to determine the existing financial health of the A2 Milk Company
Limited. The below discussion would represent the evaluation of various ratios under
operating efficiency and profitability of the concerned organisation:
Profitability evaluation:
The evaluation of the profitability ratios is made with the intent of determining the
capability of the organisation for income generation compared to all expenses needed
to be incurred for carrying out business activities (Atanasov and Black 2016). There are
Paraphrase This Document
Need a fresh take? Get an instant paraphrase of this document with our AI Paraphraser
4COMPANY PERFORMANCE ANALYSIS
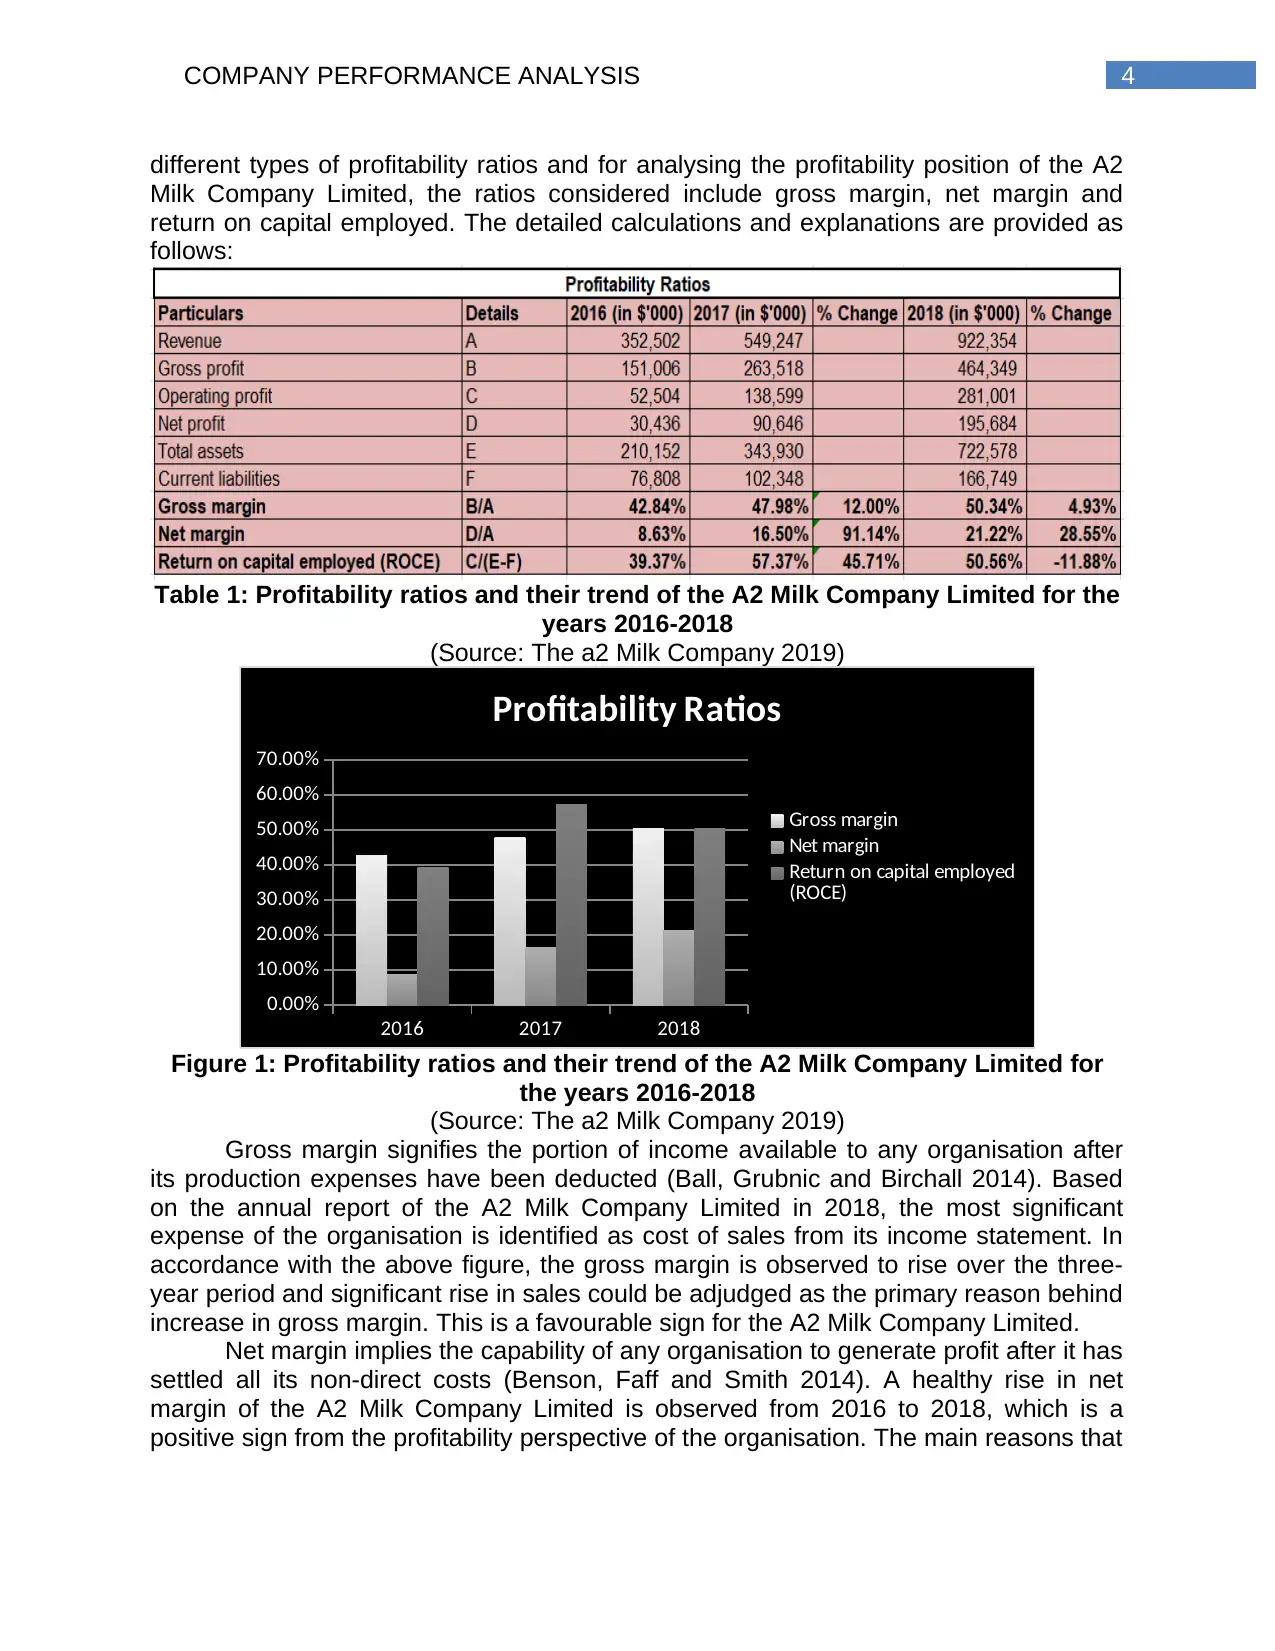
different types of profitability ratios and for analysing the profitability position of the A2
Milk Company Limited, the ratios considered include gross margin, net margin and
return on capital employed. The detailed calculations and explanations are provided as
follows:
Table 1: Profitability ratios and their trend of the A2 Milk Company Limited for the
years 2016-2018
(Source: The a2 Milk Company 2019)
2016 2017 2018
0.00%
10.00%
20.00%
30.00%
40.00%
50.00%
60.00%
70.00%
Profitability Ratios
Gross margin
Net margin
Return on capital employed
(ROCE)
Figure 1: Profitability ratios and their trend of the A2 Milk Company Limited for
the years 2016-2018
(Source: The a2 Milk Company 2019)
Gross margin signifies the portion of income available to any organisation after
its production expenses have been deducted (Ball, Grubnic and Birchall 2014). Based
on the annual report of the A2 Milk Company Limited in 2018, the most significant
expense of the organisation is identified as cost of sales from its income statement. In
accordance with the above figure, the gross margin is observed to rise over the three-
year period and significant rise in sales could be adjudged as the primary reason behind
increase in gross margin. This is a favourable sign for the A2 Milk Company Limited.
Net margin implies the capability of any organisation to generate profit after it has
settled all its non-direct costs (Benson, Faff and Smith 2014). A healthy rise in net
margin of the A2 Milk Company Limited is observed from 2016 to 2018, which is a
positive sign from the profitability perspective of the organisation. The main reasons that
5COMPANY PERFORMANCE ANALYSIS
attributed to rise in net margin include decline in marketing costs and rise in interest
income.
ROCE gauges the capability of a firm to earn profit from the deployed capital by
comparing operating income to the employed capital (Brewer and Stout 2014).
According to the above figure, there is healthy rise in ROCE from 2016 to 2017 due to
considerable rise in operating income. However, this ratio has decreased in 2018 owing
to considerable rise in the amount of current liabilities.
By considering the above analysis, it is necessary to mention that the profitability
position of the A2 Milk Company Limited is stable because it has witnessed
considerable increase in gross profit as well as net profit. However, emphasis needs to
be provided in order to improve ROCE in future, as it is one of the vital indicators of
business profitability.
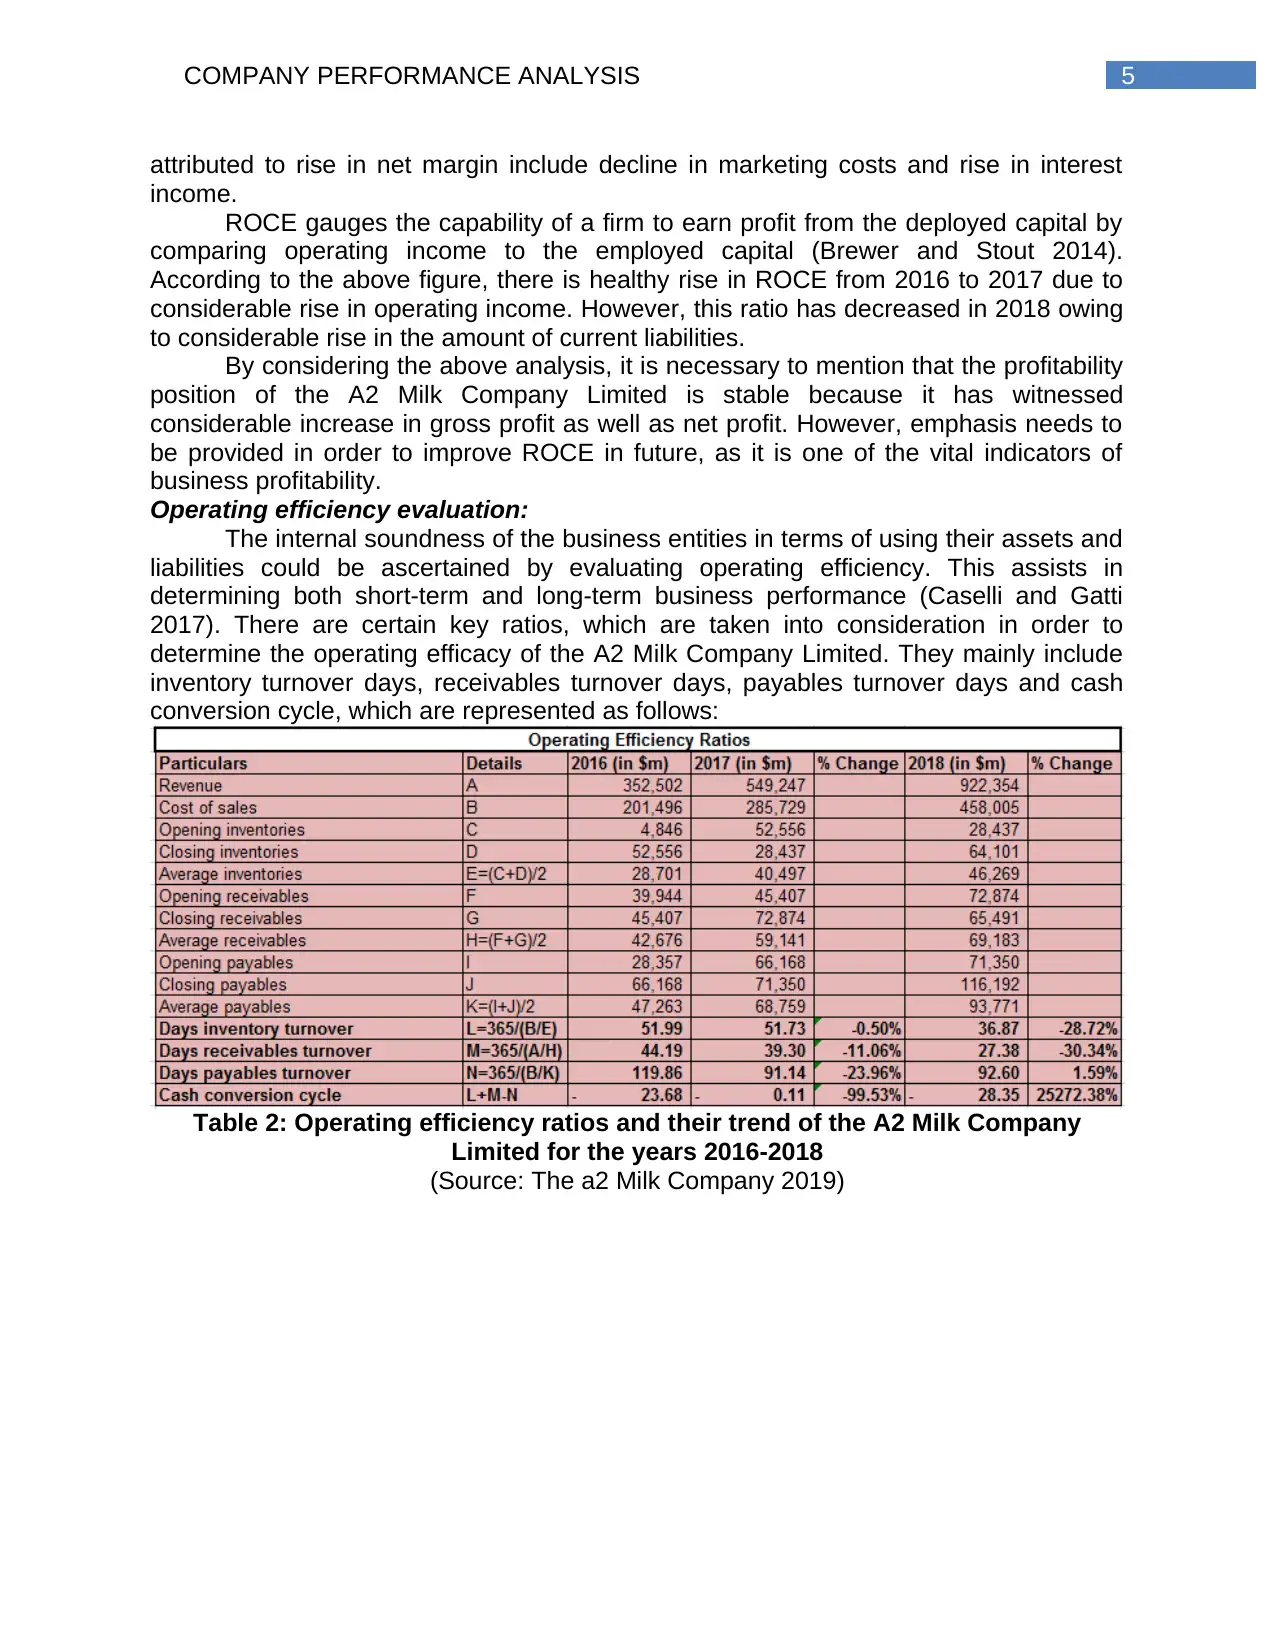
Operating efficiency evaluation:
The internal soundness of the business entities in terms of using their assets and
liabilities could be ascertained by evaluating operating efficiency. This assists in
determining both short-term and long-term business performance (Caselli and Gatti
2017). There are certain key ratios, which are taken into consideration in order to
determine the operating efficacy of the A2 Milk Company Limited. They mainly include
inventory turnover days, receivables turnover days, payables turnover days and cash
conversion cycle, which are represented as follows:
Table 2: Operating efficiency ratios and their trend of the A2 Milk Company
Limited for the years 2016-2018
(Source: The a2 Milk Company 2019)
attributed to rise in net margin include decline in marketing costs and rise in interest
income.
ROCE gauges the capability of a firm to earn profit from the deployed capital by
comparing operating income to the employed capital (Brewer and Stout 2014).
According to the above figure, there is healthy rise in ROCE from 2016 to 2017 due to
considerable rise in operating income. However, this ratio has decreased in 2018 owing
to considerable rise in the amount of current liabilities.
By considering the above analysis, it is necessary to mention that the profitability
position of the A2 Milk Company Limited is stable because it has witnessed
considerable increase in gross profit as well as net profit. However, emphasis needs to
be provided in order to improve ROCE in future, as it is one of the vital indicators of
business profitability.
Operating efficiency evaluation:
The internal soundness of the business entities in terms of using their assets and
liabilities could be ascertained by evaluating operating efficiency. This assists in
determining both short-term and long-term business performance (Caselli and Gatti
2017). There are certain key ratios, which are taken into consideration in order to
determine the operating efficacy of the A2 Milk Company Limited. They mainly include
inventory turnover days, receivables turnover days, payables turnover days and cash
conversion cycle, which are represented as follows:
Table 2: Operating efficiency ratios and their trend of the A2 Milk Company
Limited for the years 2016-2018
(Source: The a2 Milk Company 2019)
⊘ This is a preview!⊘
Do you want full access?
Subscribe today to unlock all pages.
Trusted by 1+ million students worldwide
6COMPANY PERFORMANCE ANALYSIS
Days inventory
turnover Days receivables
turnover Days payables
turnover Cash conversion
cycle
-40.00
-20.00
-
20.00
40.00
60.00
80.00
100.00
120.00
140.00
Operating Efficiency Ratios
2016
2017
2018
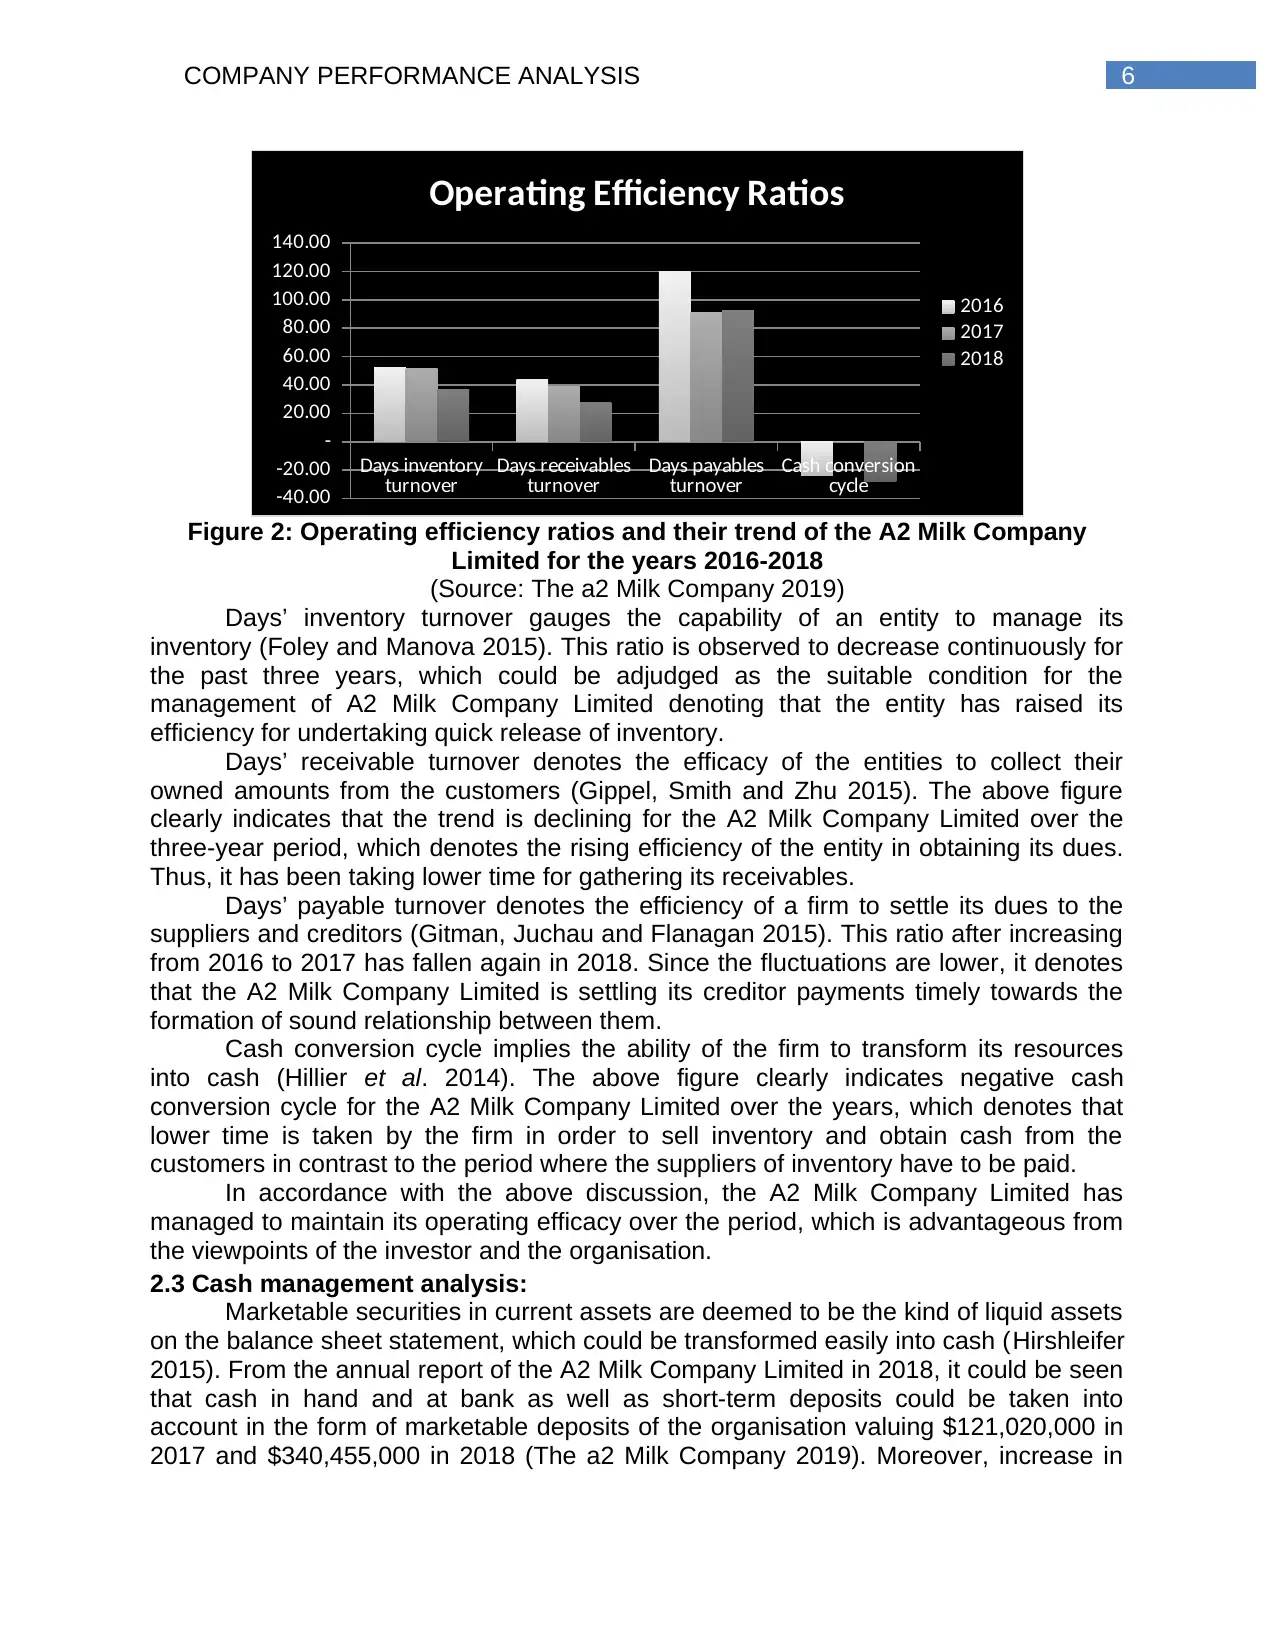
Figure 2: Operating efficiency ratios and their trend of the A2 Milk Company
Limited for the years 2016-2018
(Source: The a2 Milk Company 2019)
Days’ inventory turnover gauges the capability of an entity to manage its
inventory (Foley and Manova 2015). This ratio is observed to decrease continuously for
the past three years, which could be adjudged as the suitable condition for the
management of A2 Milk Company Limited denoting that the entity has raised its
efficiency for undertaking quick release of inventory.
Days’ receivable turnover denotes the efficacy of the entities to collect their
owned amounts from the customers (Gippel, Smith and Zhu 2015). The above figure
clearly indicates that the trend is declining for the A2 Milk Company Limited over the
three-year period, which denotes the rising efficiency of the entity in obtaining its dues.
Thus, it has been taking lower time for gathering its receivables.
Days’ payable turnover denotes the efficiency of a firm to settle its dues to the
suppliers and creditors (Gitman, Juchau and Flanagan 2015). This ratio after increasing
from 2016 to 2017 has fallen again in 2018. Since the fluctuations are lower, it denotes
that the A2 Milk Company Limited is settling its creditor payments timely towards the
formation of sound relationship between them.
Cash conversion cycle implies the ability of the firm to transform its resources
into cash (Hillier et al. 2014). The above figure clearly indicates negative cash
conversion cycle for the A2 Milk Company Limited over the years, which denotes that
lower time is taken by the firm in order to sell inventory and obtain cash from the
customers in contrast to the period where the suppliers of inventory have to be paid.
In accordance with the above discussion, the A2 Milk Company Limited has
managed to maintain its operating efficacy over the period, which is advantageous from
the viewpoints of the investor and the organisation.
2.3 Cash management analysis:
Marketable securities in current assets are deemed to be the kind of liquid assets
on the balance sheet statement, which could be transformed easily into cash (Hirshleifer
2015). From the annual report of the A2 Milk Company Limited in 2018, it could be seen
that cash in hand and at bank as well as short-term deposits could be taken into
account in the form of marketable deposits of the organisation valuing $121,020,000 in
2017 and $340,455,000 in 2018 (The a2 Milk Company 2019). Moreover, increase in
Days inventory
turnover Days receivables
turnover Days payables
turnover Cash conversion
cycle
-40.00
-20.00
-
20.00
40.00
60.00
80.00
100.00
120.00
140.00
Operating Efficiency Ratios
2016
2017
2018
Figure 2: Operating efficiency ratios and their trend of the A2 Milk Company
Limited for the years 2016-2018
(Source: The a2 Milk Company 2019)
Days’ inventory turnover gauges the capability of an entity to manage its
inventory (Foley and Manova 2015). This ratio is observed to decrease continuously for
the past three years, which could be adjudged as the suitable condition for the
management of A2 Milk Company Limited denoting that the entity has raised its
efficiency for undertaking quick release of inventory.
Days’ receivable turnover denotes the efficacy of the entities to collect their
owned amounts from the customers (Gippel, Smith and Zhu 2015). The above figure
clearly indicates that the trend is declining for the A2 Milk Company Limited over the
three-year period, which denotes the rising efficiency of the entity in obtaining its dues.
Thus, it has been taking lower time for gathering its receivables.
Days’ payable turnover denotes the efficiency of a firm to settle its dues to the
suppliers and creditors (Gitman, Juchau and Flanagan 2015). This ratio after increasing
from 2016 to 2017 has fallen again in 2018. Since the fluctuations are lower, it denotes
that the A2 Milk Company Limited is settling its creditor payments timely towards the
formation of sound relationship between them.
Cash conversion cycle implies the ability of the firm to transform its resources
into cash (Hillier et al. 2014). The above figure clearly indicates negative cash
conversion cycle for the A2 Milk Company Limited over the years, which denotes that
lower time is taken by the firm in order to sell inventory and obtain cash from the
customers in contrast to the period where the suppliers of inventory have to be paid.
In accordance with the above discussion, the A2 Milk Company Limited has
managed to maintain its operating efficacy over the period, which is advantageous from
the viewpoints of the investor and the organisation.
2.3 Cash management analysis:
Marketable securities in current assets are deemed to be the kind of liquid assets
on the balance sheet statement, which could be transformed easily into cash (Hirshleifer
2015). From the annual report of the A2 Milk Company Limited in 2018, it could be seen
that cash in hand and at bank as well as short-term deposits could be taken into
account in the form of marketable deposits of the organisation valuing $121,020,000 in
2017 and $340,455,000 in 2018 (The a2 Milk Company 2019). Moreover, increase in
Paraphrase This Document
Need a fresh take? Get an instant paraphrase of this document with our AI Paraphraser
7COMPANY PERFORMANCE ANALYSIS
cash as well as other short-term deposits of the A2 Milk Company Limited could be
witnessed in 2018 compared to the previous year.
In this case, it is necessary to mention that these instruments are used by the
organisations for generating return on cash and the similar aspect could be witnessed in
case of the A2 Milk Company Limited as well. In accordance with “Note D3 of the
Annual Report”, the organisation earns floating rate interest based on the daily rates of
bank deposits. This denotes that such securities function as source of cash for the
organisation, which is required for effective cash management (Kim and Zhang 2016).
The organisations could not ignore the significance of sound mechanisms of cash
management. The rise in these marketable securities in the balance sheet statement
represents the strategy of the A2 Milk Company Limited for improving cash collection,
as it would boost the liquidity position, which is a critical cash management aspect.
Moreover, by maintaining adequate cash balance, the A2 Milk Company Limited has the
opportunity of combating with the economic fluctuations as well as financial stability for
undertaking investments, when there is effective price. The big corporate investors
could consider the A2 Milk Company Limited as a target when there is adequate cash
balance that could be utilised productively (Lee, Sameen and Cowling 2015).
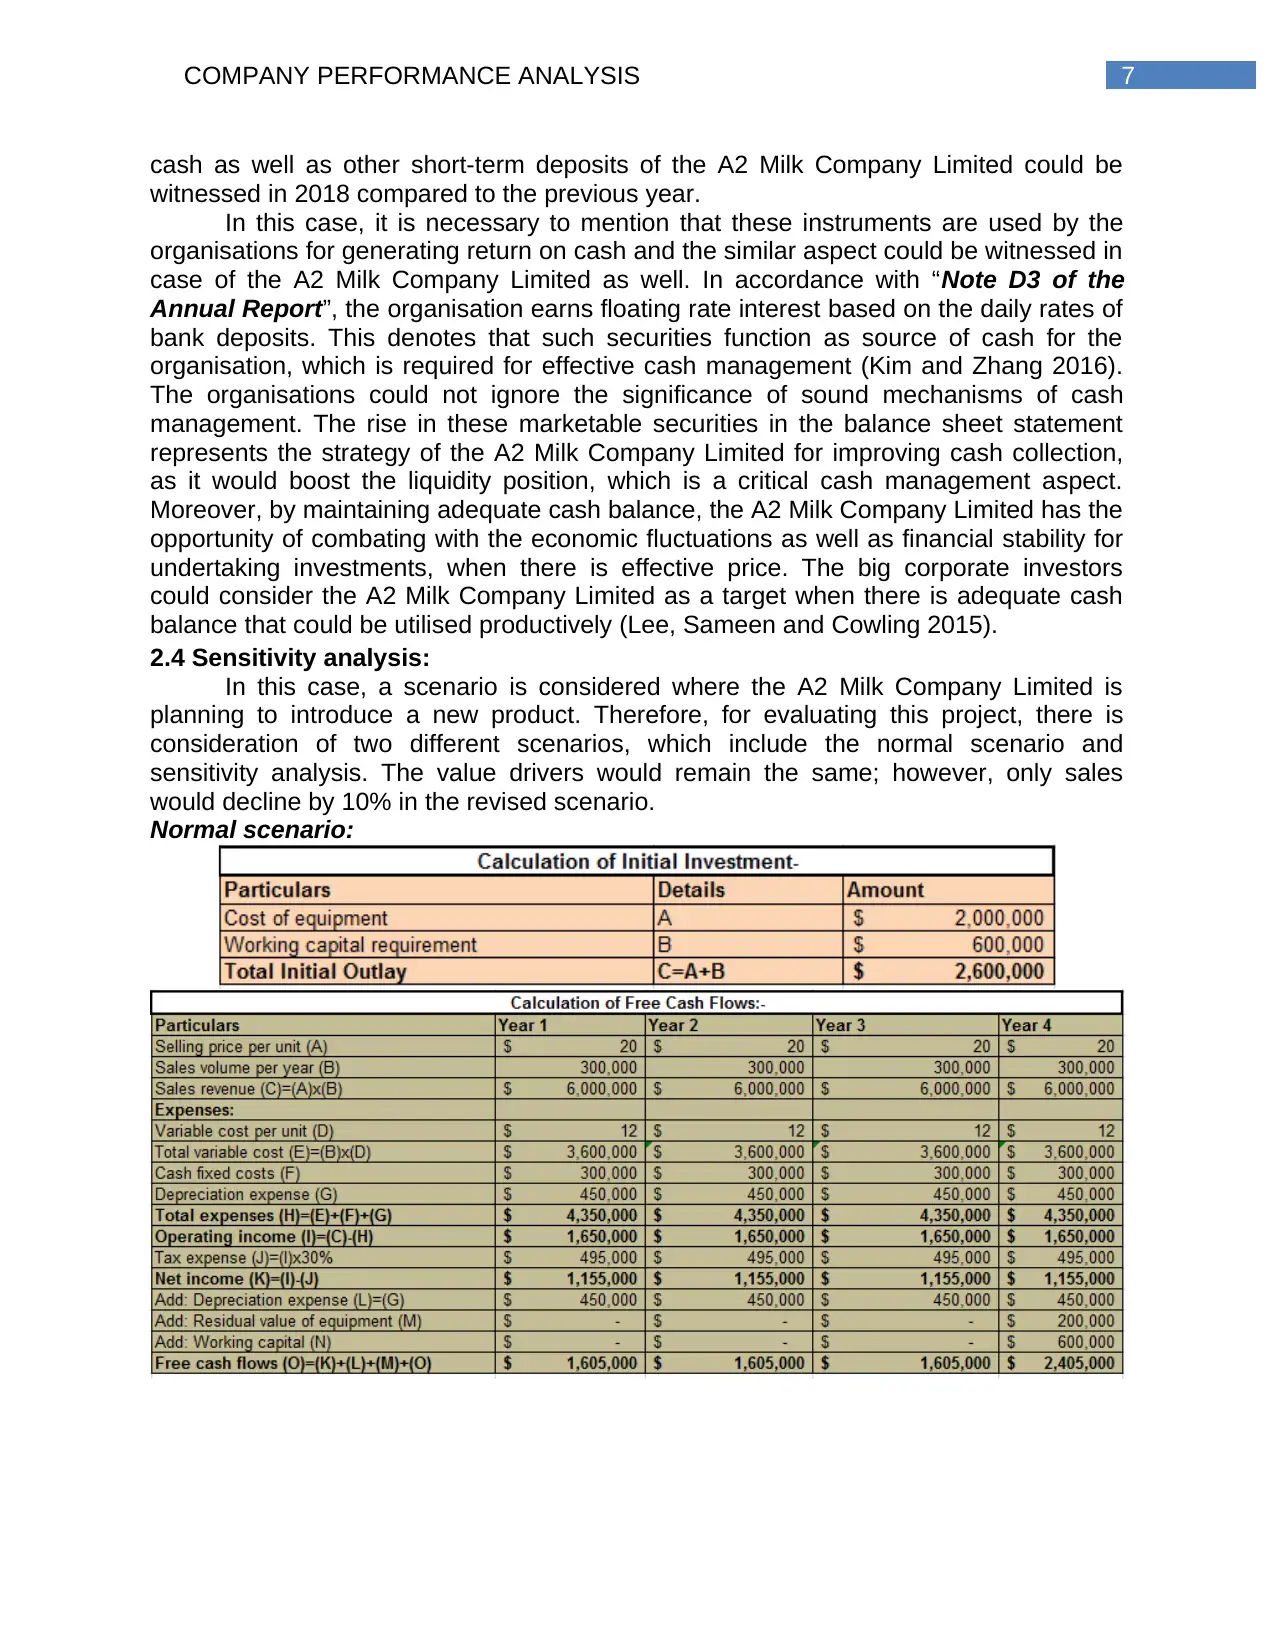
2.4 Sensitivity analysis:
In this case, a scenario is considered where the A2 Milk Company Limited is
planning to introduce a new product. Therefore, for evaluating this project, there is
consideration of two different scenarios, which include the normal scenario and
sensitivity analysis. The value drivers would remain the same; however, only sales
would decline by 10% in the revised scenario.
Normal scenario:
cash as well as other short-term deposits of the A2 Milk Company Limited could be
witnessed in 2018 compared to the previous year.
In this case, it is necessary to mention that these instruments are used by the
organisations for generating return on cash and the similar aspect could be witnessed in
case of the A2 Milk Company Limited as well. In accordance with “Note D3 of the
Annual Report”, the organisation earns floating rate interest based on the daily rates of
bank deposits. This denotes that such securities function as source of cash for the
organisation, which is required for effective cash management (Kim and Zhang 2016).
The organisations could not ignore the significance of sound mechanisms of cash
management. The rise in these marketable securities in the balance sheet statement
represents the strategy of the A2 Milk Company Limited for improving cash collection,
as it would boost the liquidity position, which is a critical cash management aspect.
Moreover, by maintaining adequate cash balance, the A2 Milk Company Limited has the
opportunity of combating with the economic fluctuations as well as financial stability for
undertaking investments, when there is effective price. The big corporate investors
could consider the A2 Milk Company Limited as a target when there is adequate cash
balance that could be utilised productively (Lee, Sameen and Cowling 2015).
2.4 Sensitivity analysis:
In this case, a scenario is considered where the A2 Milk Company Limited is
planning to introduce a new product. Therefore, for evaluating this project, there is
consideration of two different scenarios, which include the normal scenario and
sensitivity analysis. The value drivers would remain the same; however, only sales
would decline by 10% in the revised scenario.
Normal scenario:
8COMPANY PERFORMANCE ANALYSIS
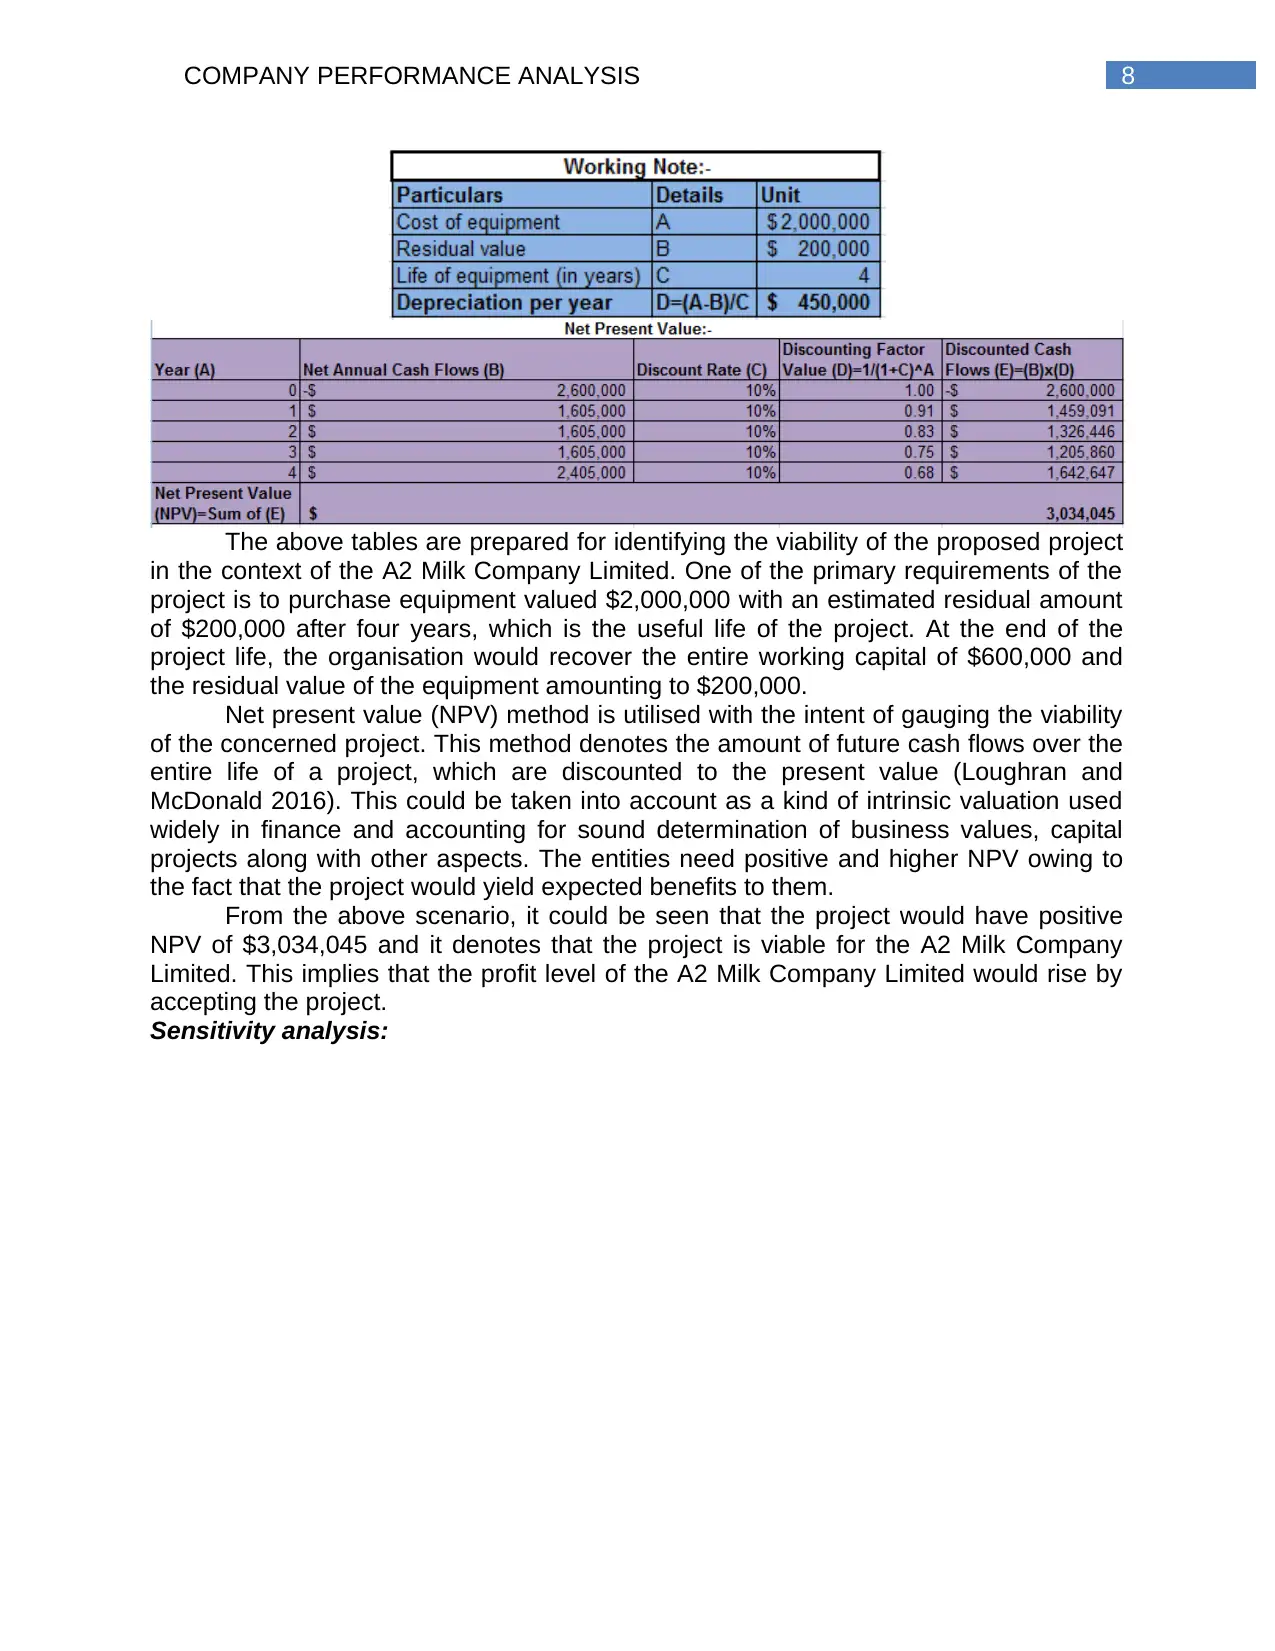
The above tables are prepared for identifying the viability of the proposed project
in the context of the A2 Milk Company Limited. One of the primary requirements of the
project is to purchase equipment valued $2,000,000 with an estimated residual amount
of $200,000 after four years, which is the useful life of the project. At the end of the
project life, the organisation would recover the entire working capital of $600,000 and
the residual value of the equipment amounting to $200,000.
Net present value (NPV) method is utilised with the intent of gauging the viability
of the concerned project. This method denotes the amount of future cash flows over the
entire life of a project, which are discounted to the present value (Loughran and
McDonald 2016). This could be taken into account as a kind of intrinsic valuation used
widely in finance and accounting for sound determination of business values, capital
projects along with other aspects. The entities need positive and higher NPV owing to
the fact that the project would yield expected benefits to them.
From the above scenario, it could be seen that the project would have positive
NPV of $3,034,045 and it denotes that the project is viable for the A2 Milk Company
Limited. This implies that the profit level of the A2 Milk Company Limited would rise by
accepting the project.
Sensitivity analysis:
⊘ This is a preview!⊘
Do you want full access?
Subscribe today to unlock all pages.
Trusted by 1+ million students worldwide
9COMPANY PERFORMANCE ANALYSIS
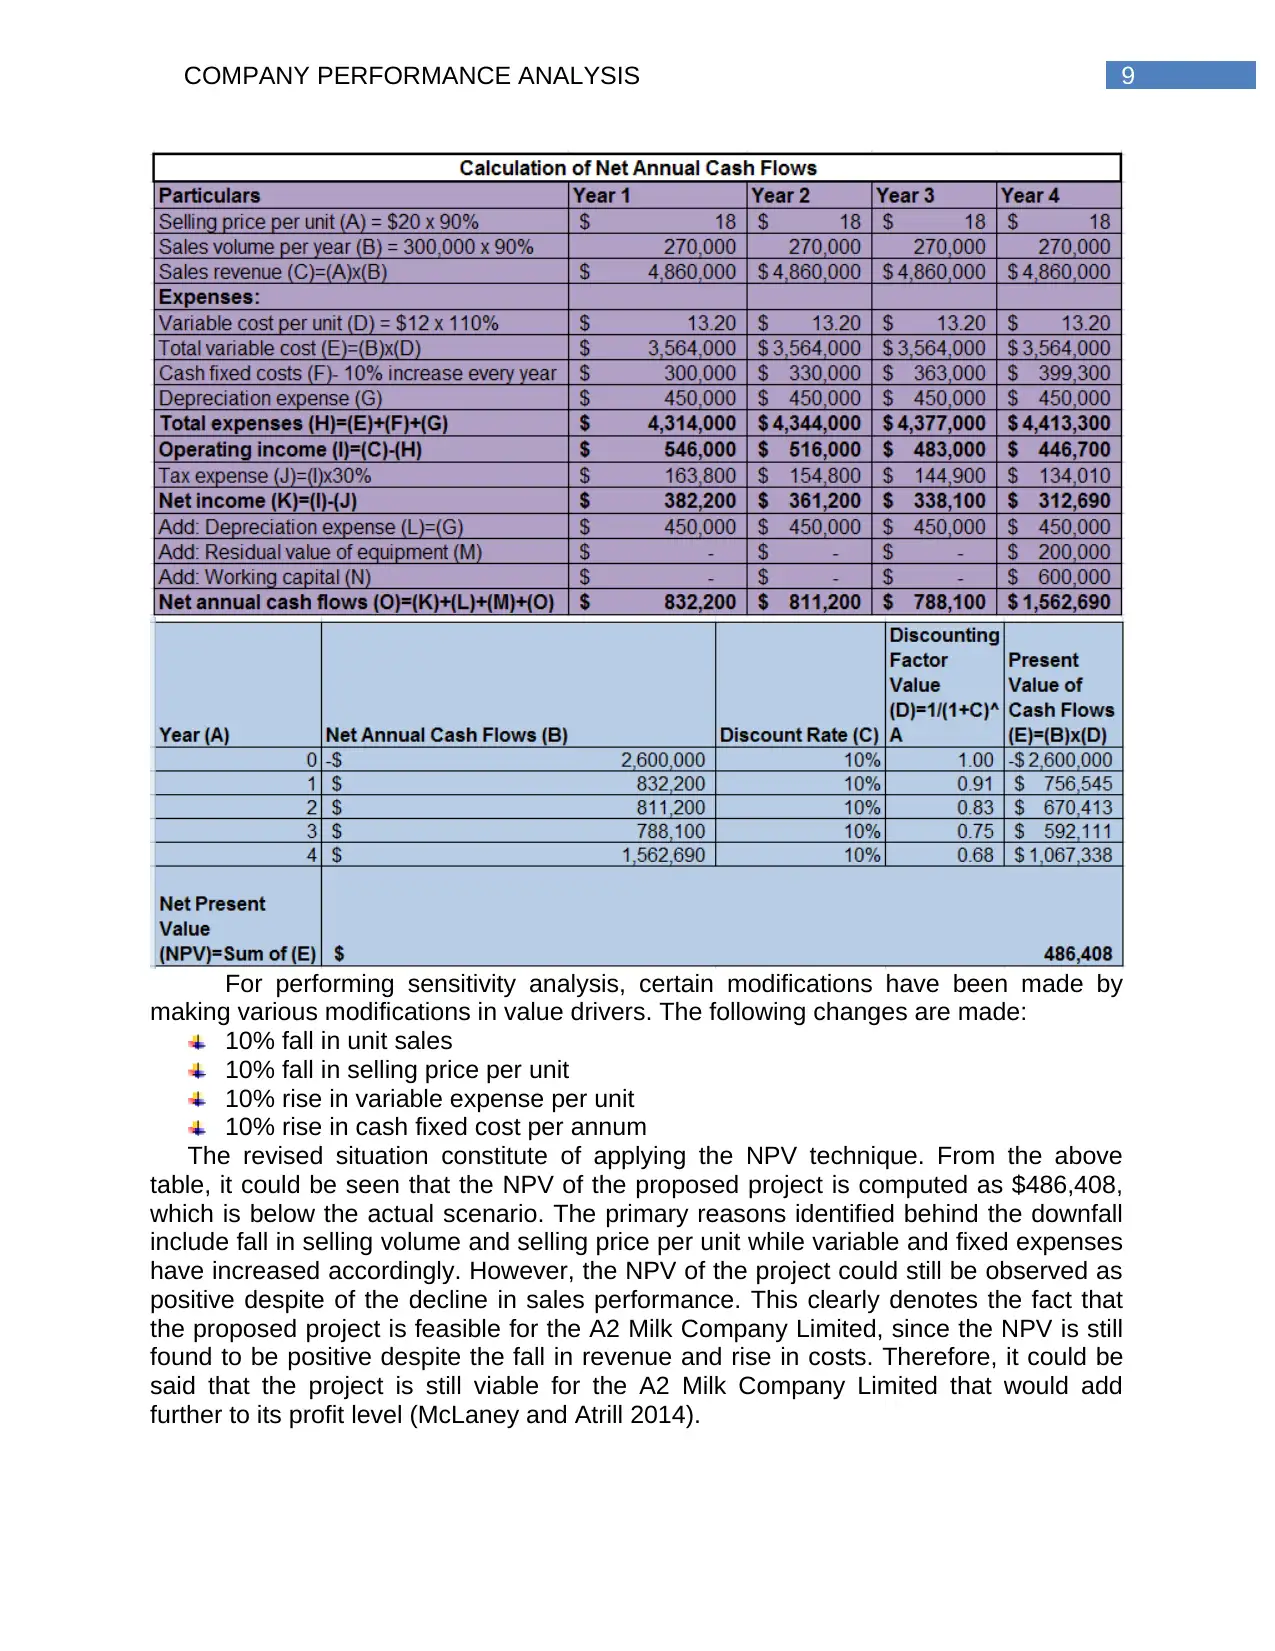
For performing sensitivity analysis, certain modifications have been made by
making various modifications in value drivers. The following changes are made:
10% fall in unit sales
10% fall in selling price per unit
10% rise in variable expense per unit
10% rise in cash fixed cost per annum
The revised situation constitute of applying the NPV technique. From the above
table, it could be seen that the NPV of the proposed project is computed as $486,408,
which is below the actual scenario. The primary reasons identified behind the downfall
include fall in selling volume and selling price per unit while variable and fixed expenses
have increased accordingly. However, the NPV of the project could still be observed as
positive despite of the decline in sales performance. This clearly denotes the fact that
the proposed project is feasible for the A2 Milk Company Limited, since the NPV is still
found to be positive despite the fall in revenue and rise in costs. Therefore, it could be
said that the project is still viable for the A2 Milk Company Limited that would add
further to its profit level (McLaney and Atrill 2014).
Paraphrase This Document
Need a fresh take? Get an instant paraphrase of this document with our AI Paraphraser
10COMPANY PERFORMANCE ANALYSIS
2.5 Systemic and un-systemic risks:
The systemic risk occurs owing to the alterations in macroeconomic factors such
as interest rate changes, inflation and others (Quattrone 2016). The A2 Milk Company
Limited is exposed to the following types of systemic risks:
Equity price risk:
The organisation is exposed to this specific risk on listed investments, which are
categorised as well as gauged at fair value via other comprehensive income. However,
this risk is not hedged by the management of the organisation. However, it monitors this
specific risk exposure by comparing the quoted share price movement of long-term
investments (Rogers and Makonnen 2014).
Foreign currency risk:
The business operations of the entity are prone towards foreign currency risk
arising out of the fluctuations in the currencies of the nations such as UK, China and US
compared to the AUD and NZD currencies. There is no hedging strategy adopted by the
organisation; however, it might shift its cash balances within time between currencies
for exposure minimisation.
Un-systemic risk could be observed only with the particular sector and these
risks of the A2 Milk Company Limited are represented as follows:
Supply chain:
The organisation might lose its ability of maintaining its product supply, if there is
any adverse or material modification in the operations of suppliers or fall in support from
its suppliers.
Product quality:
The organisation is prone to this risk, since its products might be polluted or they
might be tampered or adulterated or it might face unsafe competition. These aspects
could result in injury or harm to the rivals.
Rise in competition:
Since the industry where the A2 Milk Company Limited operates is highly
competitive, rise in competition could tamper the business operations, particularly in
sales as well as revenue bases. These are identified as significant un-systemic risk
associated with the operations of the A2 Milk Company Limited (Xiang and Worthington
2015).
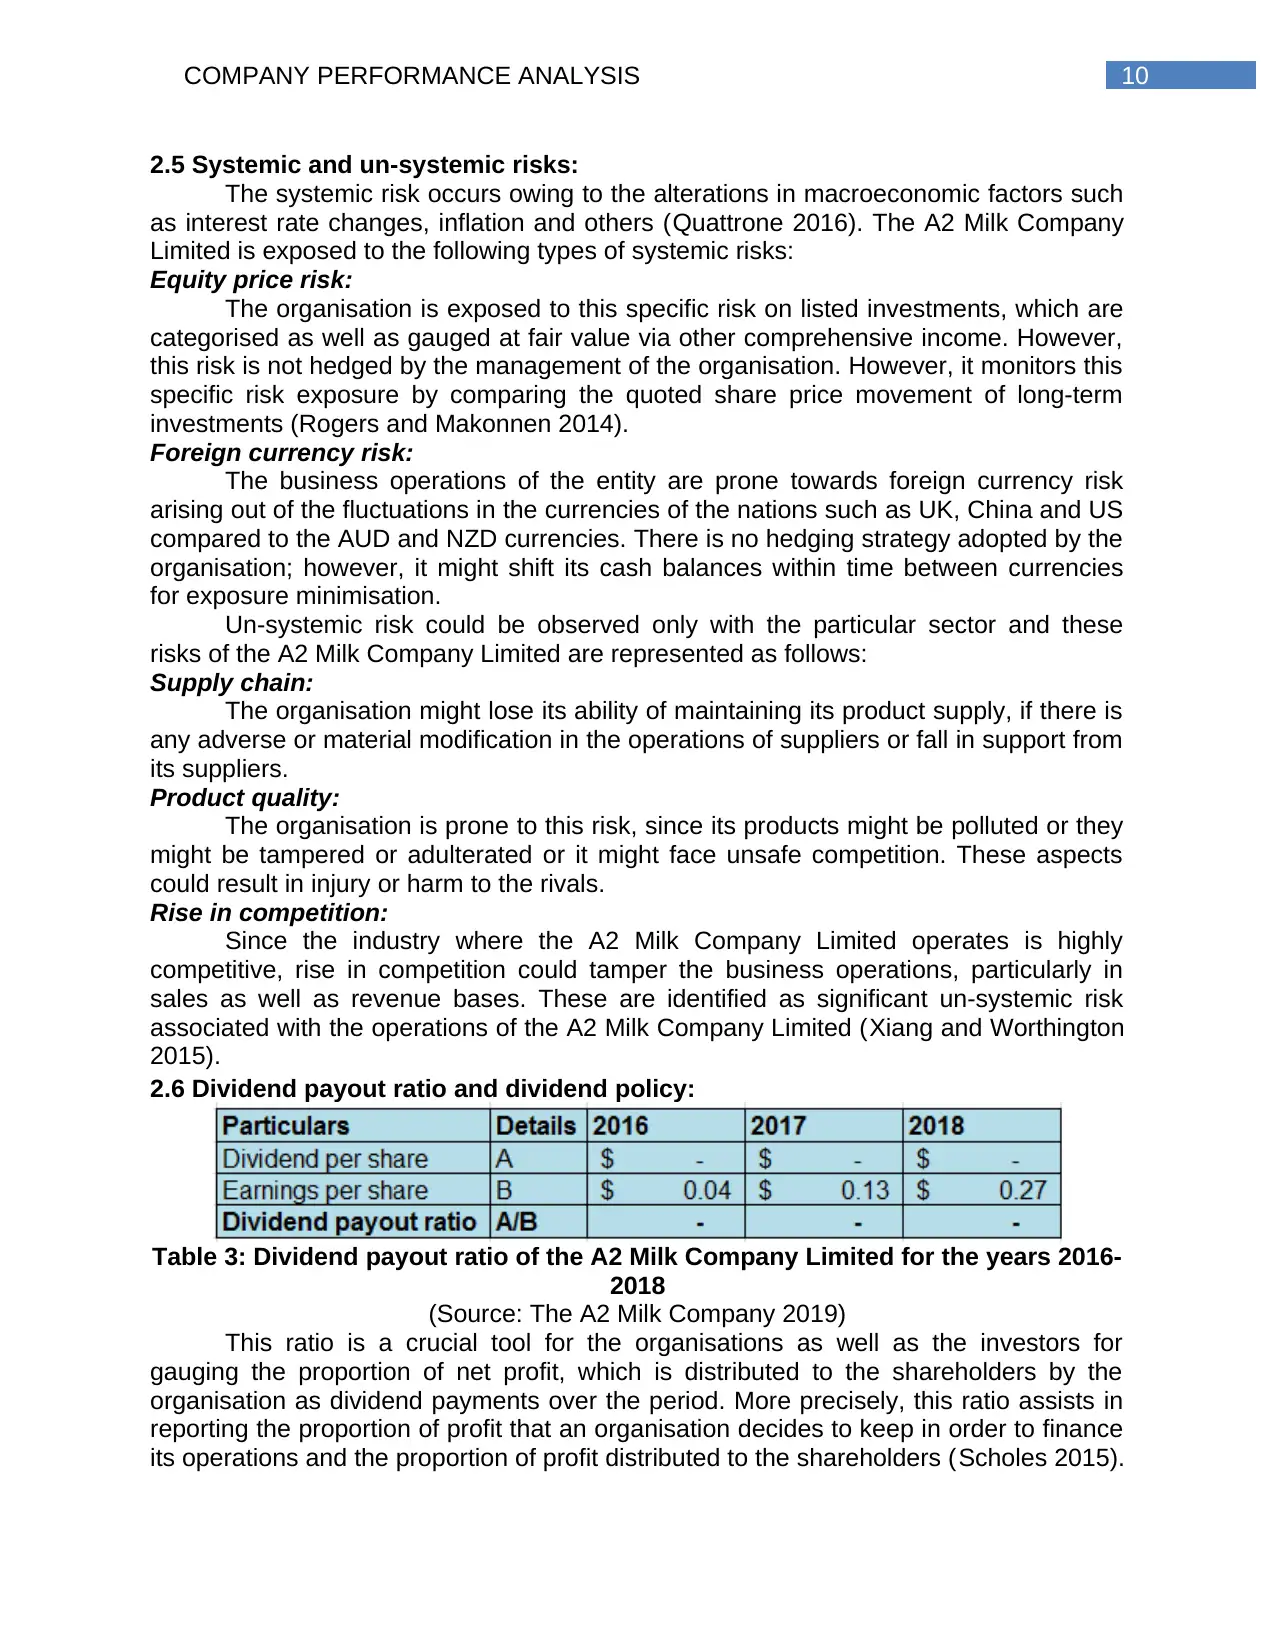
2.6 Dividend payout ratio and dividend policy:
Table 3: Dividend payout ratio of the A2 Milk Company Limited for the years 2016-
2018
(Source: The A2 Milk Company 2019)
This ratio is a crucial tool for the organisations as well as the investors for
gauging the proportion of net profit, which is distributed to the shareholders by the
organisation as dividend payments over the period. More precisely, this ratio assists in
reporting the proportion of profit that an organisation decides to keep in order to finance
its operations and the proportion of profit distributed to the shareholders (Scholes 2015).
2.5 Systemic and un-systemic risks:
The systemic risk occurs owing to the alterations in macroeconomic factors such
as interest rate changes, inflation and others (Quattrone 2016). The A2 Milk Company
Limited is exposed to the following types of systemic risks:
Equity price risk:
The organisation is exposed to this specific risk on listed investments, which are
categorised as well as gauged at fair value via other comprehensive income. However,
this risk is not hedged by the management of the organisation. However, it monitors this
specific risk exposure by comparing the quoted share price movement of long-term
investments (Rogers and Makonnen 2014).
Foreign currency risk:
The business operations of the entity are prone towards foreign currency risk
arising out of the fluctuations in the currencies of the nations such as UK, China and US
compared to the AUD and NZD currencies. There is no hedging strategy adopted by the
organisation; however, it might shift its cash balances within time between currencies
for exposure minimisation.
Un-systemic risk could be observed only with the particular sector and these
risks of the A2 Milk Company Limited are represented as follows:
Supply chain:
The organisation might lose its ability of maintaining its product supply, if there is
any adverse or material modification in the operations of suppliers or fall in support from
its suppliers.
Product quality:
The organisation is prone to this risk, since its products might be polluted or they
might be tampered or adulterated or it might face unsafe competition. These aspects
could result in injury or harm to the rivals.
Rise in competition:
Since the industry where the A2 Milk Company Limited operates is highly
competitive, rise in competition could tamper the business operations, particularly in
sales as well as revenue bases. These are identified as significant un-systemic risk
associated with the operations of the A2 Milk Company Limited (Xiang and Worthington
2015).
2.6 Dividend payout ratio and dividend policy:
Table 3: Dividend payout ratio of the A2 Milk Company Limited for the years 2016-
2018
(Source: The A2 Milk Company 2019)
This ratio is a crucial tool for the organisations as well as the investors for
gauging the proportion of net profit, which is distributed to the shareholders by the
organisation as dividend payments over the period. More precisely, this ratio assists in
reporting the proportion of profit that an organisation decides to keep in order to finance
its operations and the proportion of profit distributed to the shareholders (Scholes 2015).
11COMPANY PERFORMANCE ANALYSIS
It is necessary to be stated that the investors have significant interest in the ratio, since
they intend to have an idea of whether the organisations are distributing adequate
proportion of net income to the investors (Swift and Piff 2014).
The situation is not the same for the A2 Milk Company Limited. From the above
table, it is evident that the dividend payout ratio of the organisation is zero over all the
three-year period. The dividend per share of the firm has been nil over the three-year
period. All these aspects signify that no dividend has been paid by the A2 Milk
Company Limited over the years. This clearly denotes that the organisation follows zero
dividend policy, as it has focused on increasing its retained earnings. As a result, there
might be decline in the confidence of the investors and shareholders associated with the
organisation (Vernimmen et al. 2014).
III. Recommendation letter:
To,
The Investor,
Date: 22nd May 2019
Subject: Letter of Recommendation
There are various critical aspects that have to be taken into account while
undertaking investment decision on the A2 Milk Company Limited. By ensuring that the
aim of this recommendation is to ensure maximum return on investment, it has been
identified that the A2 Milk Company Limited has shown effective movements in terms of
profitability as well as operating efficiency. The organisation has both systemic and un-
systemic risks like other organisations; however, it is possible for the firm to control
these risks. Moreover, owing to the presence of marketable securities, it is deemed to
be a suitable option for investment. However, it has been analysed that the organisation
follows zero dividend policy and hence, it does not provide any return to its
shareholders over the year. Since majority of the financial aspects are found to be
positive, it is recommended to the investor to invest in the shares of the A2 Milk
Company Limited for earning better returns in future.
IV. Conclusion:
Based on the above discussion, it has been evaluated that the A2 Milk Company
Limited is operating in the Australian milk and dairy industry. It has been found that the
organisation has maintained both stable profitability and operating efficiency positions.
Moreover, the proposed project is observed to provide significant benefits to the
organisation in future. However, it has been analysed that the organisation follows zero
dividend policy and hence, it does not provide any return to its shareholders over the
year. Since majority of the financial aspects are found to be positive, it is recommended
to the investor to invest in the shares of the A2 Milk Company Limited for earning better
returns in future.
⊘ This is a preview!⊘
Do you want full access?
Subscribe today to unlock all pages.
Trusted by 1+ million students worldwide
1 out of 14
Related Documents


Your All-in-One AI-Powered Toolkit for Academic Success.
+13062052269
info@desklib.com
Available 24*7 on WhatsApp / Email
![[object Object]](/_next/static/media/star-bottom.7253800d.svg)
Unlock your academic potential
Copyright © 2020–2026 A2Z Services. All Rights Reserved. Developed and managed by ZUCOL.