Financial Accounting Assignment: Project Evaluation and Analysis
VerifiedAdded on 2022/11/14
|25
|6828
|212
Report
AI Summary
This financial accounting assignment analyzes two projects for Gelco Ltd, evaluating them using payback period, accounting rate of return (ARR), net present value (NPV), and profitability index. The assignment delves into the calculations for each method, including discounted cash flows, and assesses the suitability of each technique for investment decision-making. It discusses the advantages and disadvantages of each method, such as the simplicity of the payback period versus the consideration of the time value of money in NPV. The report also examines the relevance of variance analysis, strategies for maintaining market leadership, break-even point and margin of safety, and absorption costing. The assignment provides detailed calculations and interpretations to aid in understanding and applying financial accounting principles for effective project evaluation and financial management.

Running head: FINANCIAL ACCOUNTING ASSIGNMENT
Financial accounting assignment
Name of the student
Name of the university
Student ID
Author note
Financial accounting assignment
Name of the student
Name of the university
Student ID
Author note
Paraphrase This Document
Need a fresh take? Get an instant paraphrase of this document with our AI Paraphraser

1FINANCIAL ACCOUNTING ASSIGNMENT
Table of Contents
Question 1........................................................................................................................................2
(a) Payback period..................................................................................................................3
(b) Accounting rate of return (ARR)......................................................................................6
(c) Discounting technique and net present value....................................................................8
(d) Profitability index (PI)....................................................................................................10
Question 2......................................................................................................................................12
(a) Relevance of variance analysis.......................................................................................12
(b) Strategies for saving the market leadership....................................................................15
(c) Break-even point and margin of safety...........................................................................17
(d) Absorption costing..........................................................................................................19
Reference.......................................................................................................................................21
2FINANCIAL ACCOUNTING ASSIGNMENT
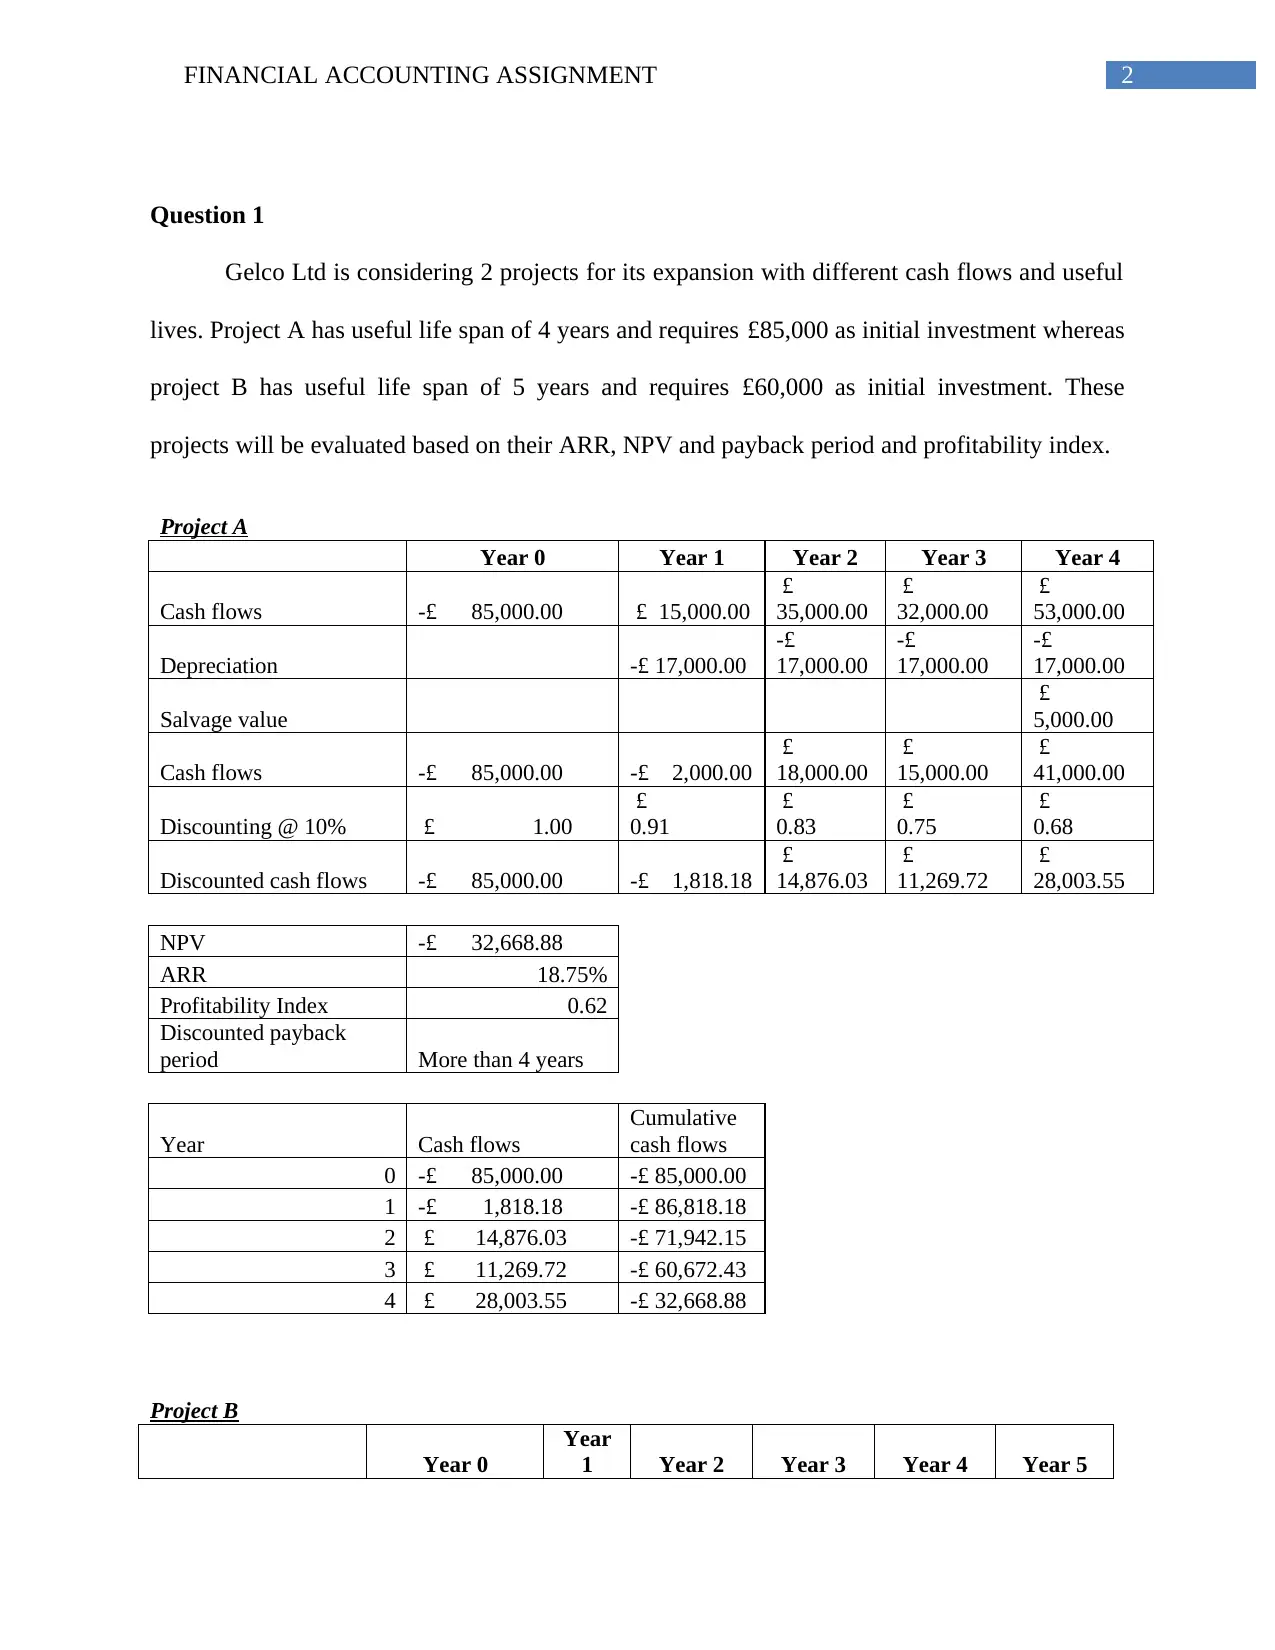
Question 1
Gelco Ltd is considering 2 projects for its expansion with different cash flows and useful
lives. Project A has useful life span of 4 years and requires £85,000 as initial investment whereas
project B has useful life span of 5 years and requires £60,000 as initial investment. These
projects will be evaluated based on their ARR, NPV and payback period and profitability index.
Project A
Year 0 Year 1 Year 2 Year 3 Year 4
Cash flows -£ 85,000.00 £ 15,000.00
£
35,000.00
£
32,000.00
£
53,000.00
Depreciation -£ 17,000.00
-£
17,000.00
-£
17,000.00
-£
17,000.00
Salvage value
£
5,000.00
Cash flows -£ 85,000.00 -£ 2,000.00
£
18,000.00
£
15,000.00
£
41,000.00
Discounting @ 10% £ 1.00
£
0.91
£
0.83
£
0.75
£
0.68
Discounted cash flows -£ 85,000.00 -£ 1,818.18
£
14,876.03
£
11,269.72
£
28,003.55
NPV -£ 32,668.88
ARR 18.75%
Profitability Index 0.62
Discounted payback
period More than 4 years
Year Cash flows
Cumulative
cash flows
0 -£ 85,000.00 -£ 85,000.00
1 -£ 1,818.18 -£ 86,818.18
2 £ 14,876.03 -£ 71,942.15
3 £ 11,269.72 -£ 60,672.43
4 £ 28,003.55 -£ 32,668.88
Project B
Year 0
Year
1 Year 2 Year 3 Year 4 Year 5
⊘ This is a preview!⊘
Do you want full access?
Subscribe today to unlock all pages.
Trusted by 1+ million students worldwide
3FINANCIAL ACCOUNTING ASSIGNMENT
Cash flows -£ 60,000.00
£
17,000
.00
£
23,000.00
£
6,900.00
£
12,000.00
£
14,000.00
Depreciation
-£
12,000
.00
-£
9,600.00
-£
7,680.00
-£
6,144.00
-£
4,915.20
Cash flows -£ 60,000.00
£
5,000.
00
£
13,400.00
-£
780.00
£
5,856.00
£
9,084.80
Discounting @ 10%
£
1.00
£
0.91
£
0.83
£
0.75
£
0.68
£
0.62
Discounted cash
flows -£ 60,000.00
£
4,545.
45
£
11,074.38
-£
586.03
£
3,999.73
£
5,640.95
NPV -£ 35,325.52
ARR 12.15%
Profitability Index 0.29
Discounted payback
period More than 5 years
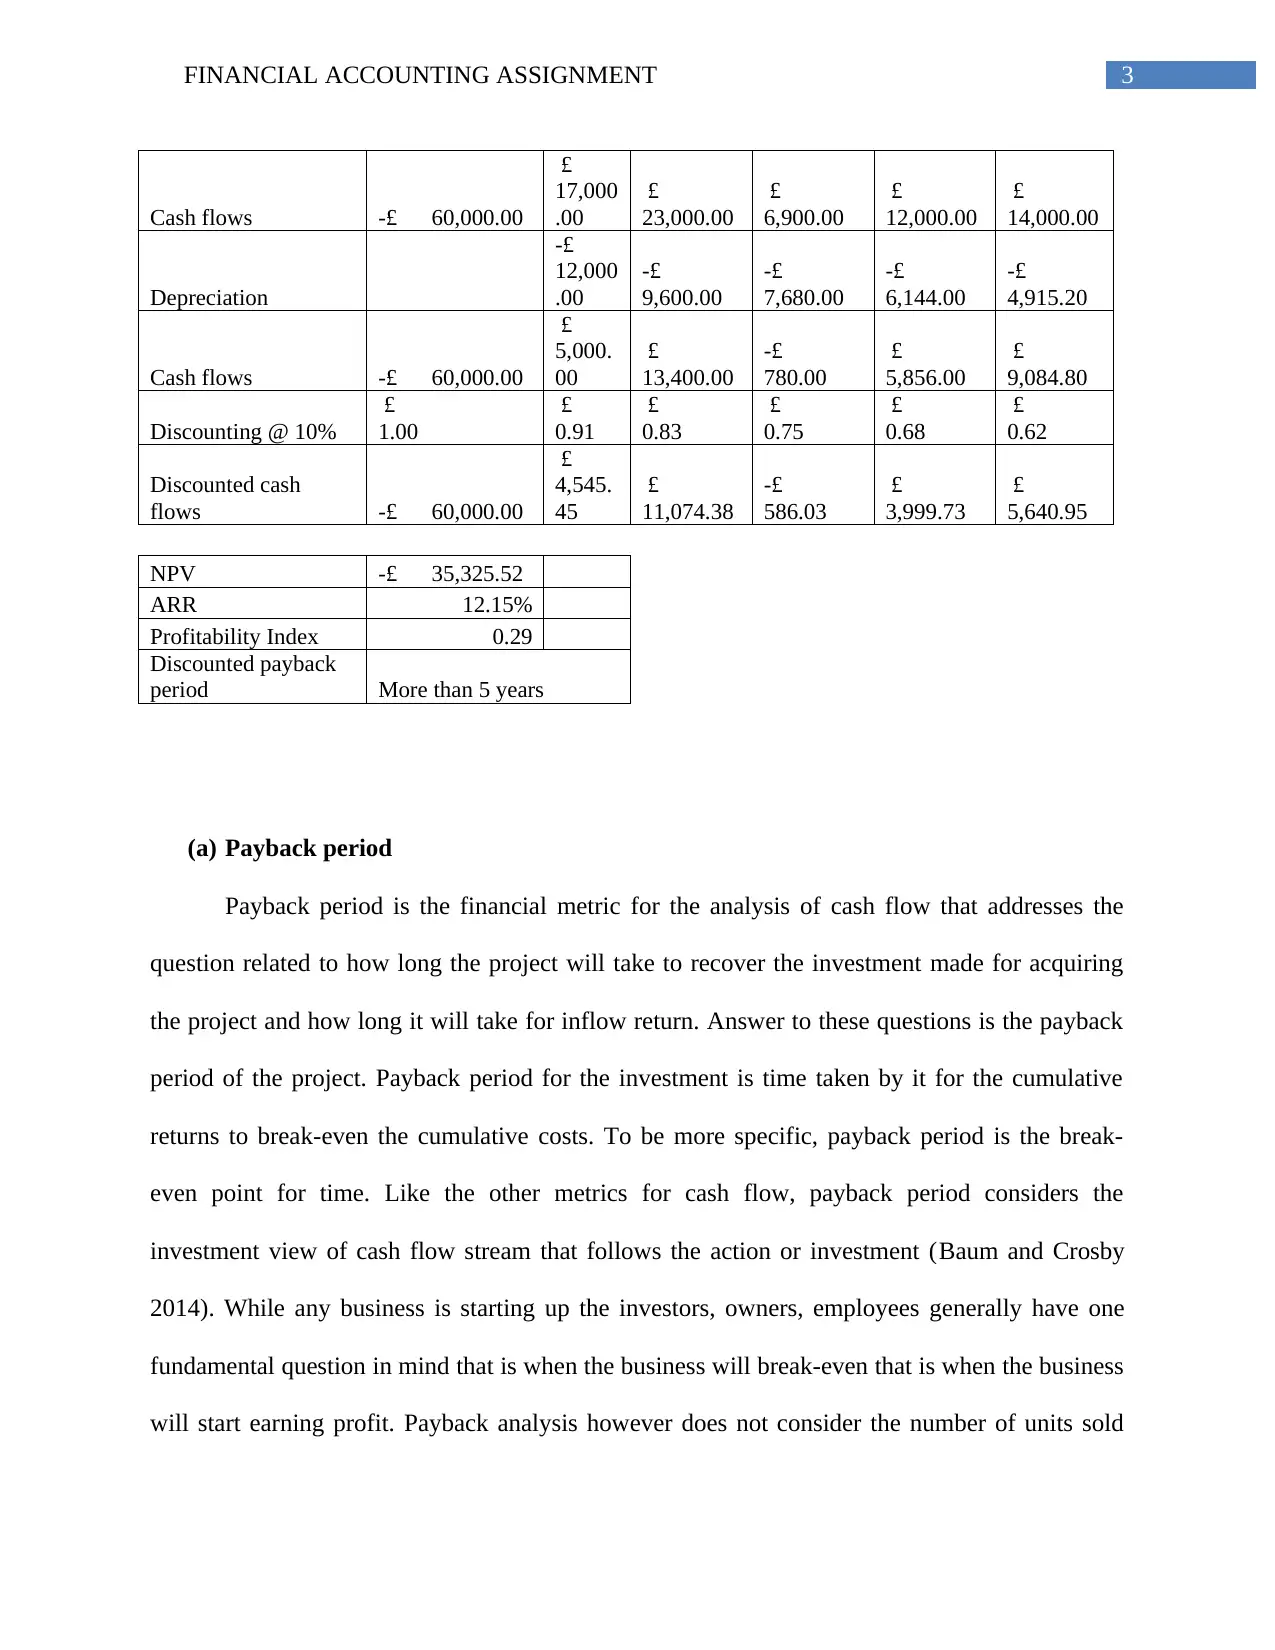
(a) Payback period
Payback period is the financial metric for the analysis of cash flow that addresses the
question related to how long the project will take to recover the investment made for acquiring
the project and how long it will take for inflow return. Answer to these questions is the payback
period of the project. Payback period for the investment is time taken by it for the cumulative
returns to break-even the cumulative costs. To be more specific, payback period is the break-
even point for time. Like the other metrics for cash flow, payback period considers the
investment view of cash flow stream that follows the action or investment (Baum and Crosby
2014). While any business is starting up the investors, owners, employees generally have one
fundamental question in mind that is when the business will break-even that is when the business
will start earning profit. Payback analysis however does not consider the number of units sold
Cash flows -£ 60,000.00
£
17,000
.00
£
23,000.00
£
6,900.00
£
12,000.00
£
14,000.00
Depreciation
-£
12,000
.00
-£
9,600.00
-£
7,680.00
-£
6,144.00
-£
4,915.20
Cash flows -£ 60,000.00
£
5,000.
00
£
13,400.00
-£
780.00
£
5,856.00
£
9,084.80
Discounting @ 10%
£
1.00
£
0.91
£
0.83
£
0.75
£
0.68
£
0.62
Discounted cash
flows -£ 60,000.00
£
4,545.
45
£
11,074.38
-£
586.03
£
3,999.73
£
5,640.95
NPV -£ 35,325.52
ARR 12.15%
Profitability Index 0.29
Discounted payback
period More than 5 years
(a) Payback period
Payback period is the financial metric for the analysis of cash flow that addresses the
question related to how long the project will take to recover the investment made for acquiring
the project and how long it will take for inflow return. Answer to these questions is the payback
period of the project. Payback period for the investment is time taken by it for the cumulative
returns to break-even the cumulative costs. To be more specific, payback period is the break-
even point for time. Like the other metrics for cash flow, payback period considers the
investment view of cash flow stream that follows the action or investment (Baum and Crosby
2014). While any business is starting up the investors, owners, employees generally have one
fundamental question in mind that is when the business will break-even that is when the business
will start earning profit. Payback analysis however does not consider the number of units sold
Paraphrase This Document
Need a fresh take? Get an instant paraphrase of this document with our AI Paraphraser
4FINANCIAL ACCOUNTING ASSIGNMENT
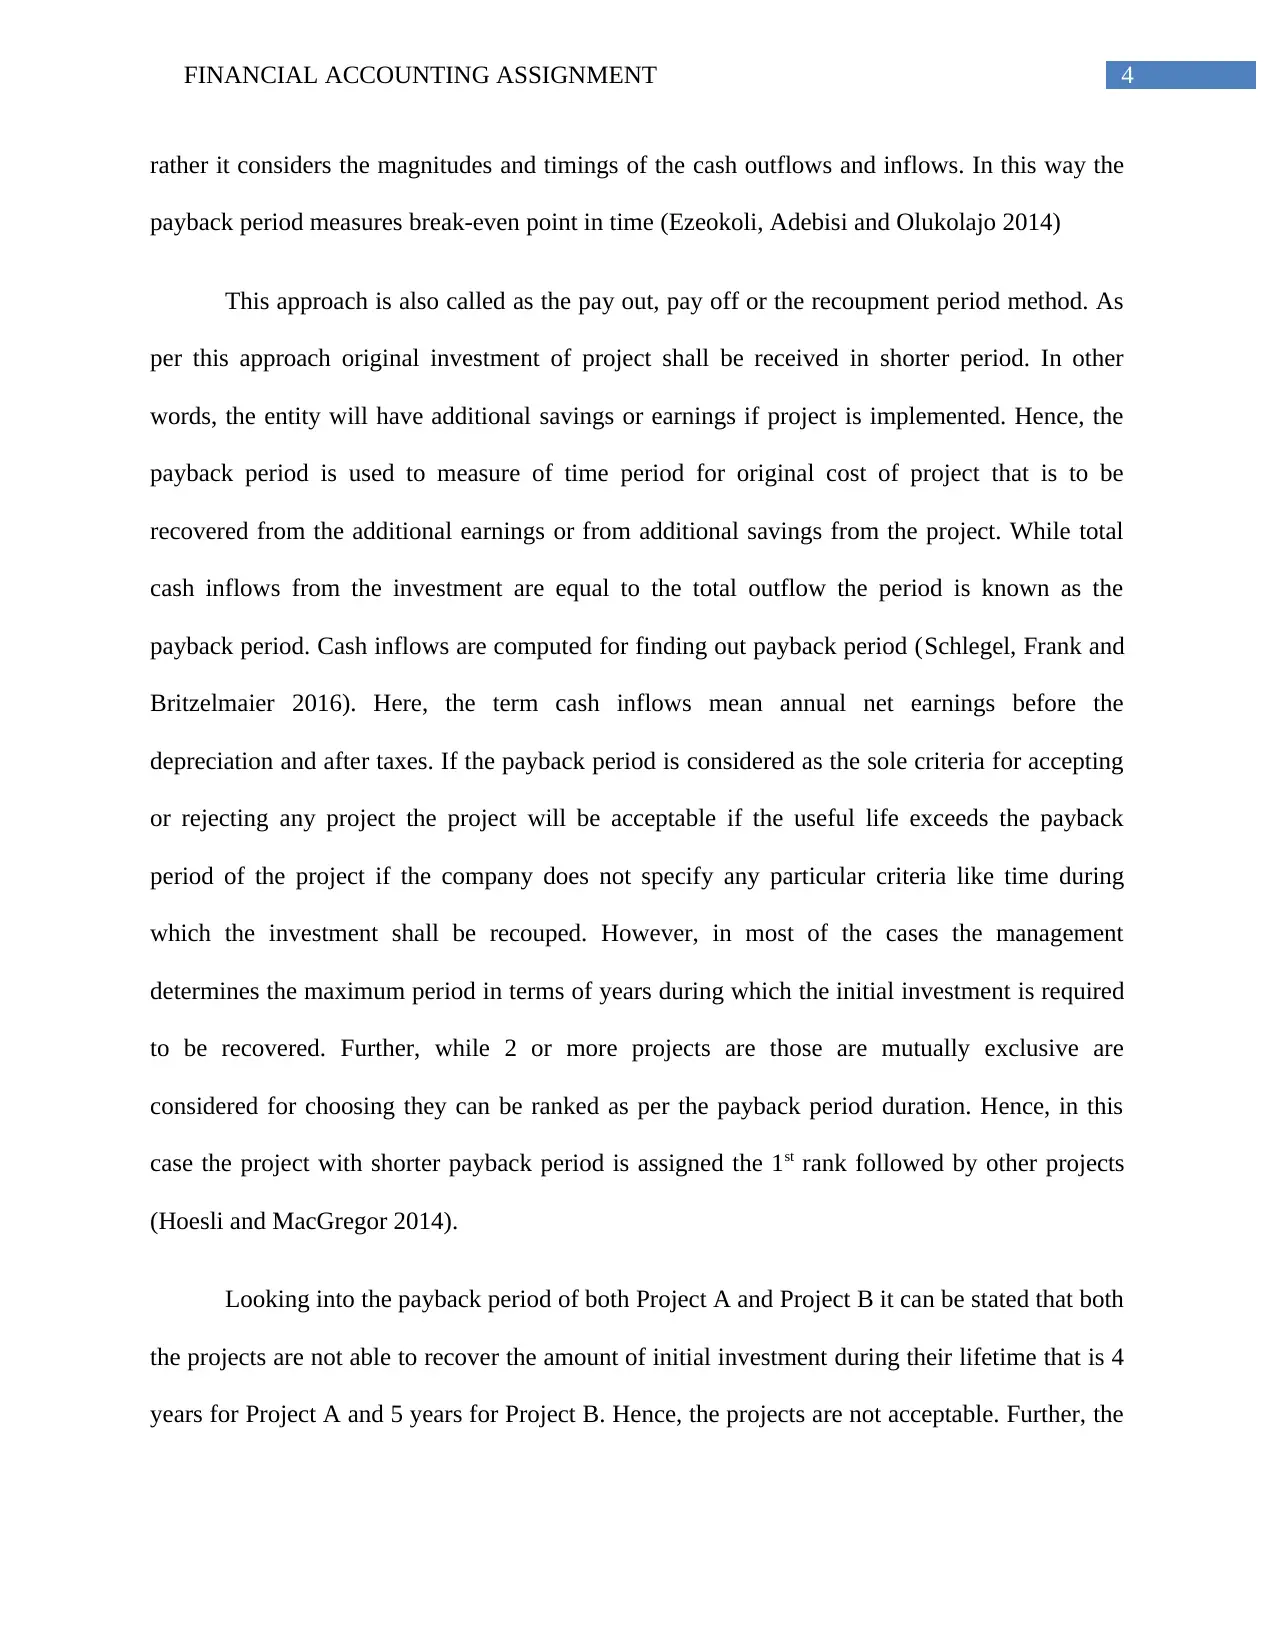
rather it considers the magnitudes and timings of the cash outflows and inflows. In this way the
payback period measures break-even point in time (Ezeokoli, Adebisi and Olukolajo 2014)
This approach is also called as the pay out, pay off or the recoupment period method. As
per this approach original investment of project shall be received in shorter period. In other
words, the entity will have additional savings or earnings if project is implemented. Hence, the
payback period is used to measure of time period for original cost of project that is to be
recovered from the additional earnings or from additional savings from the project. While total
cash inflows from the investment are equal to the total outflow the period is known as the
payback period. Cash inflows are computed for finding out payback period (Schlegel, Frank and
Britzelmaier 2016). Here, the term cash inflows mean annual net earnings before the
depreciation and after taxes. If the payback period is considered as the sole criteria for accepting
or rejecting any project the project will be acceptable if the useful life exceeds the payback
period of the project if the company does not specify any particular criteria like time during
which the investment shall be recouped. However, in most of the cases the management
determines the maximum period in terms of years during which the initial investment is required
to be recovered. Further, while 2 or more projects are those are mutually exclusive are
considered for choosing they can be ranked as per the payback period duration. Hence, in this
case the project with shorter payback period is assigned the 1st rank followed by other projects
(Hoesli and MacGregor 2014).
Looking into the payback period of both Project A and Project B it can be stated that both
the projects are not able to recover the amount of initial investment during their lifetime that is 4
years for Project A and 5 years for Project B. Hence, the projects are not acceptable. Further, the
5FINANCIAL ACCOUNTING ASSIGNMENT
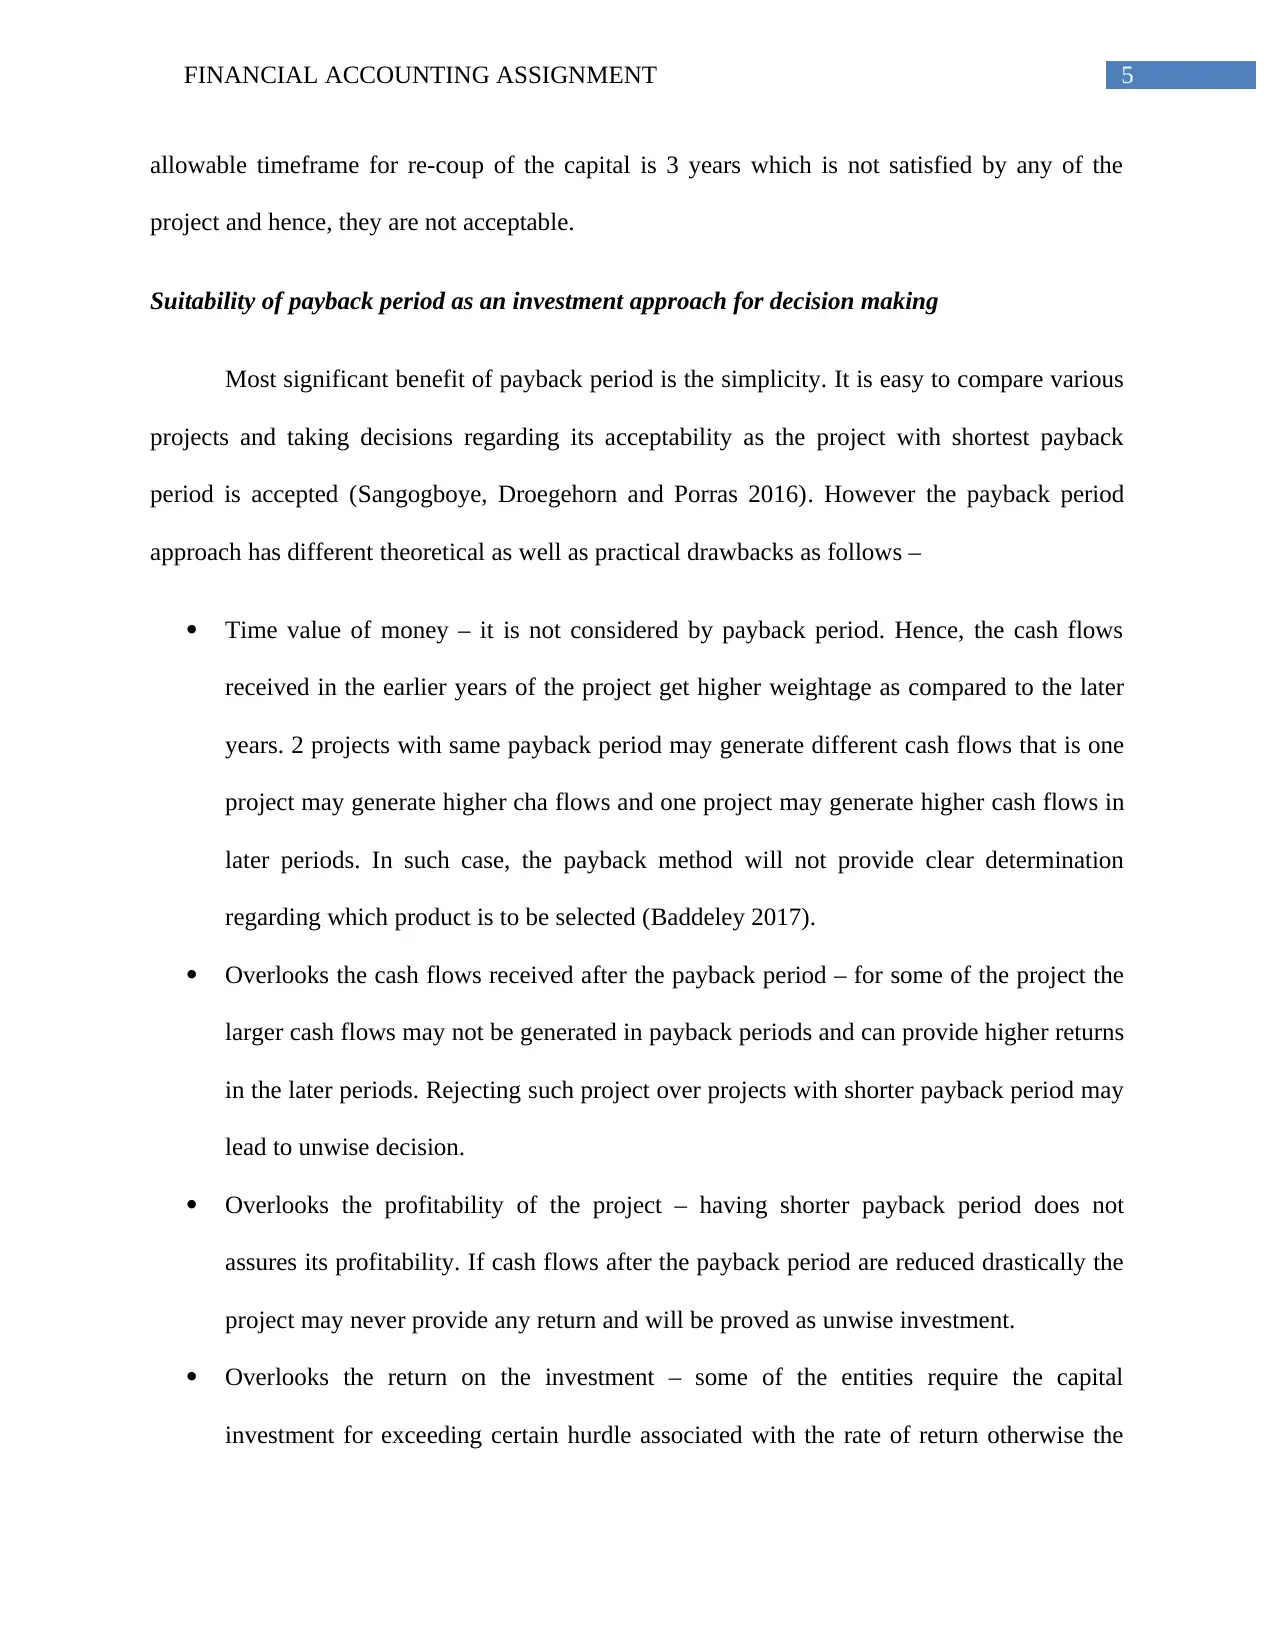
allowable timeframe for re-coup of the capital is 3 years which is not satisfied by any of the
project and hence, they are not acceptable.
Suitability of payback period as an investment approach for decision making
Most significant benefit of payback period is the simplicity. It is easy to compare various
projects and taking decisions regarding its acceptability as the project with shortest payback
period is accepted (Sangogboye, Droegehorn and Porras 2016). However the payback period
approach has different theoretical as well as practical drawbacks as follows –
Time value of money – it is not considered by payback period. Hence, the cash flows
received in the earlier years of the project get higher weightage as compared to the later
years. 2 projects with same payback period may generate different cash flows that is one
project may generate higher cha flows and one project may generate higher cash flows in
later periods. In such case, the payback method will not provide clear determination
regarding which product is to be selected (Baddeley 2017).
Overlooks the cash flows received after the payback period – for some of the project the
larger cash flows may not be generated in payback periods and can provide higher returns
in the later periods. Rejecting such project over projects with shorter payback period may
lead to unwise decision.
Overlooks the profitability of the project – having shorter payback period does not
assures its profitability. If cash flows after the payback period are reduced drastically the
project may never provide any return and will be proved as unwise investment.
Overlooks the return on the investment – some of the entities require the capital
investment for exceeding certain hurdle associated with the rate of return otherwise the
⊘ This is a preview!⊘
Do you want full access?
Subscribe today to unlock all pages.
Trusted by 1+ million students worldwide
6FINANCIAL ACCOUNTING ASSIGNMENT
project is rejected. Payback period however overlooks the rate of return (Venables, Laird
and Overman 2014).
Considering the above mentioned drawbacks, payback period is not considered as a
suitable approach in decision making.
(b) Accounting rate of return (ARR)
ARR is the rate of return that is ratio of the projected accounting profit of any project to
average investment that is made in the project. It is used as a technique for investment appraisal.
In other word, the ARR is arithmetic mean of the accounting income that is expected to be
generated during each of the year over the lifetime of the project. ARR focuses on the net income
of the project rather than concentrating on the cash flows. Generally ARR is measured as the
ratio of project’s annual average expected net income to the average investment. If ARR
considered as the sole criteria for accepting or rejecting any project the project is accepted if the
ARR is more that the required rate of return. Hence, if there are more than one projects those are
mutually exclusive the project with higher ARR is accepted (Braun et al. 2014).
Looking into the ARR of both Project A and Project B it can be stated that both the
projects have ARR of more than required rate of return that is 10%. However, if any project is to
be selected, Project A shall be chosen against Project B as the ARR of Project A is 18.75%
whereas the ARR of Project B is 12.15%.
Implications of assessing projects with ARR approach
Various advantages associated with ARR approach are as follows –
Paraphrase This Document
Need a fresh take? Get an instant paraphrase of this document with our AI Paraphraser
7FINANCIAL ACCOUNTING ASSIGNMENT
Comparison – ARR approach assists in comparing the new projects with the cost
effective projects or with the other competitive projects
Easier in computing – this approach is easier in understanding and computing the
payback period. It further considers the savings or profits taking place over the entire
financial span of the project (Brief and Lawson 2014).
Clear view regarding profitability – it provides clear view regarding profitability for any
particular project. Further it presents perception of the net earnings that is the earnings
after depreciation and tax payments
Satisfies the interests of the owner – owners are interested in returns of their investments
and hence, this approach helps in satisfying the interests of the owner with regard to the
investment returns (Kramná 2014).
Accounting profit – this approach considers the concept for accounting profit. Profit here
can be determined through computing return rates. Accounting profit can be computed
easily with the assistance of accounting records.
Measuring current performance – this approach is useful while measuring the firm’s
present performance.
However, ARR approach has some of the disadvantages as follows –
Ignores time factor and external factors – this approach overlooks the time factor while
selecting the alternate use of the fund. Further, this method does not take into account the
external factors that hamper the profit earning capability of the project.
Decision making issues – people generate different results if return on investment and
ARR are separately computed (Brotherson et al. 2014).
8FINANCIAL ACCOUNTING ASSIGNMENT
It considers only accounting profits – it does not takes into consideration the cash inflow
and focuses only on accounting profits.
Hence, if ARR is considered as the sole approach for analyzing the acceptability of a
project it will not be appropriate as it overlooks the time value of money which is an important
aspect (Rich and Rose 2014).
(c) Discounting technique and net present value
Advantages of using the discounting technique
The discounting technique is crucial for professional toolbox. It allows the analyst to
express the investment as the single number that is equivalent to the cash value for today.
Analysts, investors and the corporate managers uses the discounting techniques to all type of
investments like bonds, stocks and businesses including the expansions and acquisitions
(Gorshkov et al. 2014). Some of the recognized advantages of discounting technique are as
follows –
Major advantage of discounting technique is it reduces the investment into single figure.
If net present value of the project is positive, investment is expected to generate income
and in contrary if it’s negative the project is expected to wash out the money. This
enables down or up decisions regarding individual investment. Further, it allows to make
the choices between investments those are significantly different (Žižlavský 2014).
Reliability and accuracy – using the discounting technique for net present value is most
reliable and accurate approach for taking investment related decisions. provided that
estimate that goes into computation that is more or less correct no other approach are as
good for recognizing the investment that produces maximum value.
⊘ This is a preview!⊘
Do you want full access?
Subscribe today to unlock all pages.
Trusted by 1+ million students worldwide
9FINANCIAL ACCOUNTING ASSIGNMENT
Time factor – it gives importance to time factor which in turn makes adequate provision
for risk and uncertainty. Further it offers good measure for relative profitability of the
capital expenses through reducing earning to present value (Gallo 2014).
Net present value
NPV is the prominent technique used for analysis of financial project. It is equal to
present value of all the future cash flows of project reduced by initial investment made for the
project. It is considered as crucial as well as useful while taking the decisions associated with the
investment in the project, machinery or plant. NPV is present value of any asset. To be more
specific, NPV is the value that can be obtained through using the asset. Computation of NPV
requires 3 things including discounting rate, stream of the future cash outflows or inflows and
amount of initial investment (Leyman and Vanhoucke 2016). The analyst is required to discount
future cash flows through appropriate discounting rate and subtract the initial cash outflow from
entire discounted cash flows. It is used for determining whether the project or the investment is
worth accepting through comparing 2 things – total value of the future cash flows and initial
investment. NPV simply provides conclusion regarding a project’s acceptability that is whether
the project will generate earning for the shareholders or not if undertaken. It brings complicated
cash flows stream into simple weighing scale where it is easily known that which one is the
heavier. It is closely associated with capital budgeting. Capital budgeting requires extensive use
of the NPV technique. It is one of the major approach that is used under capital budgeting. It
cannot be denied that NPV is one of the best approaches to analyze the projects however final
decision regarding the project cannot be made based on this single approach as it is always better
option to look into the other sides of the dice (Gorshkov et al. 2018).
Paraphrase This Document
Need a fresh take? Get an instant paraphrase of this document with our AI Paraphraser
10FINANCIAL ACCOUNTING ASSIGNMENT
Looking into the NPV of both Project A and Project B it can be stated that both the
projects have negative NPV that is both the projects are not able to recover the amount of initial
investment. Hence, both the projects will wash out the money of the investor if undertake and
shall not be accepted. However, if any project is to be selected, Project A shall be chosen against
Project B as the NPV of Project A is – £ 32,668.88 whereas the NPV of Project B is – £
35,325.52.
(d) Profitability index (PI)
PI is the fraction which is equal to present value of the future cash flows divided by the
investment cost. Present value of the future cash flows means money that is expected to be
generated from investment. Here, the initial investment is the money put down for making the
money. PI provides 3 possible outcomes – 1st one is the number is less than one where the
investment shall be avoided as it signifies that the investment will cost more as compared to the
amount it will generate. 2nd outcome is the number is equal to one where the investments will
break-even with the money that will be generated by the project. Most desirable situation is to
have the outcome of more than one where the investment is lower as compared to the amount of
money generated by the project. It helps the investors to understand expected strength of the
return as compared to initial investment. PI is computed through dividing present value of the
future cash flows that is anticipated to be generated by capital project through initial investment
of project. Initial investment here is the required cash flow at the beginning of project. Future
cash flows here do not include initial amount of investment. Generally the PI is used for ranking
the investment of a firm or project (Pless et al. 2016). As the entities usually have financial
resources in limited amount or are required to maximize the profits for the shareholders, they
generally invest in the project which seems to be most profitable. However, if numbers of
11FINANCIAL ACCOUNTING ASSIGNMENT
possible investment projects are there the entity has the option to use the PI for ranking the
projects from high to low and take the decision regarding which one offers greatest benefit.
Though some of the projects results into higher NPV, those projects may be asset over as they do
not symbolize most benefit use for the assets of the entity. It is noteworthy that the major issue of
using PI is that it does not enable the owner to take into account the project’s size. Using NPV
approach for analyzing the investment project may solve the issue. The time required by the
project and profitability shall also be considered (Pless et al. 2016).
In the given case, the managing director is allowed for the capital expenditure amounting
to £100,000 and the investment alternatives can be implemented in the tiered states and are not
mutually-exclusive. Initial investment required for Project A is £85,000 and for Project B is
£60,000. Hence, both the projects require capital expenses of less than £100,000 and hence, the
managing director is in the position of investing in both the projects alternatively with the
allowable capital expenditure limit. However, looking into the PI of both Project A and Project B
it can be stated that both the projects have PI of less than 1 that is the investment shall be avoided
as it signifies that the investment will cost more as compared to the amount it will generate.
Hence, both the projects will wash out the money of the investor if undertaken and shall not be
accepted. However, if any project is to be selected, Project A shall be chosen against Project B as
the PI of Project A is 0.62 whereas the PI of Project B is 0.29.
⊘ This is a preview!⊘
Do you want full access?
Subscribe today to unlock all pages.
Trusted by 1+ million students worldwide
1 out of 25
Related Documents


Your All-in-One AI-Powered Toolkit for Academic Success.
+13062052269
info@desklib.com
Available 24*7 on WhatsApp / Email
![[object Object]](/_next/static/media/star-bottom.7253800d.svg)
Unlock your academic potential
Copyright © 2020–2026 A2Z Services. All Rights Reserved. Developed and managed by ZUCOL.