Financial Accounting Report: Commonwealth Bank Analysis (2017-2018)

Verified

Added on  2023/06/07

|13
|1714
|361
Report
AI Summary
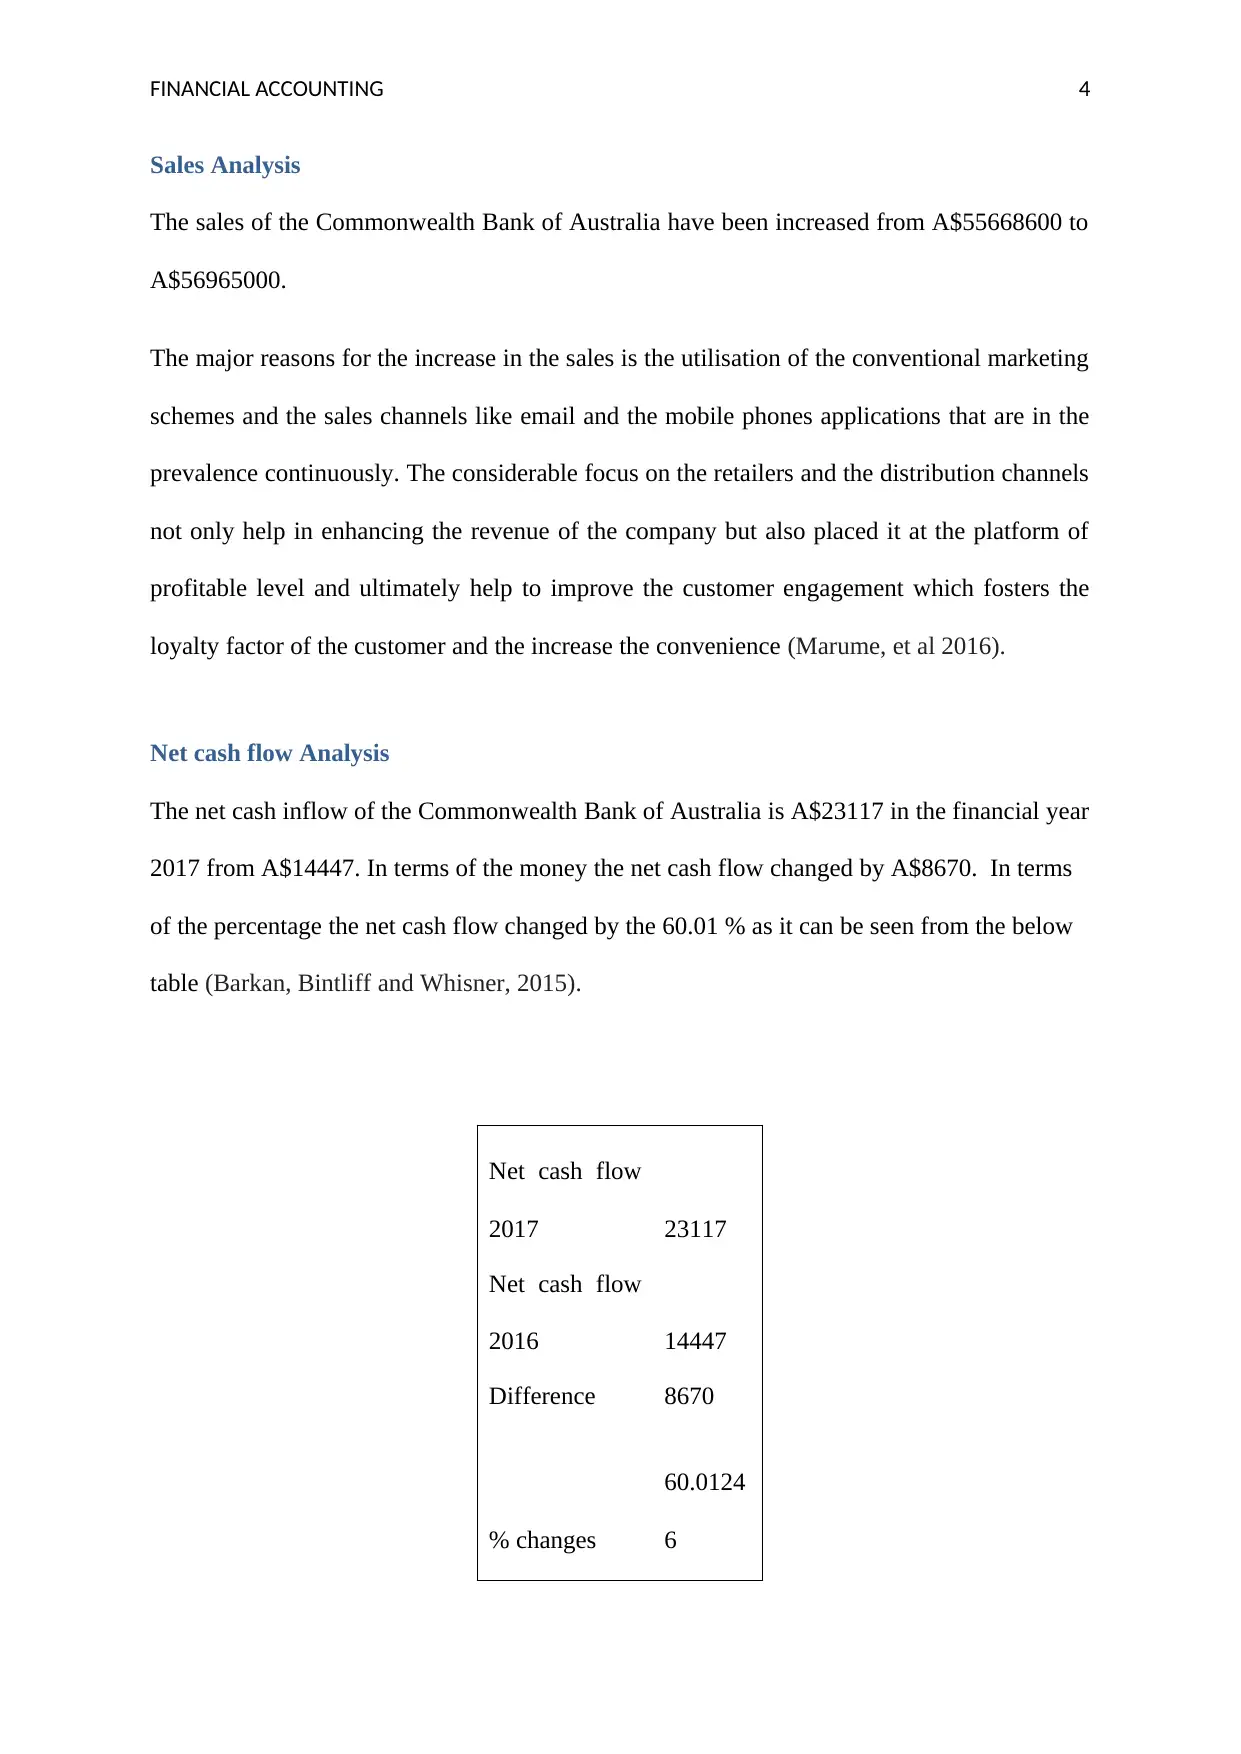
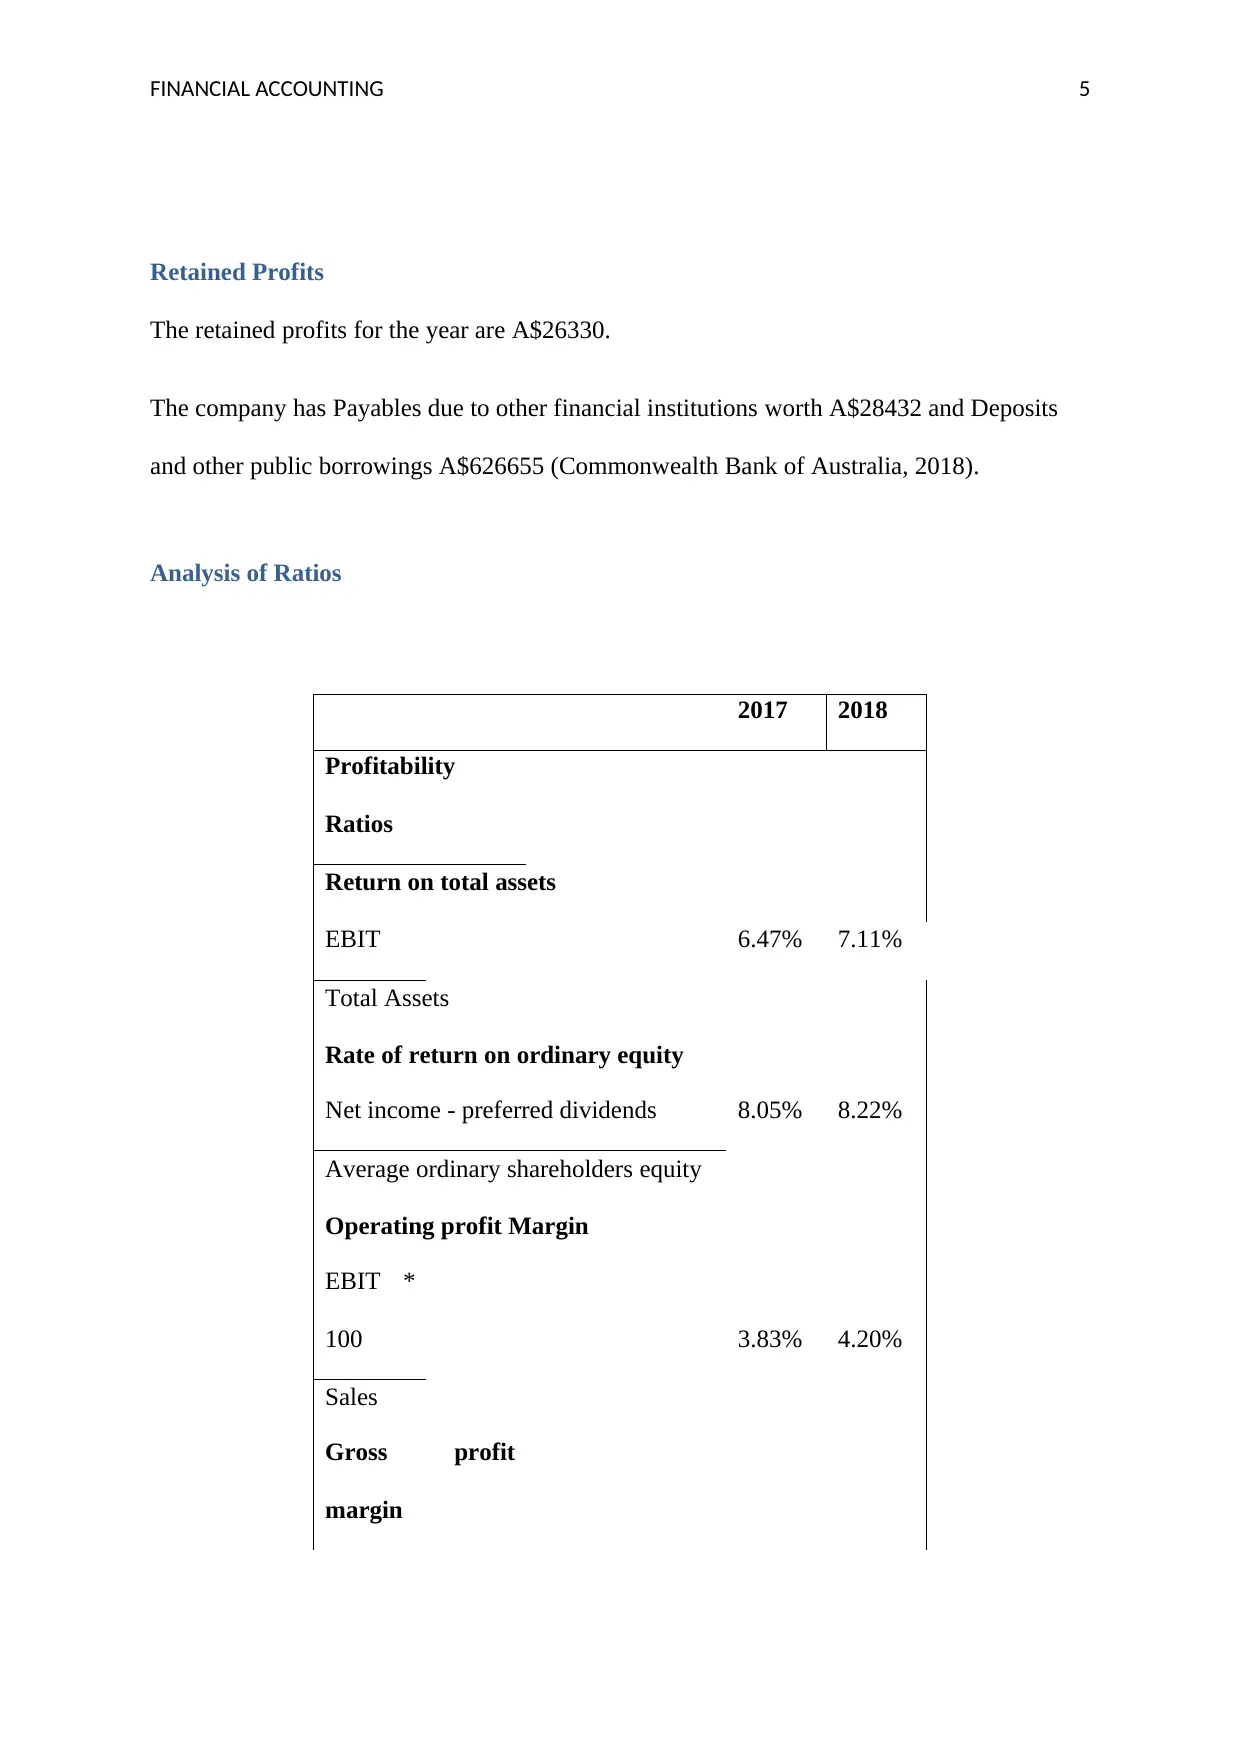
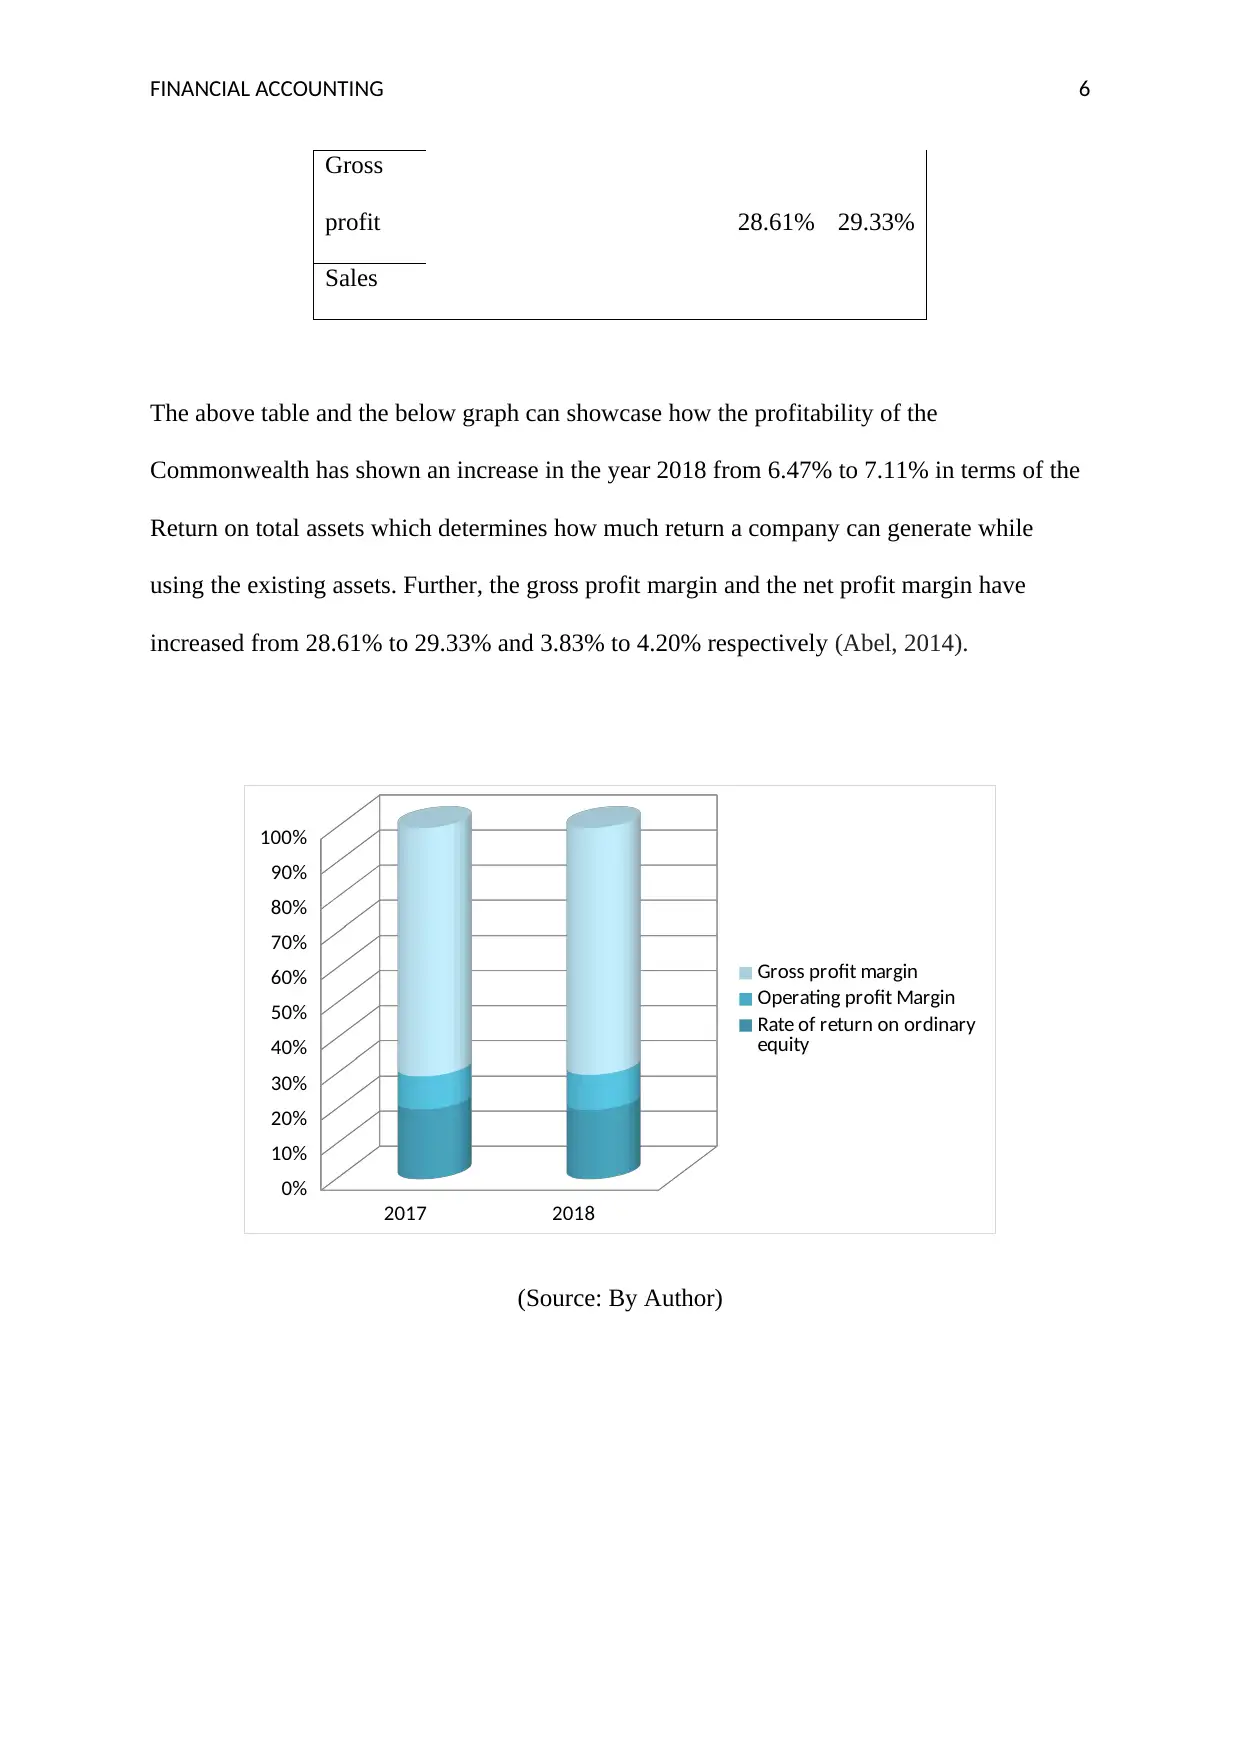
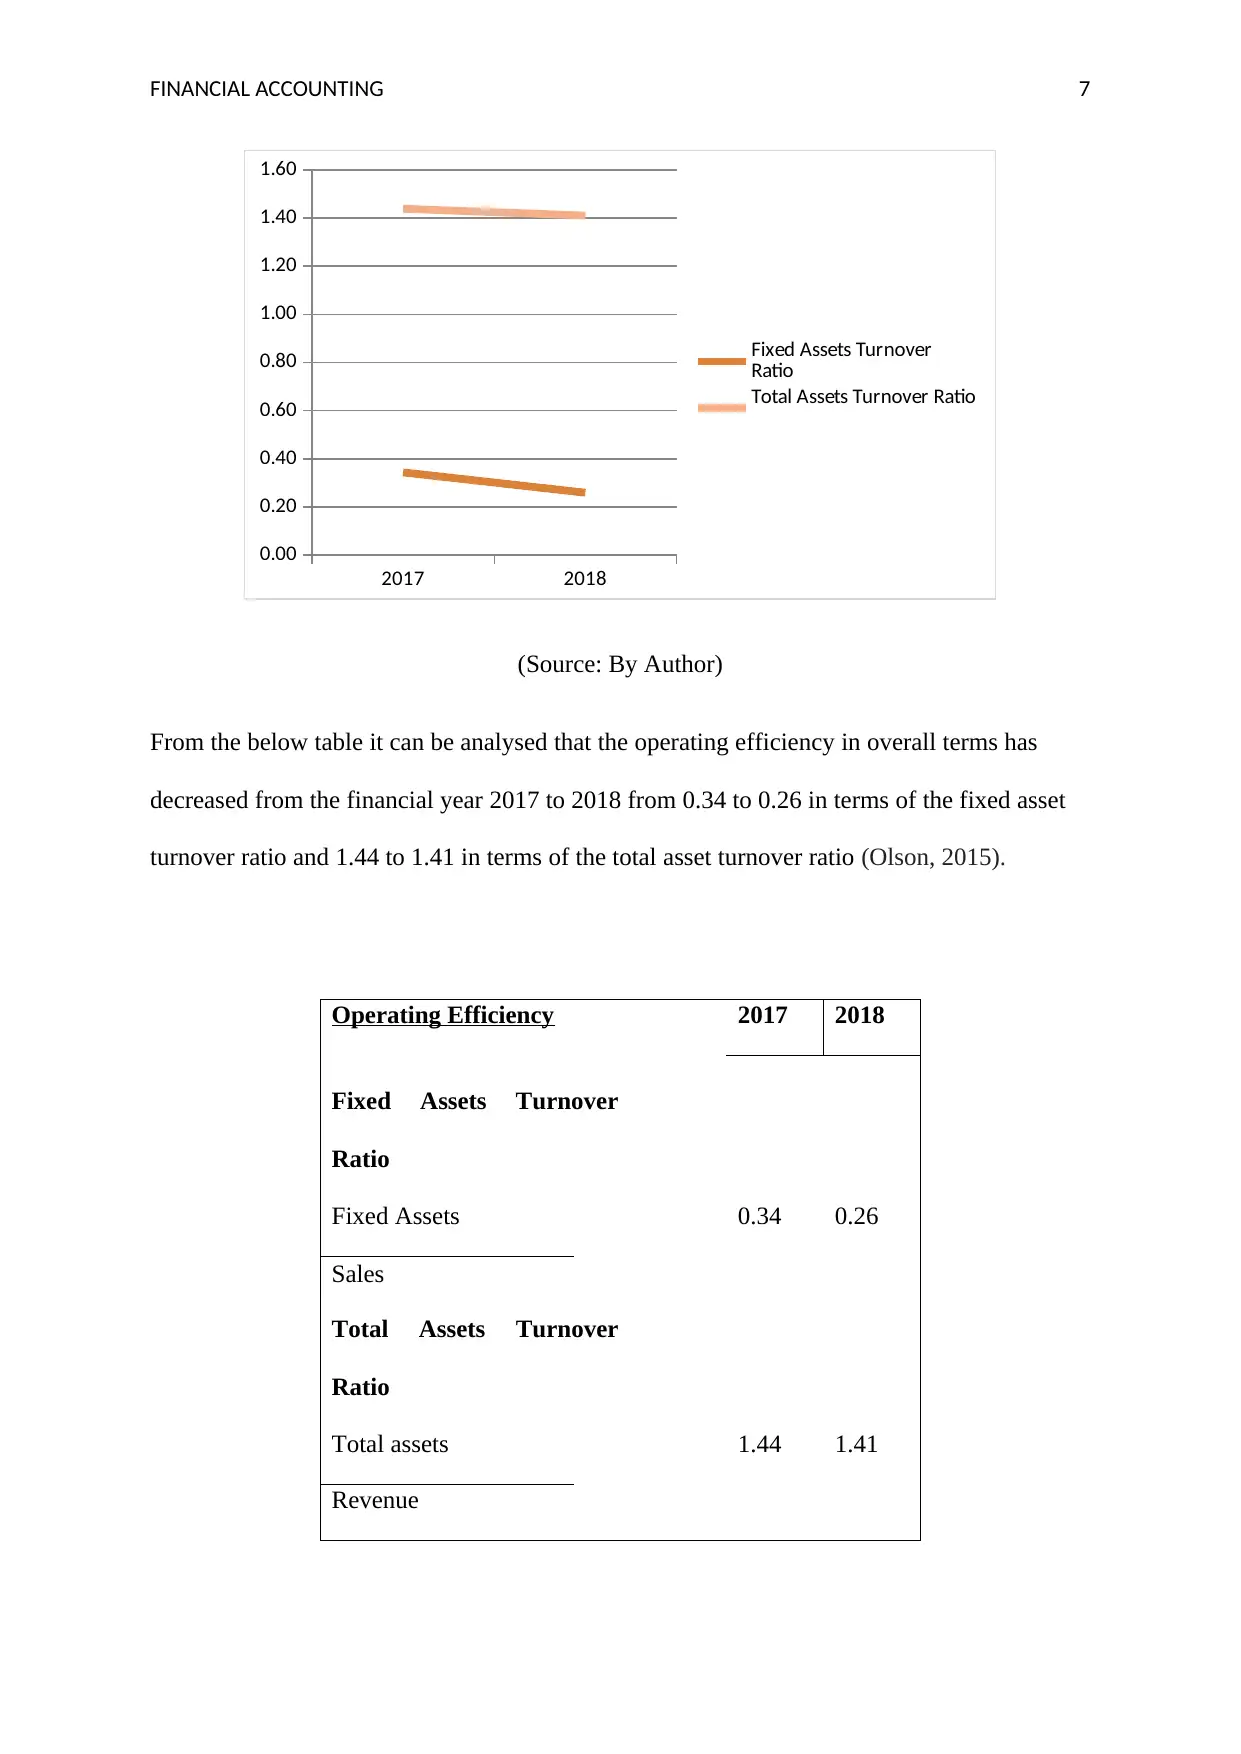
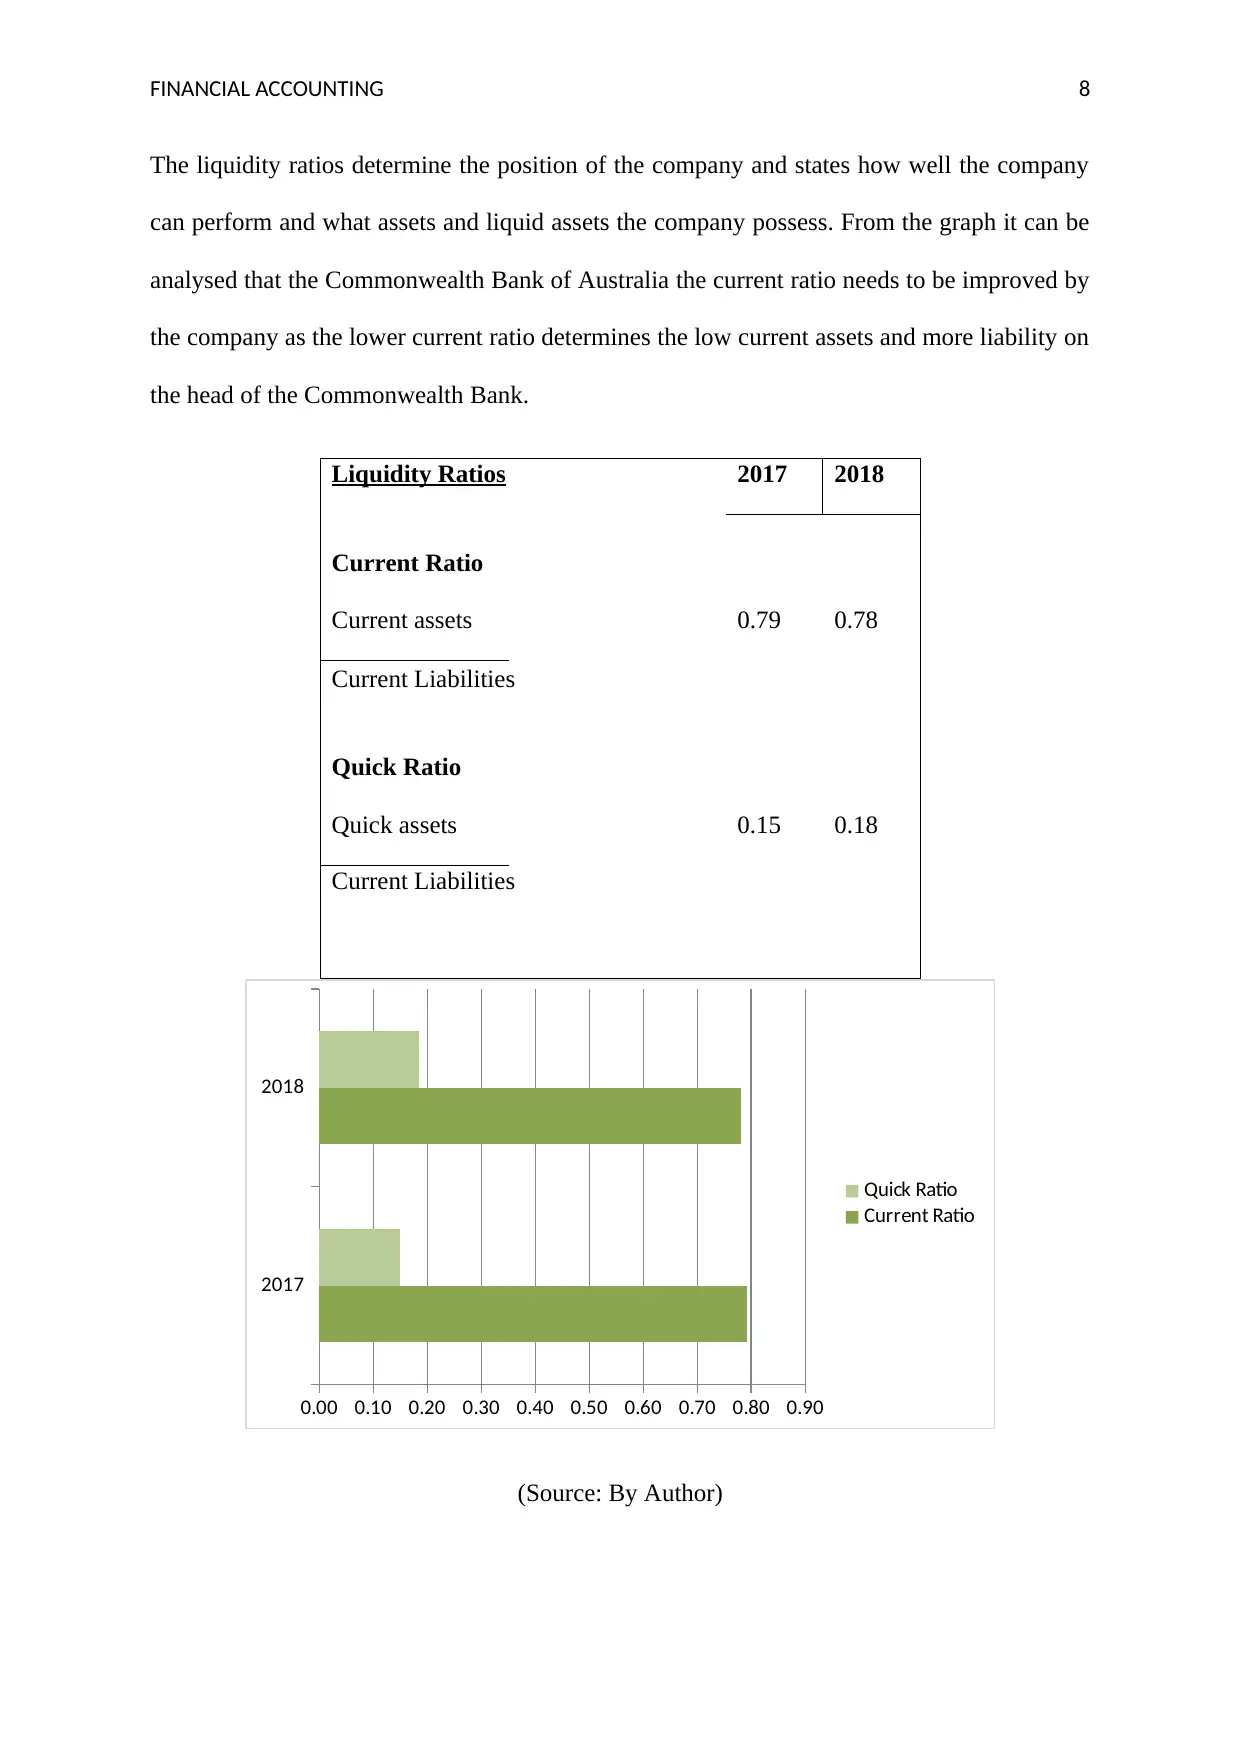
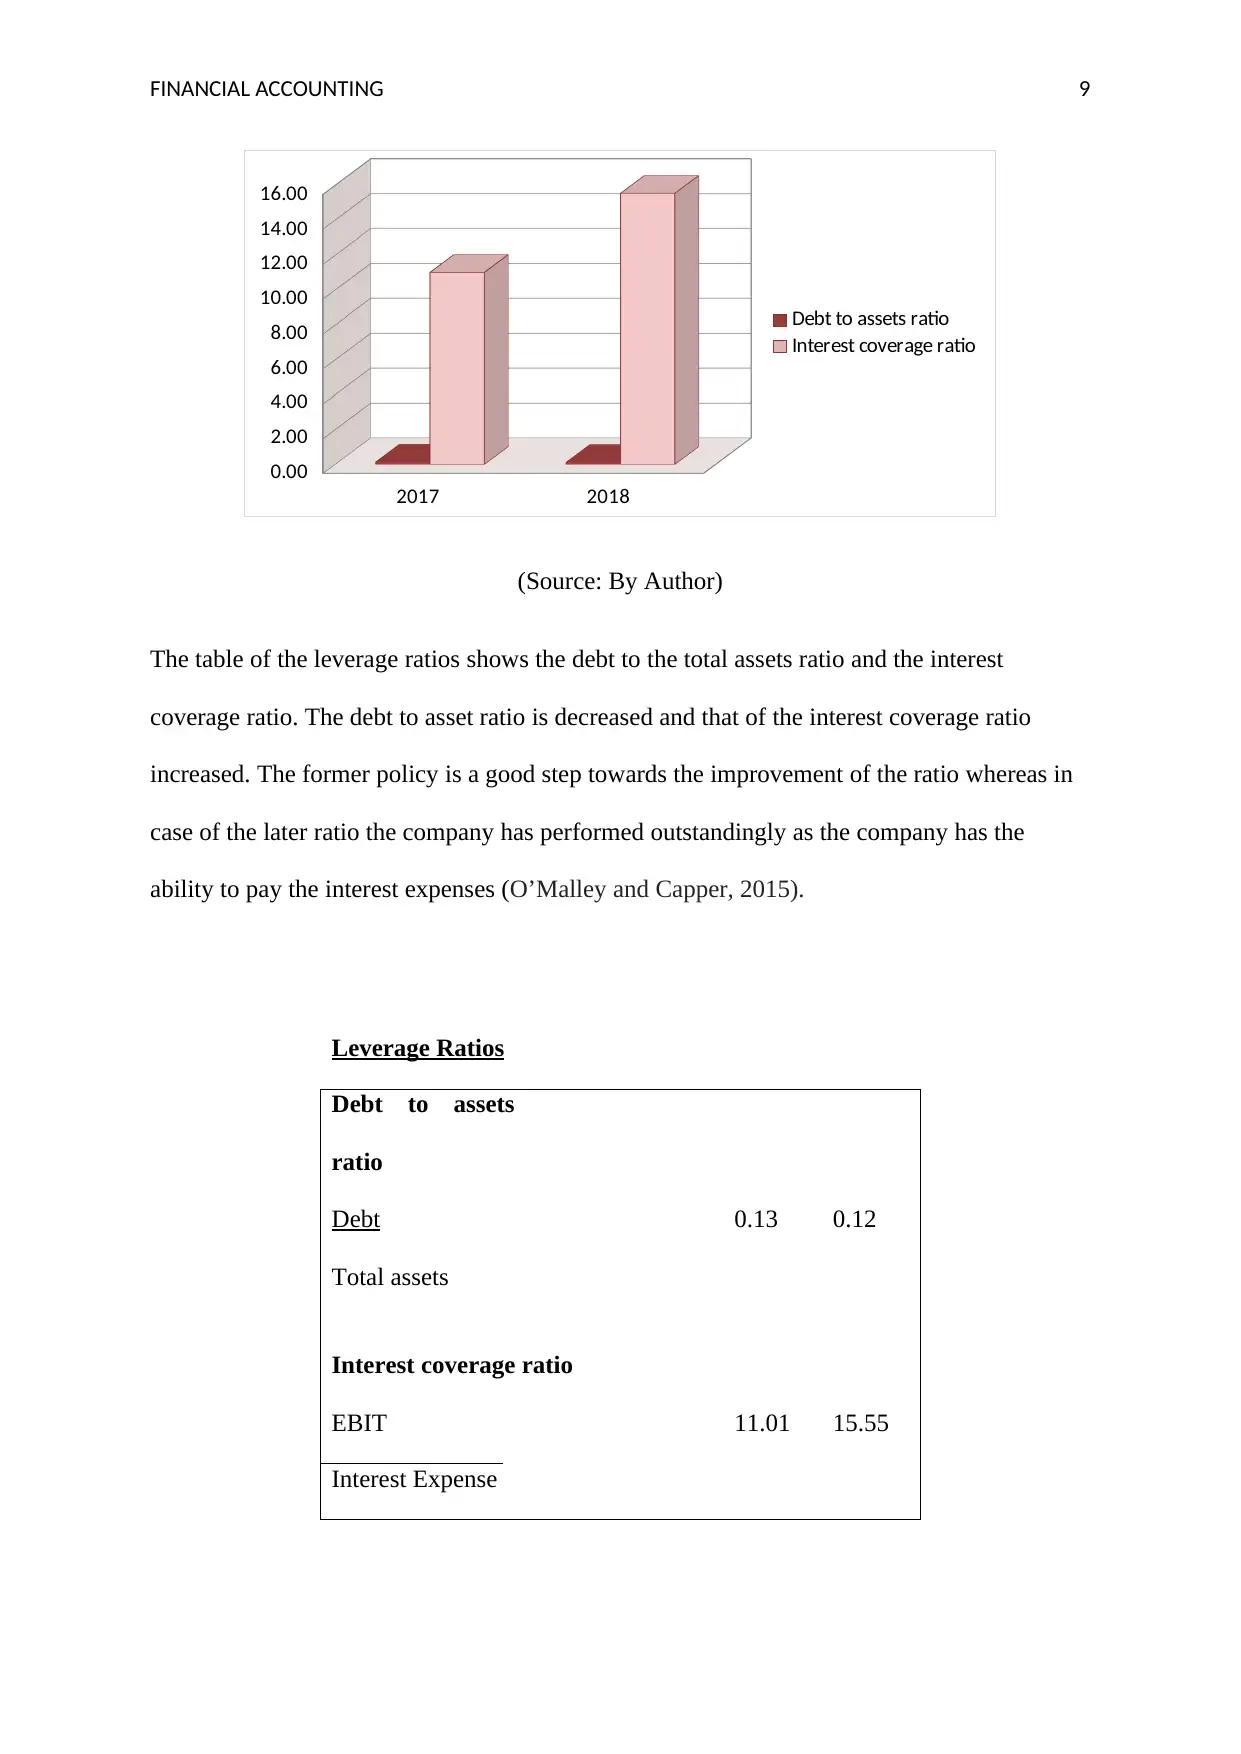
This financial accounting report analyzes the Commonwealth Bank of Australia's (CBA) financial performance for the years 2017 and 2018. The report examines key aspects of the bank's financial health, including sales analysis, net cash flow, and retained profits. It delves into profitability ratios (return on assets, gross profit margin), operating efficiency (fixed and total asset turnover), liquidity ratios (current and quick ratios), and leverage ratios (debt to assets, interest coverage). The analysis highlights trends, such as increasing sales and net cash flow, while also pointing out areas needing improvement, like the decreasing fixed asset turnover ratio and the need to improve the current ratio. The report concludes with a summary of the bank's financial standing and recommendations for future improvements in financial health. The report uses the annual reports of the bank and provides a comparative analysis of the financial performance of the bank across the years 2017 and 2018.
Document Page
Running Head: FINANCIAL ACCOUNTING 0
Financial Accounting
tabler-icon-diamond-filled.svg

Paraphrase This Document

Need a fresh take? Get an instant paraphrase of this document with our AI Paraphraser
Document Page
FINANCIAL ACCOUNTING 1
Table of Contents
Introduction................................................................................................................................2
Dominant Section.......................................................................................................................2
Director’s Report........................................................................................................................2
Auditor’s Report.........................................................................................................................3
The auditors of the Commonwealth Bank of Australia are the Price Waterhouse and Cooper’s
firm.............................................................................................................................................3
Summary.................................................................................................................................3
Sales Analysis............................................................................................................................3
Net cash flow Analysis...............................................................................................................4
Retained Profits..........................................................................................................................4
Analysis of Ratios......................................................................................................................4
References..................................................................................................................................9
Document Page
FINANCIAL ACCOUNTING 2
Introduction
Commonwealth bank of Australia is an Australian multinational manage an account with
organizations crosswise over New Zealand, Asia, the United States and the United Kingdom.
The assortment of the budgetary administrations are given by the bank, for example, retail,
business and institutional keeping money, administration of assets and superannuation, office
of the protection a venture and broking administrations. The bank was subsidized in the
December 1911, having central station at Darling harbor, Sydney and Australia. The present
income of the bank is $26.004 billion. The bank was recorded on the stock trade in the year
1991 (Commonwealth Bank, 2014).
Dominant Section
The most dominant section of the report is the sustainability and the CSR policies which are
followed by the Commonwealth bank of Australia and the financial statements which reflect
the financial position of the company in comparison to its previous year and therefore, these
two areas rule the entire annual report. However the director’s report and the auditor’s report
are also beneficial from the point of view of the stakeholders and the investors (Abbott,
2018).
Director’s Report
The director’s report is basically divided into the different major sections which determine
the principal activities, consolidated profit, dividends and review of the operations.
Furthermore, the director’s report also talks about the changes in the state of affairs and the
environmental reporting and also throws the light on the business strategies and the future
developments (Brzezinski, 2016).
Document Page
FINANCIAL ACCOUNTING 3
The major Directors of the Commonwealth Bank of Australia are outlined below
Catherine Livingstone, who was appointed on January 1st 2017, Ian Narev the chief
executive, Shirish Apte, Sir David Higgins and Launa Inman the futher board of the directors
(Commonwealth Bank, 2014).
Auditor’s Report
The auditors of the Commonwealth Bank of Australia are the Price Waterhouse and Cooper’s
firm.
In the opinion of the auditor and to the best of their knowledge and belief, according to the
PWC in the position of the auditor believes to have
a) No problems in terms of the independence of the auditor under the Corporations Act
2001 in the motion of the audit and
b) No contravention of the codes and the ethics of the professional conduct in
association of the audit (Leyland, 2016).
Summary
The Auditors report determines the view of the auditor on the fact that the company has
complied with all the necessary accounting standards which needs to be implemented and
followed correctly and that the financial statements are in accordance with the schedules and
the accounting policy.
tabler-icon-diamond-filled.svg

Paraphrase This Document

Need a fresh take? Get an instant paraphrase of this document with our AI Paraphraser
Document Page
FINANCIAL ACCOUNTING 4
Sales Analysis
The sales of the Commonwealth Bank of Australia have been increased from A$55668600 to
A$56965000.
The major reasons for the increase in the sales is the utilisation of the conventional marketing
schemes and the sales channels like email and the mobile phones applications that are in the
prevalence continuously. The considerable focus on the retailers and the distribution channels
not only help in enhancing the revenue of the company but also placed it at the platform of
profitable level and ultimately help to improve the customer engagement which fosters the
loyalty factor of the customer and the increase the convenience (Marume, et al 2016).
Net cash flow Analysis
The net cash inflow of the Commonwealth Bank of Australia is A$23117 in the financial year
2017 from A$14447. In terms of the money the net cash flow changed by A$8670. In terms
of the percentage the net cash flow changed by the 60.01 % as it can be seen from the below
table (Barkan, Bintliff and Whisner, 2015).
Net cash flow
2017 23117
Net cash flow
2016 14447
Difference 8670
% changes
60.0124
6
Document Page
FINANCIAL ACCOUNTING 5
Retained Profits
The retained profits for the year are A$26330.
The company has Payables due to other financial institutions worth A$28432 and Deposits
and other public borrowings A$626655 (Commonwealth Bank of Australia, 2018).
Analysis of Ratios
2017 2018
Profitability
Ratios
Return on total assets
EBIT 6.47% 7.11%
Total Assets
Rate of return on ordinary equity
Net income - preferred dividends 8.05% 8.22%
Average ordinary shareholders equity
Operating profit Margin
EBIT *
100 3.83% 4.20%
Sales
Gross profit
margin
Document Page
FINANCIAL ACCOUNTING 6
Gross
profit 28.61% 29.33%
Sales
The above table and the below graph can showcase how the profitability of the
Commonwealth has shown an increase in the year 2018 from 6.47% to 7.11% in terms of the
Return on total assets which determines how much return a company can generate while
using the existing assets. Further, the gross profit margin and the net profit margin have
increased from 28.61% to 29.33% and 3.83% to 4.20% respectively (Abel, 2014).
2017 2018
0%
10%
20%
30%
40%
50%
60%
70%
80%
90%
100%
Gross profit margin
Operating profit Margin
Rate of return on ordinary
equity
(Source: By Author)
tabler-icon-diamond-filled.svg

Paraphrase This Document

Need a fresh take? Get an instant paraphrase of this document with our AI Paraphraser
Document Page
FINANCIAL ACCOUNTING 7
2017 2018
0.00
0.20
0.40
0.60
0.80
1.00
1.20
1.40
1.60
Fixed Assets Turnover
Ratio
Total Assets Turnover Ratio
(Source: By Author)
From the below table it can be analysed that the operating efficiency in overall terms has
decreased from the financial year 2017 to 2018 from 0.34 to 0.26 in terms of the fixed asset
turnover ratio and 1.44 to 1.41 in terms of the total asset turnover ratio (Olson, 2015).
Operating Efficiency 2017 2018
Fixed Assets Turnover
Ratio
Fixed Assets 0.34 0.26
Sales
Total Assets Turnover
Ratio
Total assets 1.44 1.41
Revenue
Document Page
FINANCIAL ACCOUNTING 8
The liquidity ratios determine the position of the company and states how well the company
can perform and what assets and liquid assets the company possess. From the graph it can be
analysed that the Commonwealth Bank of Australia the current ratio needs to be improved by
the company as the lower current ratio determines the low current assets and more liability on
the head of the Commonwealth Bank.
Liquidity Ratios 2017 2018
Current Ratio
Current assets 0.79 0.78
Current Liabilities
Quick Ratio
Quick assets 0.15 0.18
Current Liabilities
2017
2018
0.00 0.10 0.20 0.30 0.40 0.50 0.60 0.70 0.80 0.90
Quick Ratio
Current Ratio
(Source: By Author)
Document Page
FINANCIAL ACCOUNTING 9
2017 2018
0.00
2.00
4.00
6.00
8.00
10.00
12.00
14.00
16.00
Debt to assets ratio
Interest coverage ratio
(Source: By Author)
The table of the leverage ratios shows the debt to the total assets ratio and the interest
coverage ratio. The debt to asset ratio is decreased and that of the interest coverage ratio
increased. The former policy is a good step towards the improvement of the ratio whereas in
case of the later ratio the company has performed outstandingly as the company has the
ability to pay the interest expenses (O’Malley and Capper, 2015).
Leverage Ratios
Debt to assets
ratio
Debt 0.13 0.12
Total assets
Interest coverage ratio
EBIT 11.01 15.55
Interest Expense
tabler-icon-diamond-filled.svg

Paraphrase This Document

Need a fresh take? Get an instant paraphrase of this document with our AI Paraphraser
Document Page
FINANCIAL ACCOUNTING 10
Conclusion
From the above analysis it can be concluded that the financial health of the company needs to
be improved. Though the sales of the company increased the operating cost also increased
and therefore the company needs to reduce the bar of costs. Moreover, the fixed assets
turnover ratio has decreased and therefore the company needs to purchase the assets to get
more capital benefits.
Document Page
FINANCIAL ACCOUNTING 11
References
Abbott, M., (2018) Markets and the State: Microeconomic Policy in Australia. California:
Routledge.
Abel, R.L. ed., (2014) The Politics of Informal Justice: Volume 2: Comparative Studies (Vol.
2). Netherlands: Elsevier.
Barkan, S.M., Bintliff, B. and Whisner, M., (2015) Fundamentals of legal research. United
States: John and Wiley sons.
Brzezinski, Z.K., (2016) Russia and the Commonwealth of Independent States: documents,
data, and analysis. Routledge.
Commonwealth Bank of Australia, (2018) Annual Report 2018[online] Available from
https://www.commbank.com.au/content/dam/commbank/about-us/shareholders/pdfs/annual-
reports/annual_report_2017_14_aug_2017.pdf [Accessed on 12th September 2018]
Commonwealth Bank, (2014) Our Strategy [online] Available from
https://www.commbank.com.au/content/commbank-neo/2014shareholderreview/
strategy.html [Accessed on 21st August 2018]
Leyland, P., (2016) The constitution of the United Kingdom: a contextual analysis. United
States: Bloomsbury Publishing.
Marume, S.B.M., Jubenkanda, R.R., Namusi, C.W. and Madziyire, N.C., (2016) The
Principles of natural justice in public administration and administrative law. New York:
Springer.
chevron_up_icon
1 out of 13
circle_padding
hide_on_mobile
zoom_out_icon
[object Object]