Comprehensive Report on Accounting and Finance Principles
VerifiedAdded on 2020/11/23
|16
|3672
|316
Report
AI Summary
This report provides a comprehensive overview of accounting and finance principles, covering various fundamental models and techniques relevant to financial and management accounting. It includes an income statement and statement of financial position. The report delves into break-even analysis, calculating the break-even point and margin of safety. It assesses the impact of a marketing strategy on profitability, and explains the underpinning assumptions of the break-even model. Furthermore, the report calculates the payback period, accounting rate of return, and net present value, discussing investment appraisal techniques and the role of budgets in strategic planning. The analysis includes calculations and interpretations, evaluating the financial health and strategic decisions of Clarkenpark Ltd.

INTRODUCTION TO
ACCOUNTING AND
FINANCE
ACCOUNTING AND
FINANCE
Paraphrase This Document
Need a fresh take? Get an instant paraphrase of this document with our AI Paraphraser
TABLE OF CONTENTS
INTRODUCTION...........................................................................................................................1
PART A...........................................................................................................................................1
Income statement for the year ended 2017.............................................................................1
Statement of financial position...............................................................................................2
PART B............................................................................................................................................2
A.) Explaining contribution that each shelf makes towards covering fixed cost if it is sold for
£13 .........................................................................................................................................2
B.) Calculation of break-even point and margin of safety.....................................................3
c.) Calculation of the profit....................................................................................................4
D.) Analysing good strategy for Clarkenpark Ltd..................................................................5
E.) Explaining underpinning assumptions which is attached to break-even model...............6
PART C............................................................................................................................................7
A.) Calculation of payback period, accounting rate of return and net present value.............7
b.) Investment appraisal techniques:....................................................................................10
c. Budget as a tool for strategic planning.............................................................................12
CONCLUSION..............................................................................................................................13
REFERENCES..............................................................................................................................15
INTRODUCTION
Accounting can be defined as a system with the help of which accountant delivers all the
financial informations of the company. On the other hand, finance refers to a system which is
concerned with dealing with cost, assets, and liabilities of the company as to enable the company
in having better management of them. The present report provides a brief information about
various fundamental models and techniques of financial accounting and management accounting
that need to be comply by a business. The report provides a detailed explanation of the
advantages and limitations of the various investment appraisal techniques. Further, it also
provides key merits and demerits of budgets being a tool of the strategic planning. In addition,
the study also shows some calculations relating to the NRR and NPV methods of financial
accounting system.
PART A
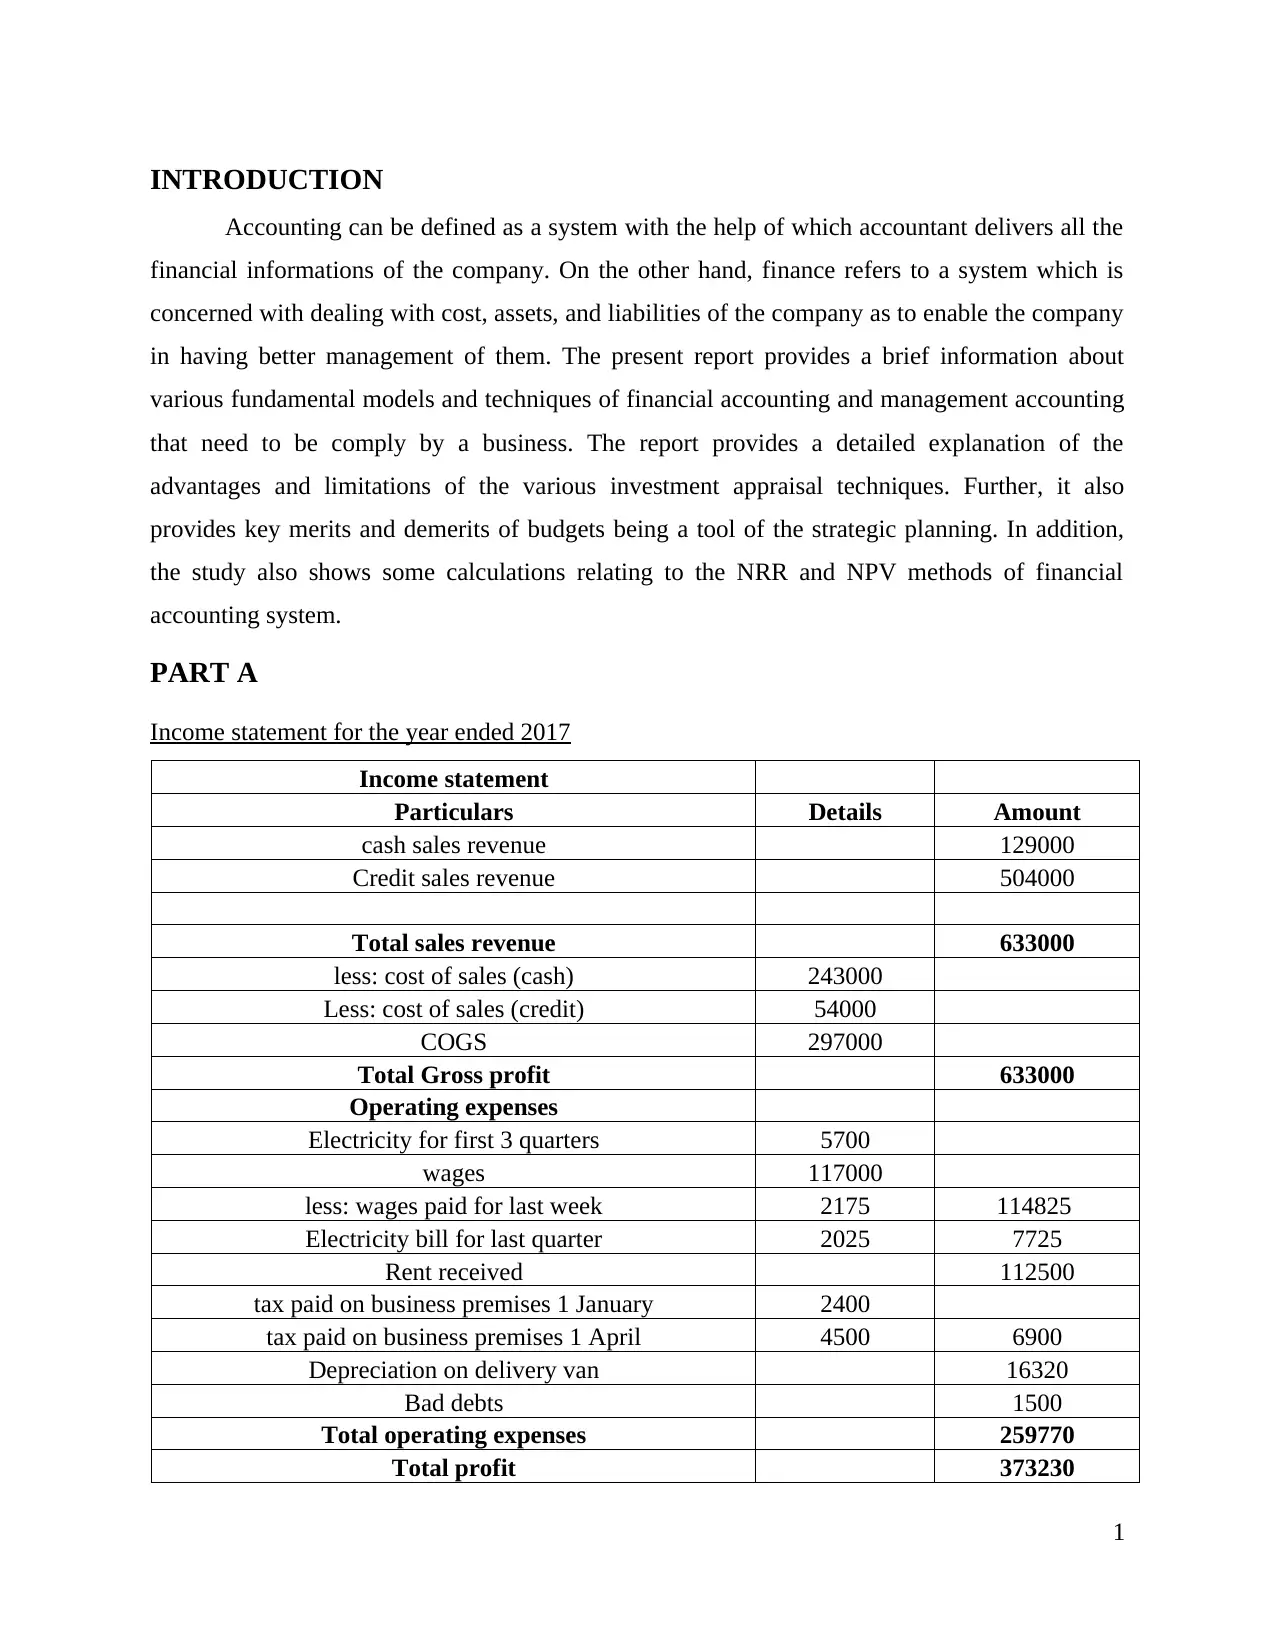
Income statement for the year ended 2017
Income statement
Particulars Details Amount
cash sales revenue 129000
Credit sales revenue 504000
Total sales revenue 633000
less: cost of sales (cash) 243000
Less: cost of sales (credit) 54000
COGS 297000
Total Gross profit 633000
Operating expenses
Electricity for first 3 quarters 5700
wages 117000
less: wages paid for last week 2175 114825
Electricity bill for last quarter 2025 7725
Rent received 112500
tax paid on business premises 1 January 2400
tax paid on business premises 1 April 4500 6900
Depreciation on delivery van 16320
Bad debts 1500
Total operating expenses 259770
Total profit 373230
1
Accounting can be defined as a system with the help of which accountant delivers all the
financial informations of the company. On the other hand, finance refers to a system which is
concerned with dealing with cost, assets, and liabilities of the company as to enable the company
in having better management of them. The present report provides a brief information about
various fundamental models and techniques of financial accounting and management accounting
that need to be comply by a business. The report provides a detailed explanation of the
advantages and limitations of the various investment appraisal techniques. Further, it also
provides key merits and demerits of budgets being a tool of the strategic planning. In addition,
the study also shows some calculations relating to the NRR and NPV methods of financial
accounting system.
PART A
Income statement for the year ended 2017
Income statement
Particulars Details Amount
cash sales revenue 129000
Credit sales revenue 504000
Total sales revenue 633000
less: cost of sales (cash) 243000
Less: cost of sales (credit) 54000
COGS 297000
Total Gross profit 633000
Operating expenses
Electricity for first 3 quarters 5700
wages 117000
less: wages paid for last week 2175 114825
Electricity bill for last quarter 2025 7725
Rent received 112500
tax paid on business premises 1 January 2400
tax paid on business premises 1 April 4500 6900
Depreciation on delivery van 16320
Bad debts 1500
Total operating expenses 259770
Total profit 373230
1
⊘ This is a preview!⊘
Do you want full access?
Subscribe today to unlock all pages.
Trusted by 1+ million students worldwide
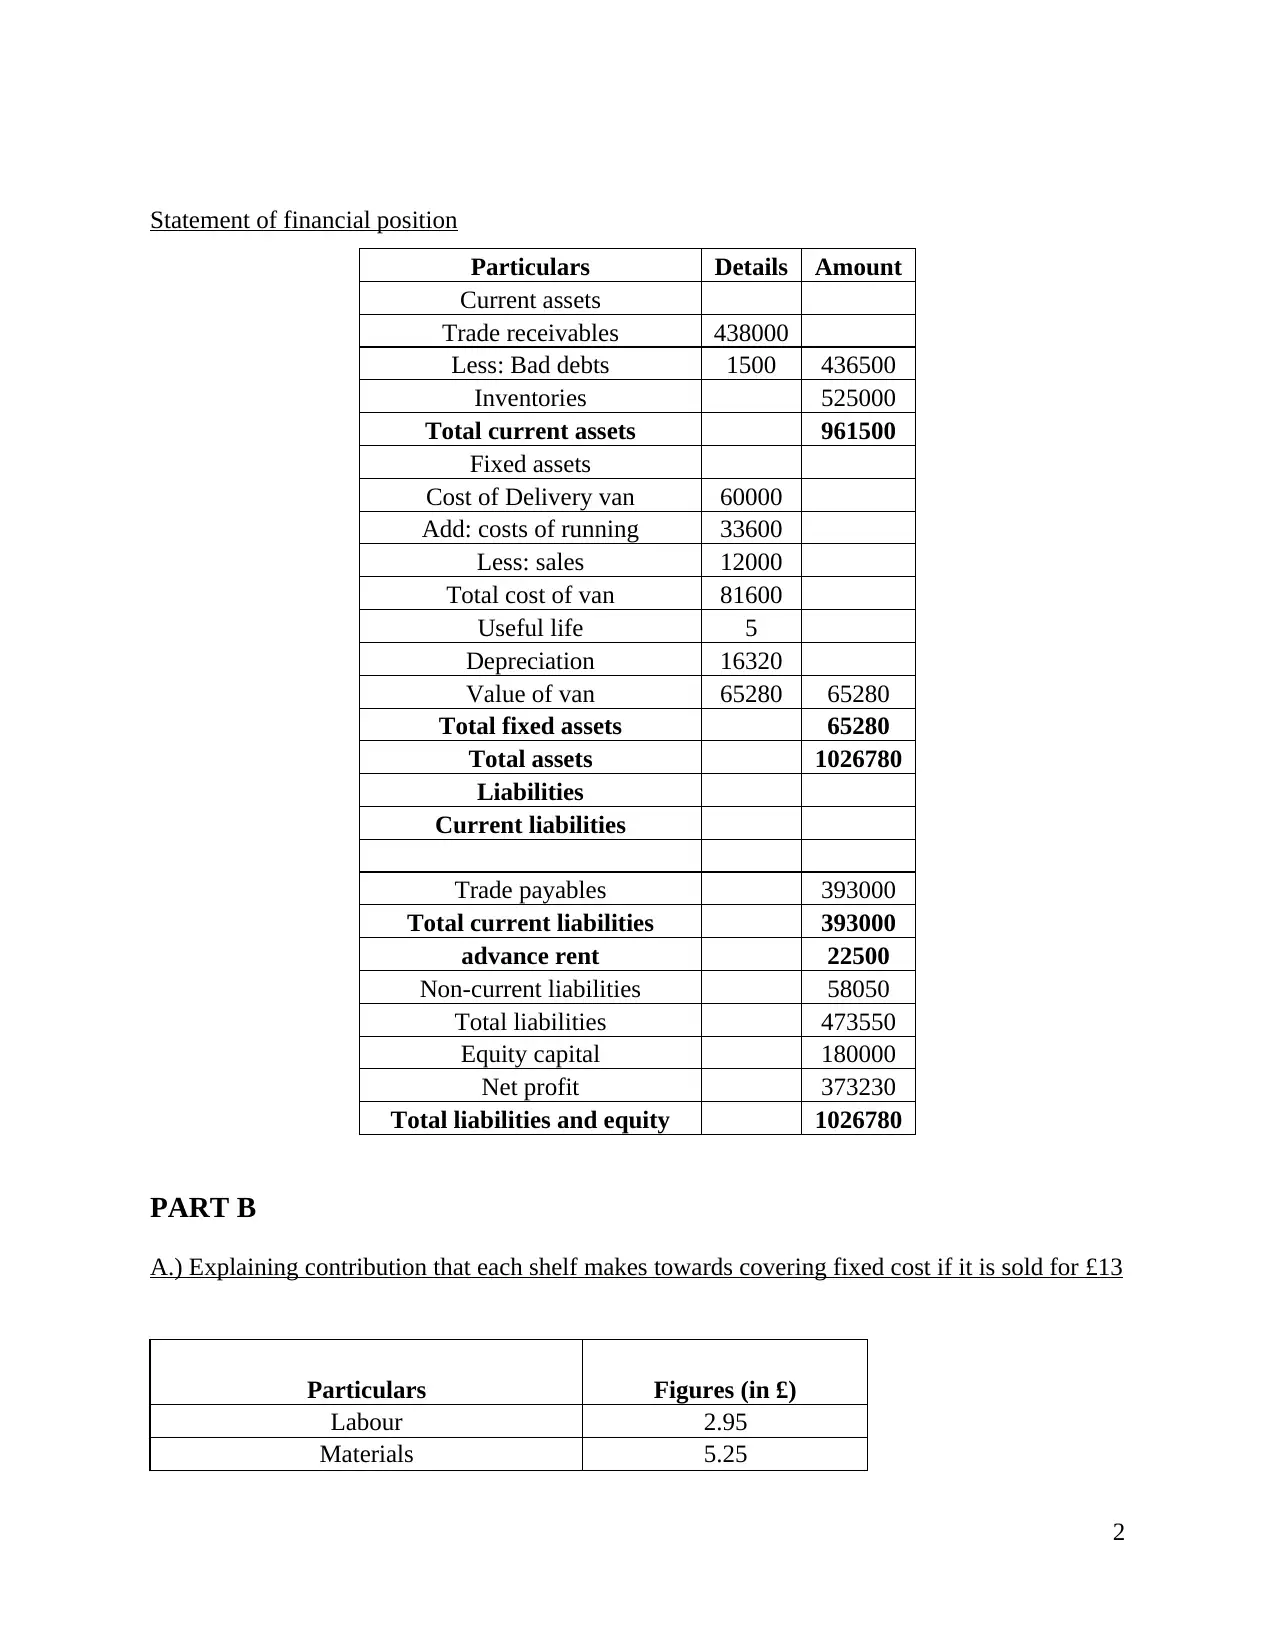
Statement of financial position
Particulars Details Amount
Current assets
Trade receivables 438000
Less: Bad debts 1500 436500
Inventories 525000
Total current assets 961500
Fixed assets
Cost of Delivery van 60000
Add: costs of running 33600
Less: sales 12000
Total cost of van 81600
Useful life 5
Depreciation 16320
Value of van 65280 65280
Total fixed assets 65280
Total assets 1026780
Liabilities
Current liabilities
Trade payables 393000
Total current liabilities 393000
advance rent 22500
Non-current liabilities 58050
Total liabilities 473550
Equity capital 180000
Net profit 373230
Total liabilities and equity 1026780
PART B
A.) Explaining contribution that each shelf makes towards covering fixed cost if it is sold for £13
Particulars Figures (in £)
Labour 2.95
Materials 5.25
2
Paraphrase This Document
Need a fresh take? Get an instant paraphrase of this document with our AI Paraphraser
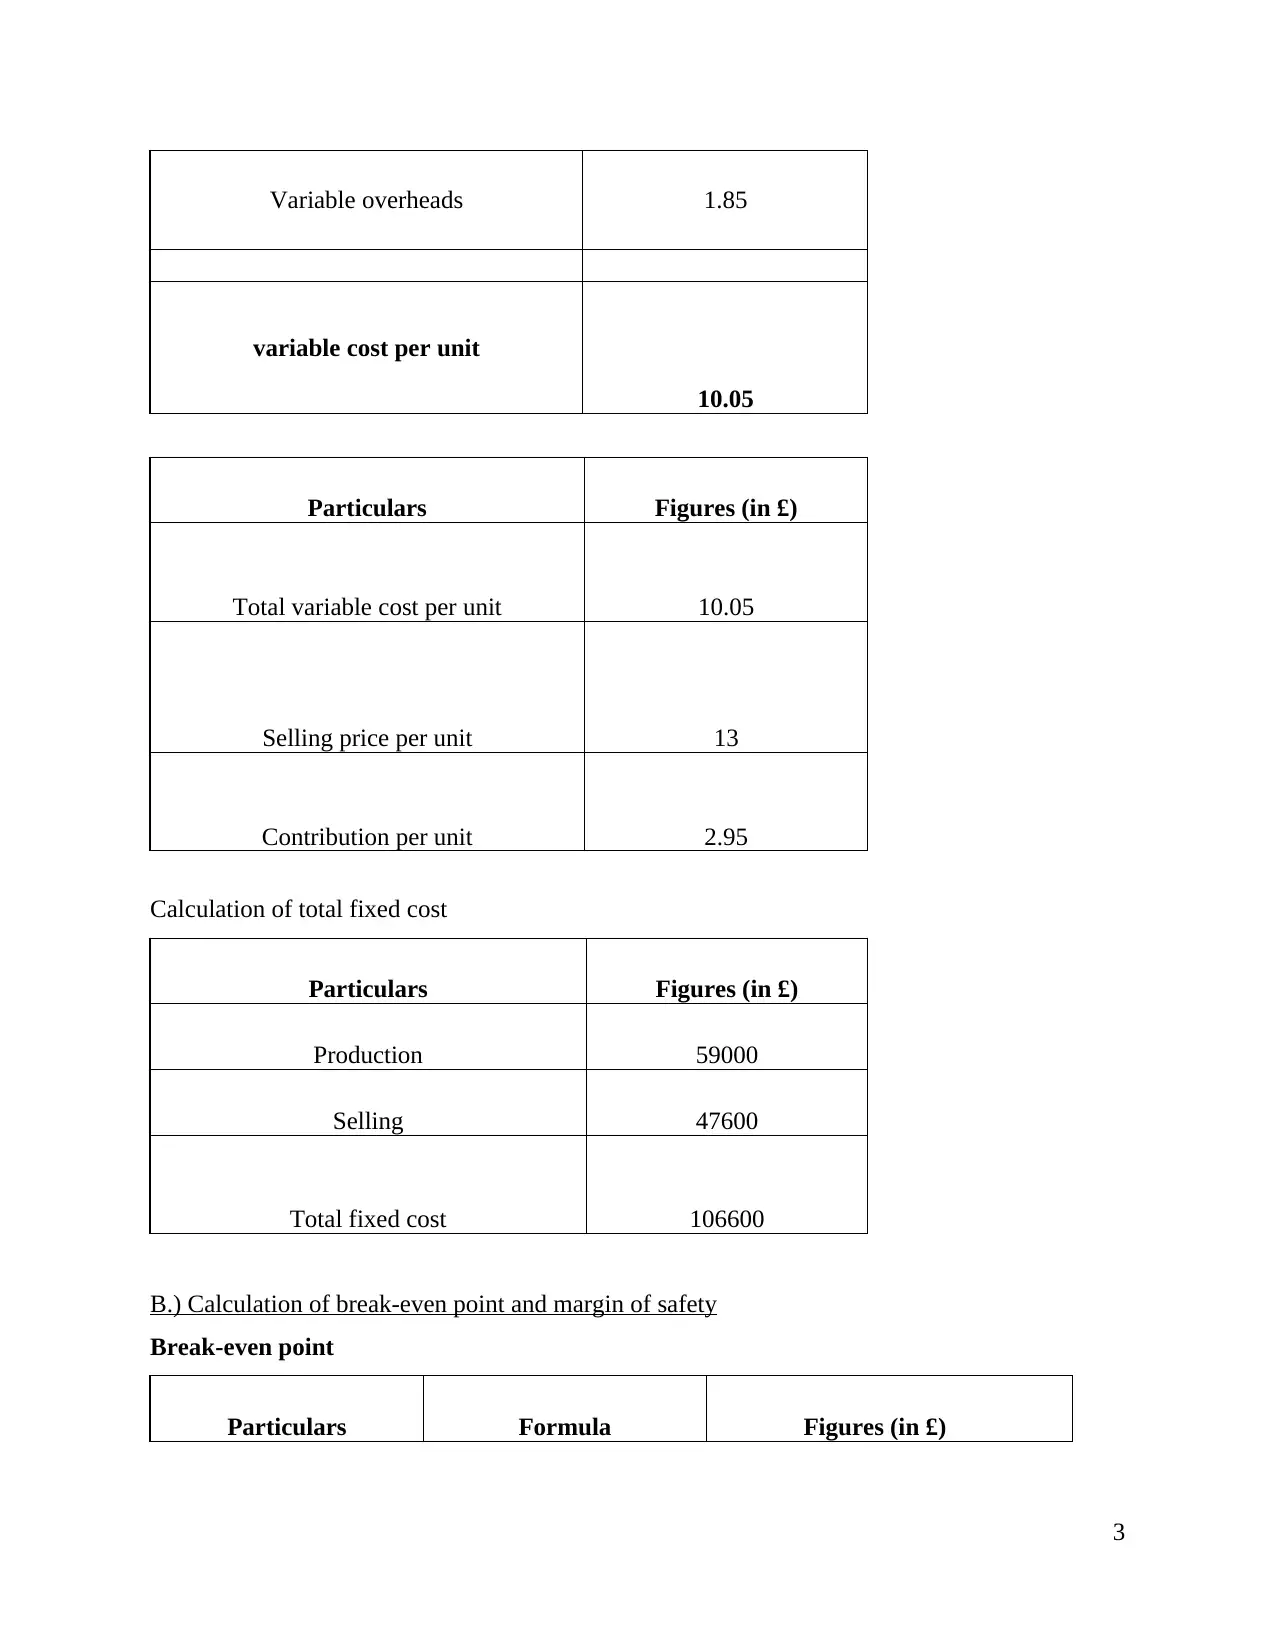
Variable overheads 1.85
variable cost per unit
10.05
Particulars Figures (in £)
Total variable cost per unit 10.05
Selling price per unit 13
Contribution per unit 2.95
Calculation of total fixed cost
Particulars Figures (in £)
Production 59000
Selling 47600
Total fixed cost 106600
B.) Calculation of break-even point and margin of safety
Break-even point
Particulars Formula Figures (in £)
3
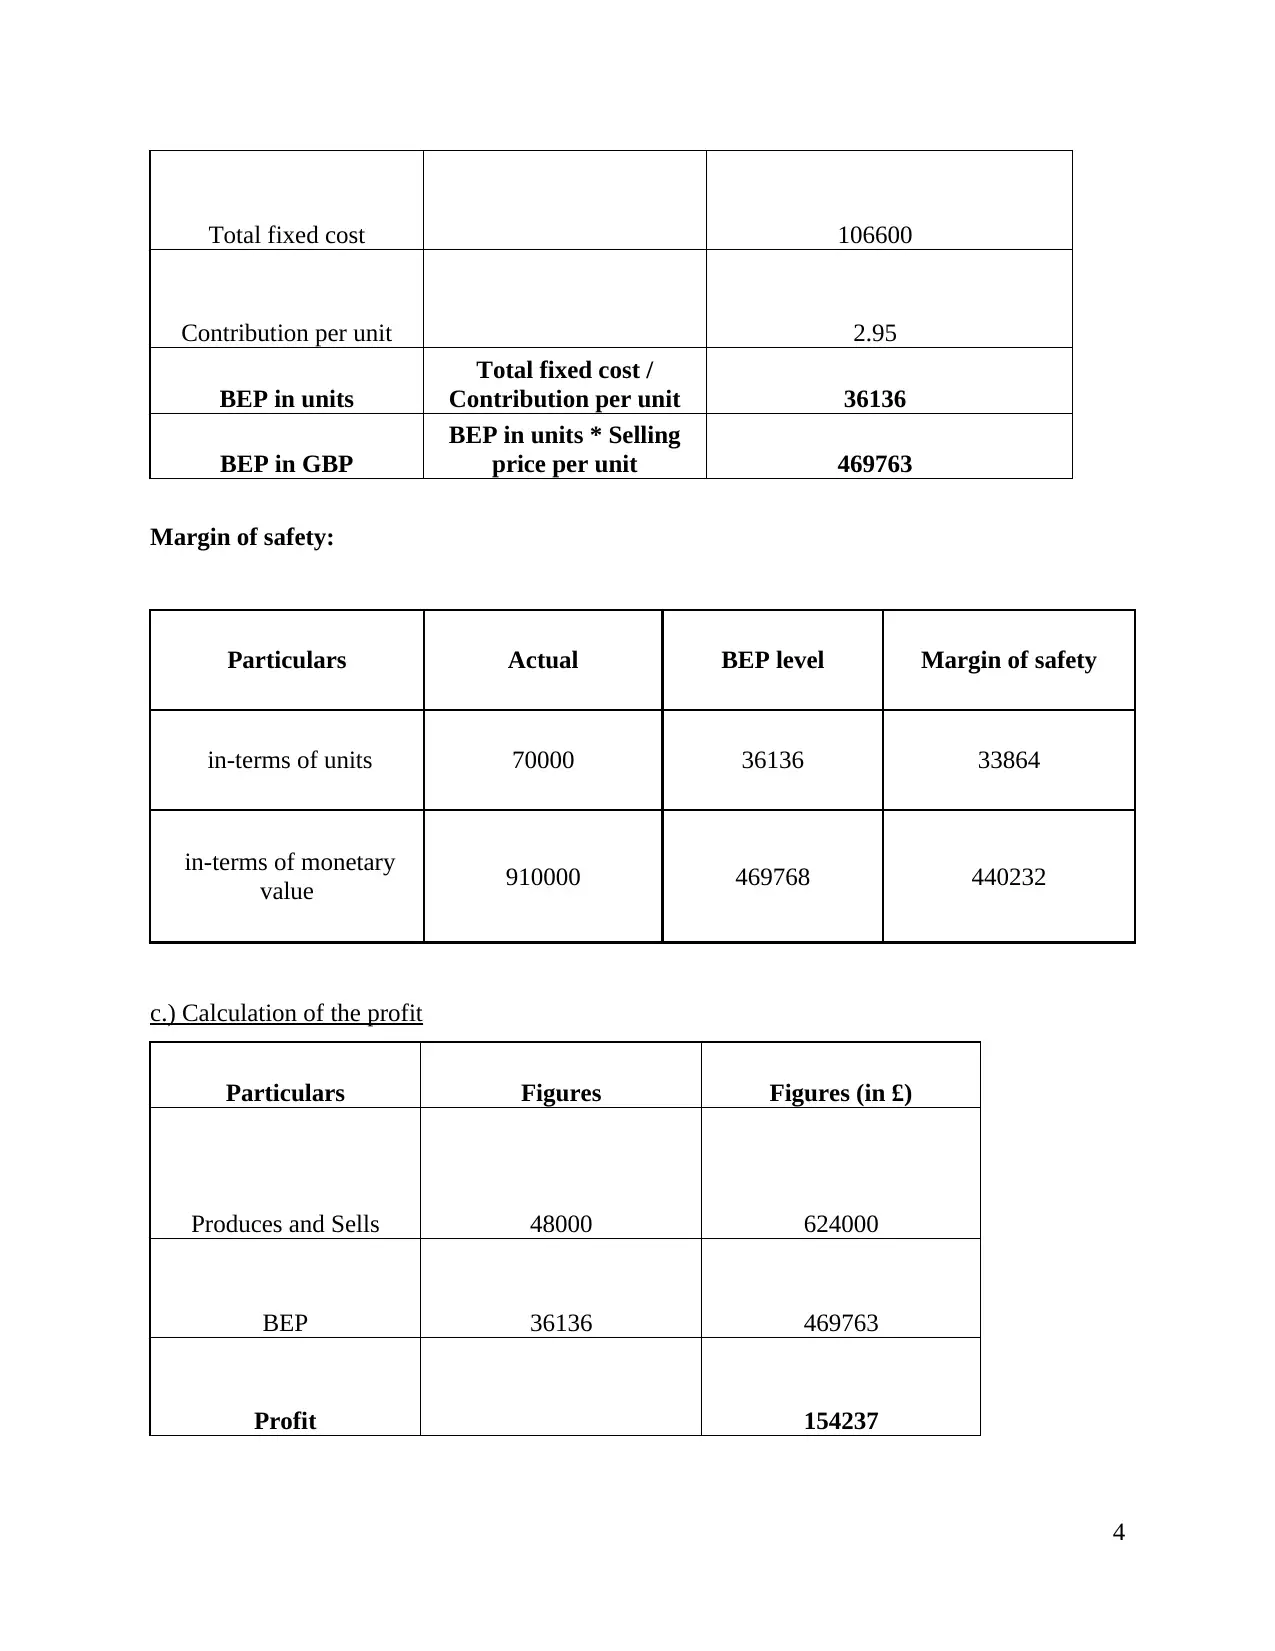
Total fixed cost 106600
Contribution per unit 2.95
BEP in units
Total fixed cost /
Contribution per unit 36136
BEP in GBP
BEP in units * Selling
price per unit 469763
Margin of safety:
Particulars Actual BEP level Margin of safety
in-terms of units 70000 36136 33864
in-terms of monetary
value 910000 469768 440232
c.) Calculation of the profit
Particulars Figures Figures (in £)
Produces and Sells 48000 624000
BEP 36136 469763
Profit 154237
4
⊘ This is a preview!⊘
Do you want full access?
Subscribe today to unlock all pages.
Trusted by 1+ million students worldwide
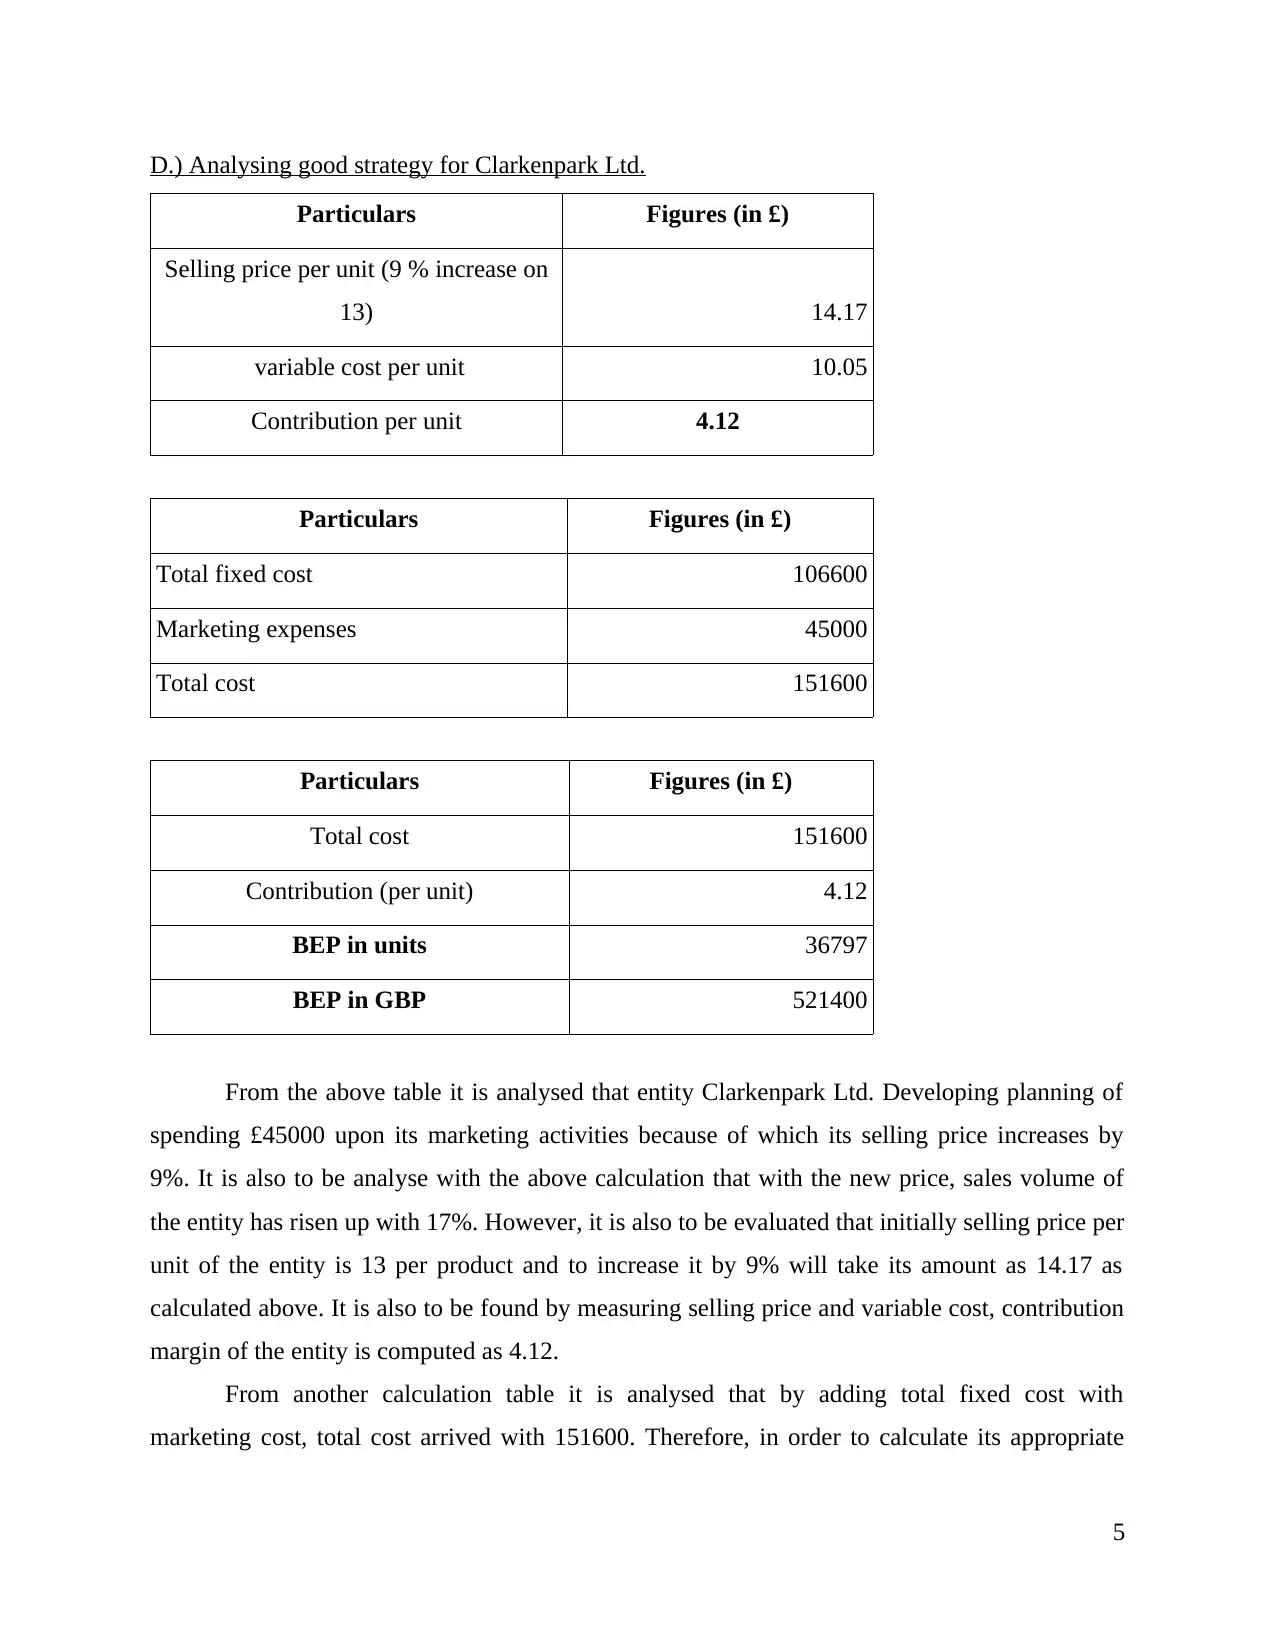
D.) Analysing good strategy for Clarkenpark Ltd.
Particulars Figures (in £)
Selling price per unit (9 % increase on
13) 14.17
variable cost per unit 10.05
Contribution per unit 4.12
Particulars Figures (in £)
Total fixed cost 106600
Marketing expenses 45000
Total cost 151600
Particulars Figures (in £)
Total cost 151600
Contribution (per unit) 4.12
BEP in units 36797
BEP in GBP 521400
From the above table it is analysed that entity Clarkenpark Ltd. Developing planning of
spending £45000 upon its marketing activities because of which its selling price increases by
9%. It is also to be analyse with the above calculation that with the new price, sales volume of
the entity has risen up with 17%. However, it is also to be evaluated that initially selling price per
unit of the entity is 13 per product and to increase it by 9% will take its amount as 14.17 as
calculated above. It is also to be found by measuring selling price and variable cost, contribution
margin of the entity is computed as 4.12.
From another calculation table it is analysed that by adding total fixed cost with
marketing cost, total cost arrived with 151600. Therefore, in order to calculate its appropriate
5
Particulars Figures (in £)
Selling price per unit (9 % increase on
13) 14.17
variable cost per unit 10.05
Contribution per unit 4.12
Particulars Figures (in £)
Total fixed cost 106600
Marketing expenses 45000
Total cost 151600
Particulars Figures (in £)
Total cost 151600
Contribution (per unit) 4.12
BEP in units 36797
BEP in GBP 521400
From the above table it is analysed that entity Clarkenpark Ltd. Developing planning of
spending £45000 upon its marketing activities because of which its selling price increases by
9%. It is also to be analyse with the above calculation that with the new price, sales volume of
the entity has risen up with 17%. However, it is also to be evaluated that initially selling price per
unit of the entity is 13 per product and to increase it by 9% will take its amount as 14.17 as
calculated above. It is also to be found by measuring selling price and variable cost, contribution
margin of the entity is computed as 4.12.
From another calculation table it is analysed that by adding total fixed cost with
marketing cost, total cost arrived with 151600. Therefore, in order to calculate its appropriate
5
Paraphrase This Document
Need a fresh take? Get an instant paraphrase of this document with our AI Paraphraser
formula will get used which include total cost divided by contribution per unit. The result which
has arrived is £36797 and its GDP comes up with £521400.
Thus, it is clearly measured that company has the capability of earning profit but it is not
at the level of 17% which indicates that Clarkenpark Ltd entity did not have sound strategy in
order to achieve profit. Hence, it is analysed that with the increase in price, its expenses will also
get increases but outcomes of profitability will not be achieved by the company.
E.) Explaining underpinning assumptions which is attached to break-even model
Break-even analysis is the technique which is used by entity's production management
and by its accountant. It is process of analysing cost of production which are termed as variable
and fixed cost. Further, in order to determine the sales volume, total variable and fixed costs are
compared with sales revenue at a point where business did not make profit nor loss (Nagarajan
and Visagamoorthi, 2018). Therefore, it is evaluated that this is the point at which entity is
neither making either profit nor loss. It also has been found that if entity will not make effective
strategy for mitigating its loss then it will start affecting its business operations. In order to
achieve fixed cost entity has to sold 5000 units. Thus, in order to achieve business profit, entity
has to produce more than 5000 units.
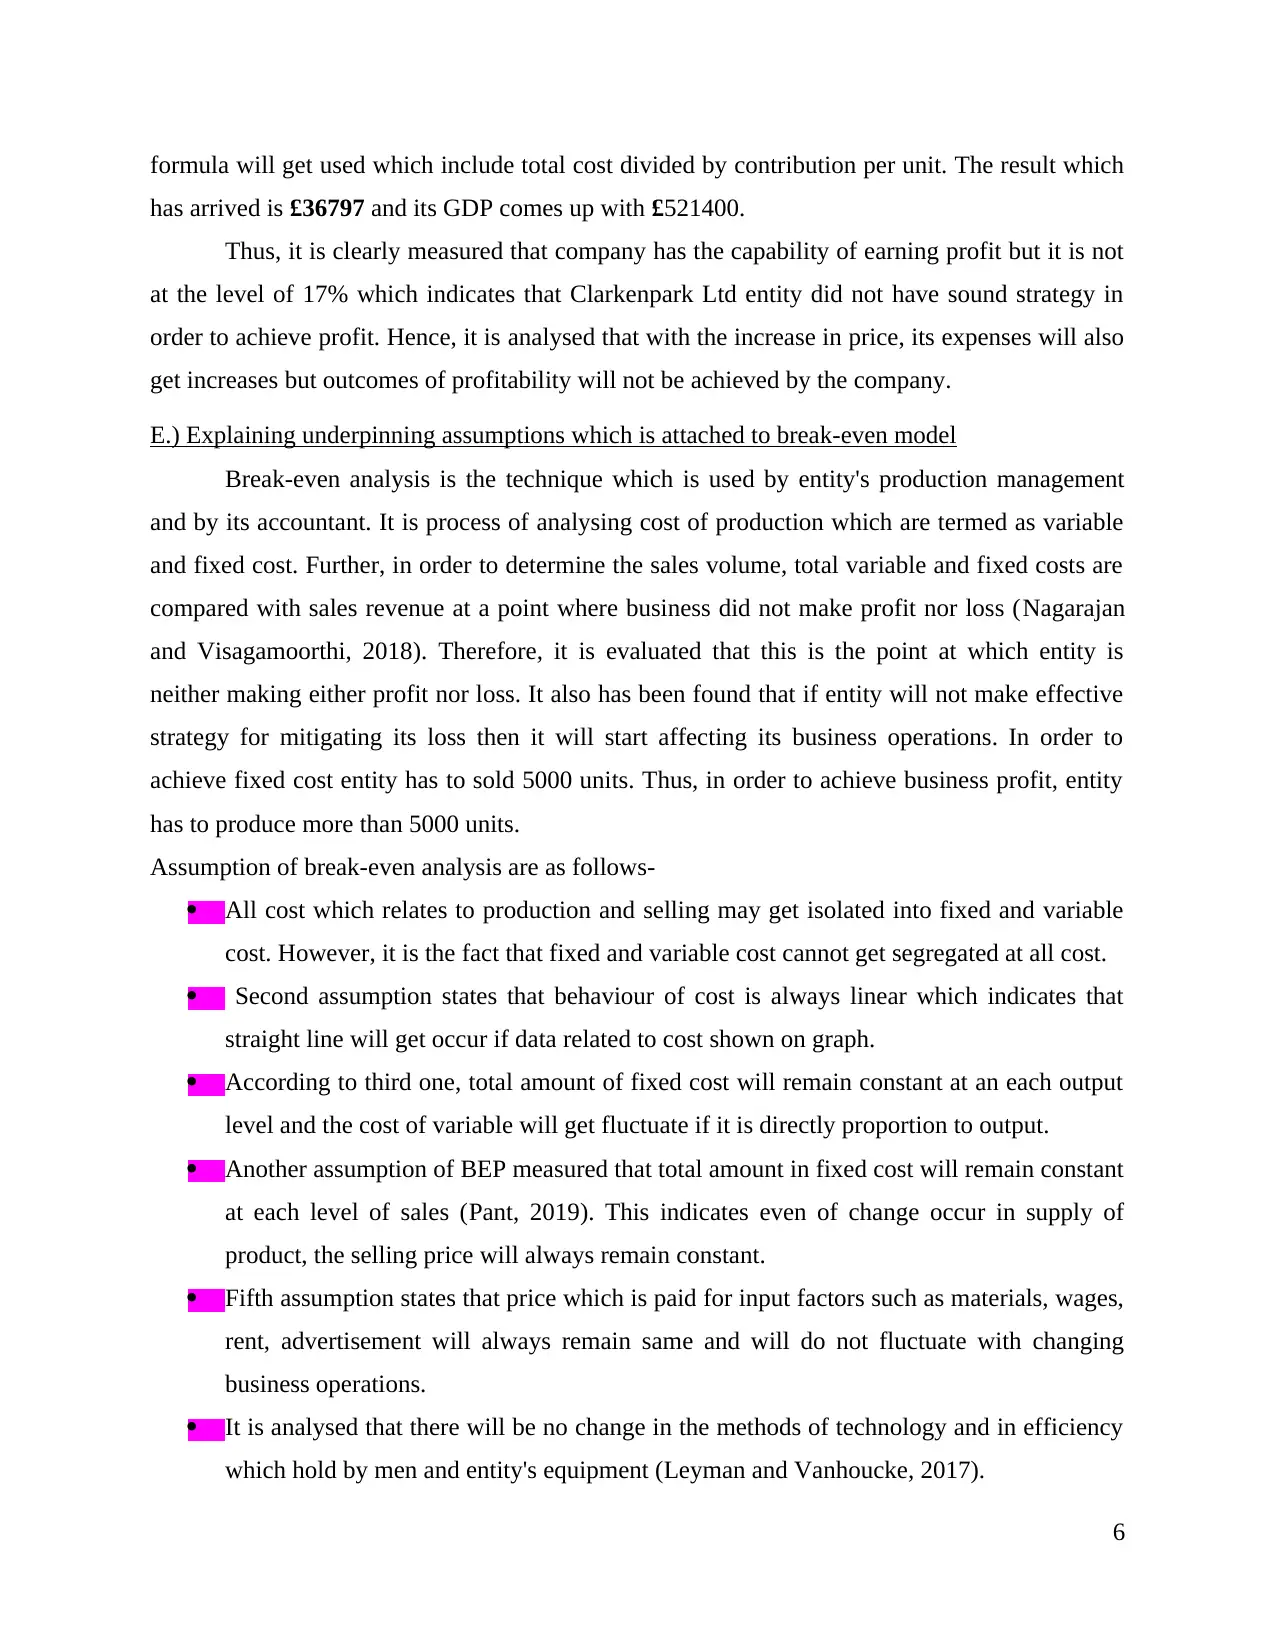
Assumption of break-even analysis are as follows-
All cost which relates to production and selling may get isolated into fixed and variable
cost. However, it is the fact that fixed and variable cost cannot get segregated at all cost.
Second assumption states that behaviour of cost is always linear which indicates that
straight line will get occur if data related to cost shown on graph.
According to third one, total amount of fixed cost will remain constant at an each output
level and the cost of variable will get fluctuate if it is directly proportion to output.
Another assumption of BEP measured that total amount in fixed cost will remain constant
at each level of sales (Pant, 2019). This indicates even of change occur in supply of
product, the selling price will always remain constant.
Fifth assumption states that price which is paid for input factors such as materials, wages,
rent, advertisement will always remain same and will do not fluctuate with changing
business operations.
It is analysed that there will be no change in the methods of technology and in efficiency
which hold by men and entity's equipment (Leyman and Vanhoucke, 2017).
6
has arrived is £36797 and its GDP comes up with £521400.
Thus, it is clearly measured that company has the capability of earning profit but it is not
at the level of 17% which indicates that Clarkenpark Ltd entity did not have sound strategy in
order to achieve profit. Hence, it is analysed that with the increase in price, its expenses will also
get increases but outcomes of profitability will not be achieved by the company.
E.) Explaining underpinning assumptions which is attached to break-even model
Break-even analysis is the technique which is used by entity's production management
and by its accountant. It is process of analysing cost of production which are termed as variable
and fixed cost. Further, in order to determine the sales volume, total variable and fixed costs are
compared with sales revenue at a point where business did not make profit nor loss (Nagarajan
and Visagamoorthi, 2018). Therefore, it is evaluated that this is the point at which entity is
neither making either profit nor loss. It also has been found that if entity will not make effective
strategy for mitigating its loss then it will start affecting its business operations. In order to
achieve fixed cost entity has to sold 5000 units. Thus, in order to achieve business profit, entity
has to produce more than 5000 units.
Assumption of break-even analysis are as follows-
All cost which relates to production and selling may get isolated into fixed and variable
cost. However, it is the fact that fixed and variable cost cannot get segregated at all cost.
Second assumption states that behaviour of cost is always linear which indicates that
straight line will get occur if data related to cost shown on graph.
According to third one, total amount of fixed cost will remain constant at an each output
level and the cost of variable will get fluctuate if it is directly proportion to output.
Another assumption of BEP measured that total amount in fixed cost will remain constant
at each level of sales (Pant, 2019). This indicates even of change occur in supply of
product, the selling price will always remain constant.
Fifth assumption states that price which is paid for input factors such as materials, wages,
rent, advertisement will always remain same and will do not fluctuate with changing
business operations.
It is analysed that there will be no change in the methods of technology and in efficiency
which hold by men and entity's equipment (Leyman and Vanhoucke, 2017).
6
Another assumption of BEP states that revenue and costs will always get compared with
common activity base such as sales value of products and number of units which gets
produced.
Last assumption in BEP assumed that any output and sales volume will only be assumed
with relevant factor which mainly affect the entity's cost.
These are the universal assumption which get applicable in businesses. However, it is also been
true that this assumption may get derive from the real world calculation as some will not get
applied in order to generate the profitability and to reach at break-even analysis.
PART C
A.) Calculation of payback period, accounting rate of return and net present value
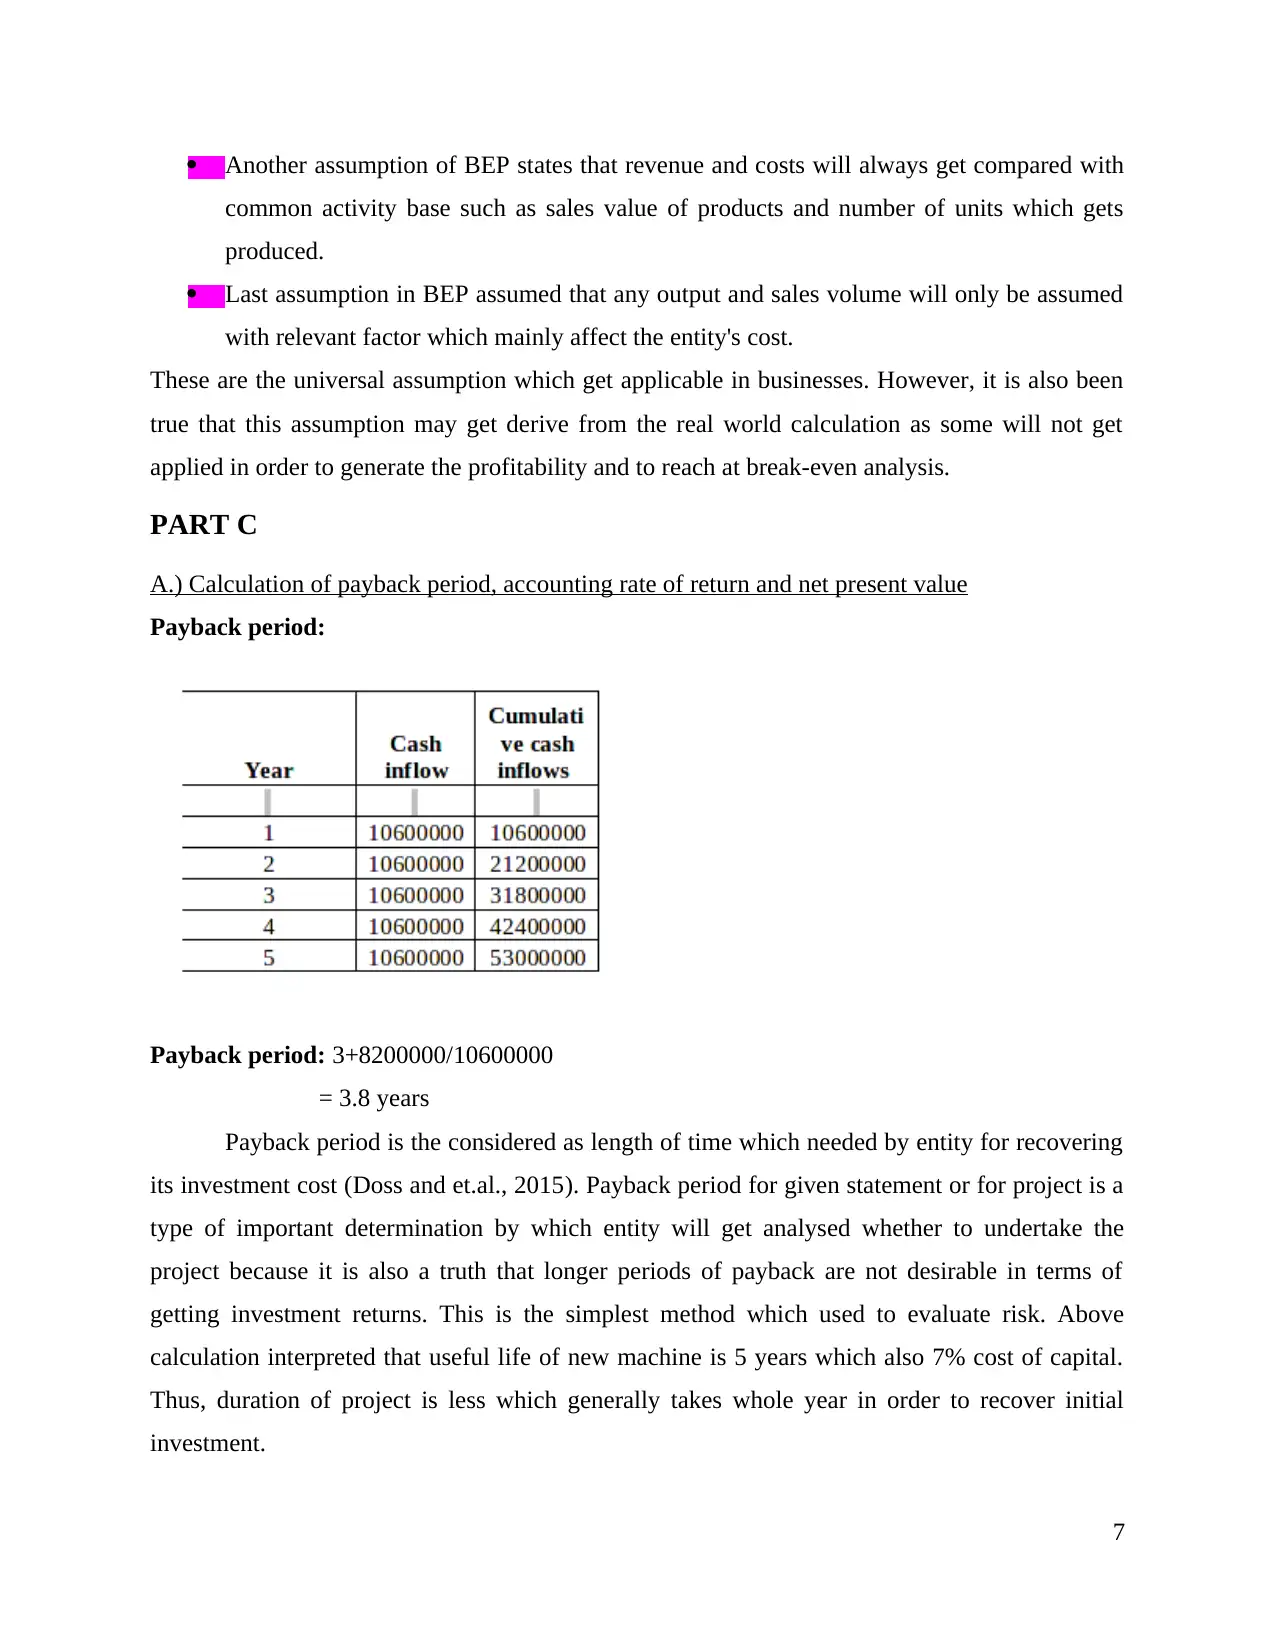
Payback period:
Payback period: 3+8200000/10600000
= 3.8 years
Payback period is the considered as length of time which needed by entity for recovering
its investment cost (Doss and et.al., 2015). Payback period for given statement or for project is a
type of important determination by which entity will get analysed whether to undertake the
project because it is also a truth that longer periods of payback are not desirable in terms of
getting investment returns. This is the simplest method which used to evaluate risk. Above
calculation interpreted that useful life of new machine is 5 years which also 7% cost of capital.
Thus, duration of project is less which generally takes whole year in order to recover initial
investment.
7
common activity base such as sales value of products and number of units which gets
produced.
Last assumption in BEP assumed that any output and sales volume will only be assumed
with relevant factor which mainly affect the entity's cost.
These are the universal assumption which get applicable in businesses. However, it is also been
true that this assumption may get derive from the real world calculation as some will not get
applied in order to generate the profitability and to reach at break-even analysis.
PART C
A.) Calculation of payback period, accounting rate of return and net present value
Payback period:
Payback period: 3+8200000/10600000
= 3.8 years
Payback period is the considered as length of time which needed by entity for recovering
its investment cost (Doss and et.al., 2015). Payback period for given statement or for project is a
type of important determination by which entity will get analysed whether to undertake the
project because it is also a truth that longer periods of payback are not desirable in terms of
getting investment returns. This is the simplest method which used to evaluate risk. Above
calculation interpreted that useful life of new machine is 5 years which also 7% cost of capital.
Thus, duration of project is less which generally takes whole year in order to recover initial
investment.
7
⊘ This is a preview!⊘
Do you want full access?
Subscribe today to unlock all pages.
Trusted by 1+ million students worldwide
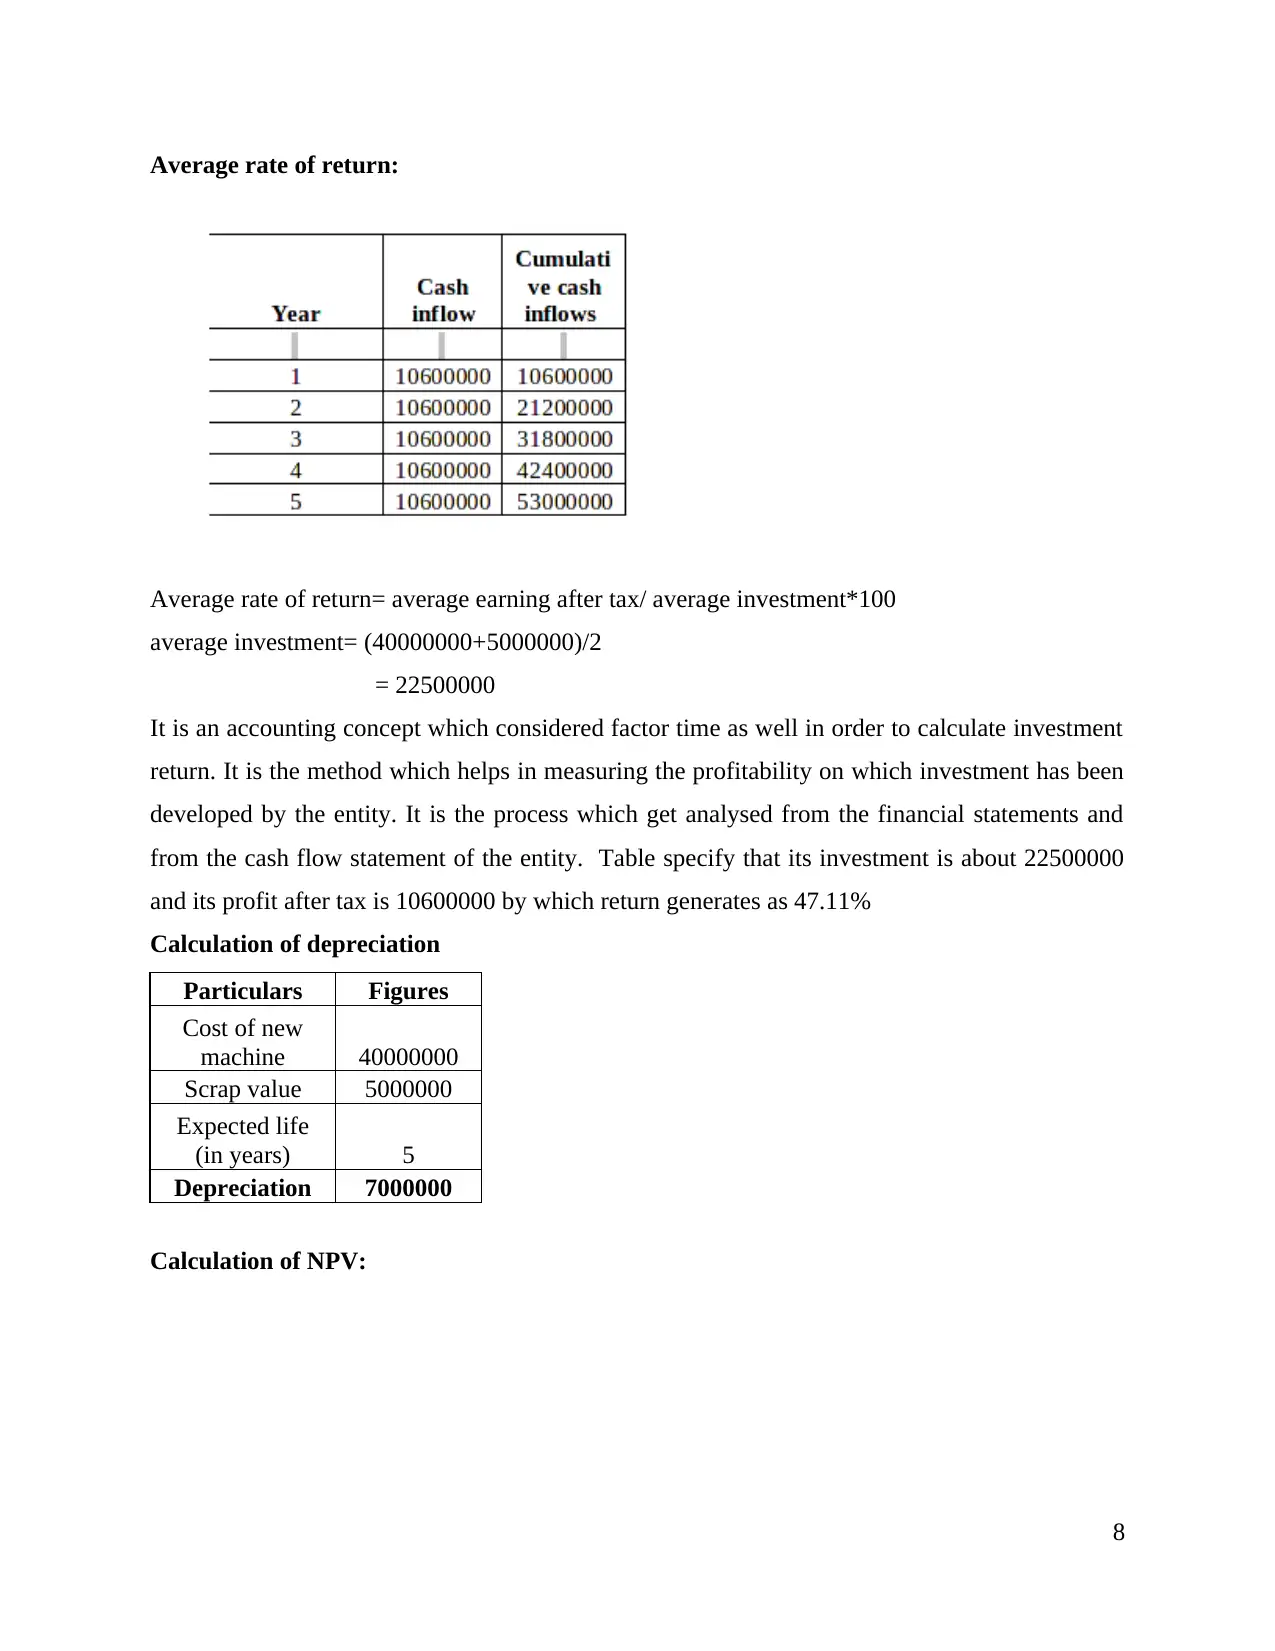
Average rate of return:
Average rate of return= average earning after tax/ average investment*100
average investment= (40000000+5000000)/2
= 22500000
It is an accounting concept which considered factor time as well in order to calculate investment
return. It is the method which helps in measuring the profitability on which investment has been
developed by the entity. It is the process which get analysed from the financial statements and
from the cash flow statement of the entity. Table specify that its investment is about 22500000
and its profit after tax is 10600000 by which return generates as 47.11%
Calculation of depreciation
Particulars Figures
Cost of new
machine 40000000
Scrap value 5000000
Expected life
(in years) 5
Depreciation 7000000
Calculation of NPV:
8
Paraphrase This Document
Need a fresh take? Get an instant paraphrase of this document with our AI Paraphraser
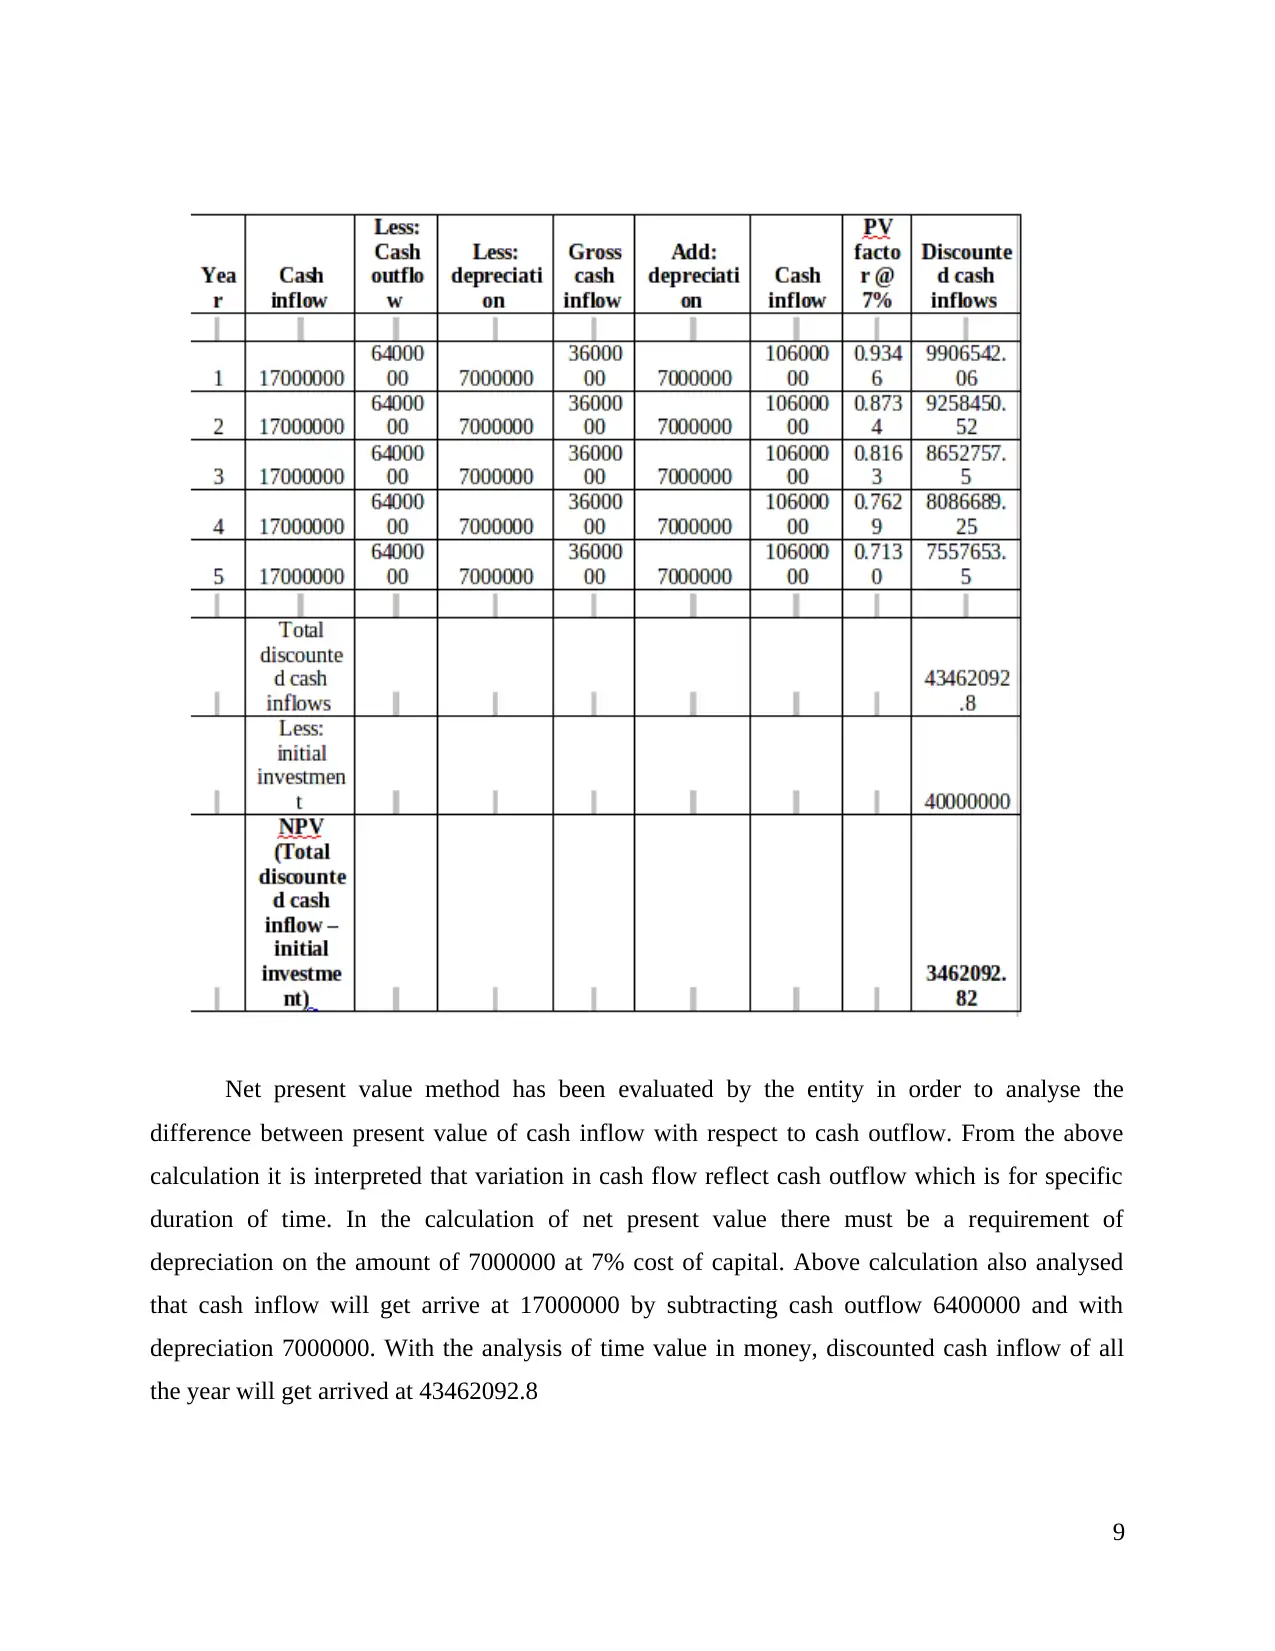
Net present value method has been evaluated by the entity in order to analyse the
difference between present value of cash inflow with respect to cash outflow. From the above
calculation it is interpreted that variation in cash flow reflect cash outflow which is for specific
duration of time. In the calculation of net present value there must be a requirement of
depreciation on the amount of 7000000 at 7% cost of capital. Above calculation also analysed
that cash inflow will get arrive at 17000000 by subtracting cash outflow 6400000 and with
depreciation 7000000. With the analysis of time value in money, discounted cash inflow of all
the year will get arrived at 43462092.8
9
Thus, it is evaluated that initial cost will get covered within 3 years with its average rate of return
of 47.11% and with positive vale of net present that is 3462092.82. Hence, project will not get
accepted according to investment appraisal technique.
b.) Investment appraisal techniques:
Capital investment appraisal technique is used to take strategic decision in order to
analyse the viability of investment project in order to maximize shareholder's wealth and achieve
long term objective of the company. Investment appraisal techniques also analyze the
attractiveness of project or portfolio on which investment is done(Gotze, Northcott, and
Schuster, 2016).
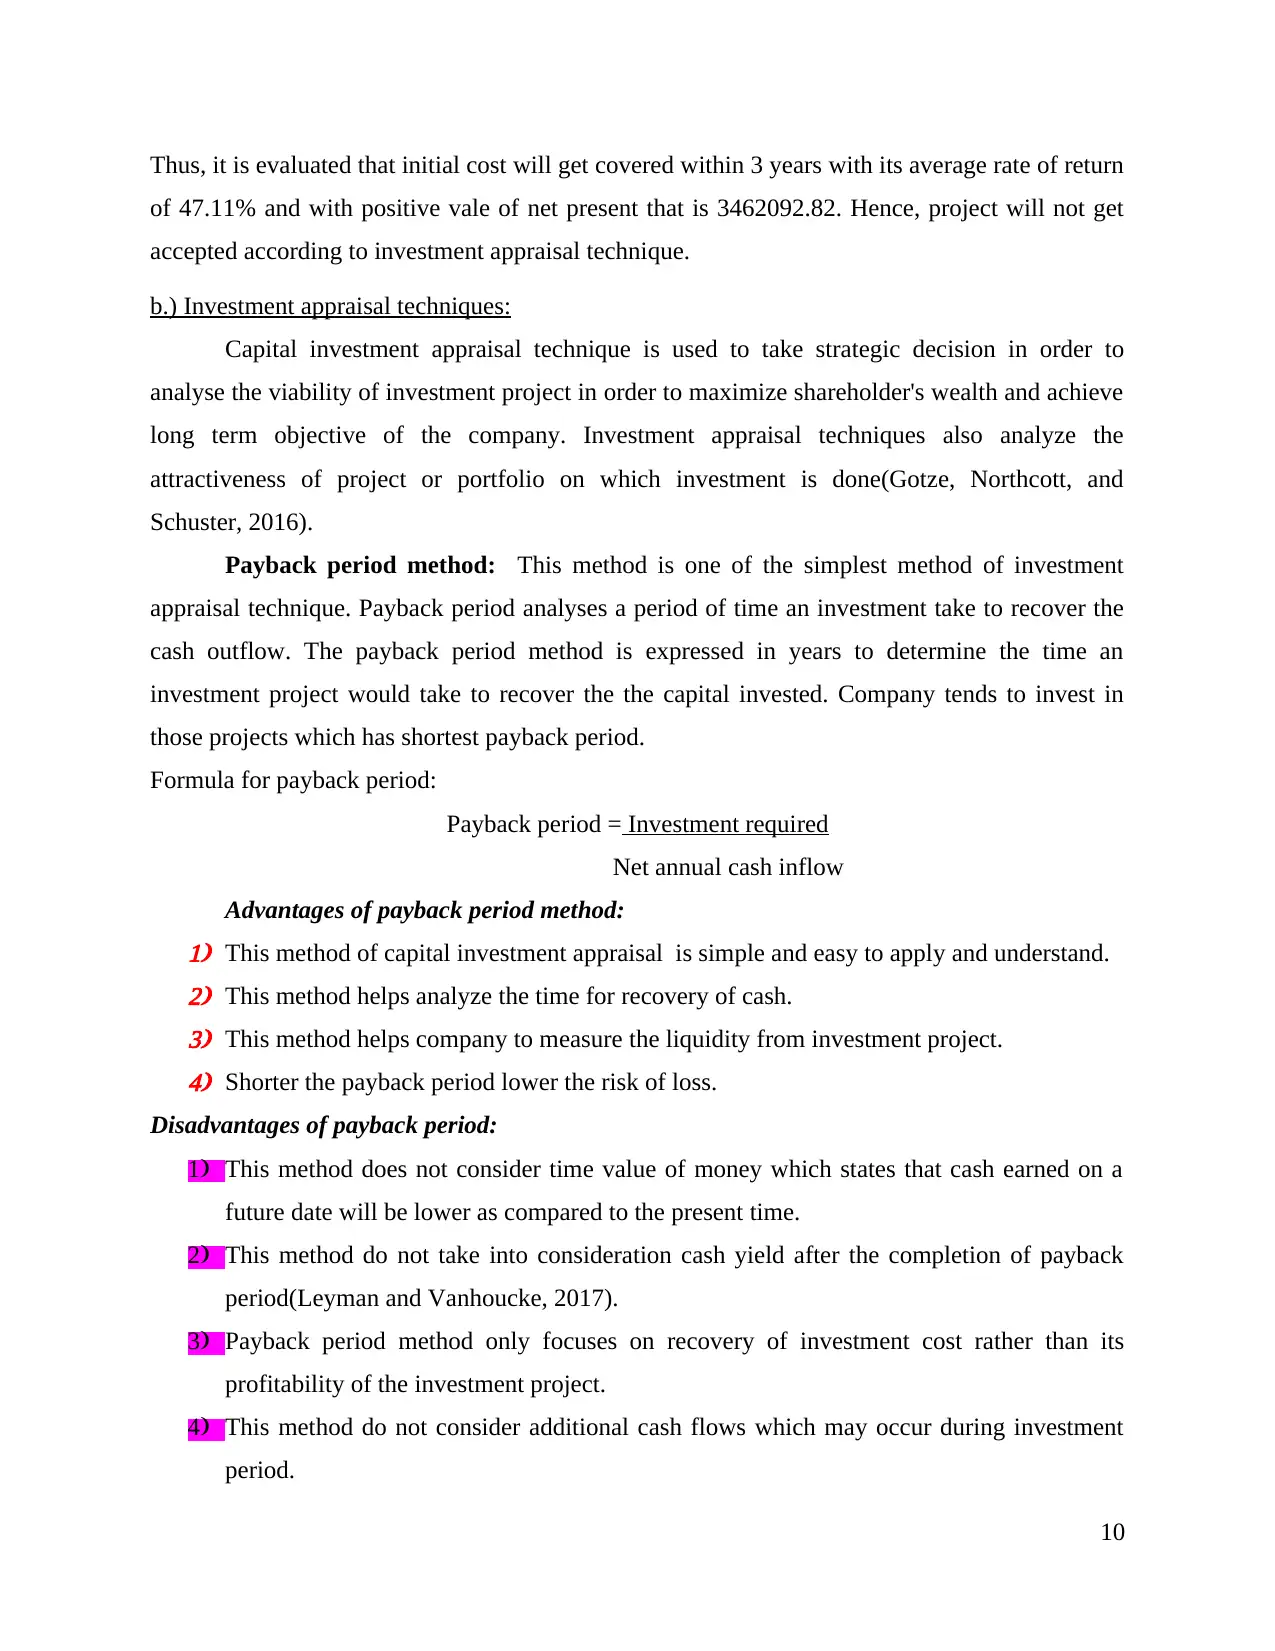
Payback period method: This method is one of the simplest method of investment
appraisal technique. Payback period analyses a period of time an investment take to recover the
cash outflow. The payback period method is expressed in years to determine the time an
investment project would take to recover the the capital invested. Company tends to invest in
those projects which has shortest payback period.
Formula for payback period:
Payback period = Investment required
Net annual cash inflow
Advantages of payback period method:1) This method of capital investment appraisal is simple and easy to apply and understand.2) This method helps analyze the time for recovery of cash.3) This method helps company to measure the liquidity from investment project.4) Shorter the payback period lower the risk of loss.
Disadvantages of payback period:
1) This method does not consider time value of money which states that cash earned on a
future date will be lower as compared to the present time.
2) This method do not take into consideration cash yield after the completion of payback
period(Leyman and Vanhoucke, 2017).
3) Payback period method only focuses on recovery of investment cost rather than its
profitability of the investment project.
4) This method do not consider additional cash flows which may occur during investment
period.
10
of 47.11% and with positive vale of net present that is 3462092.82. Hence, project will not get
accepted according to investment appraisal technique.
b.) Investment appraisal techniques:
Capital investment appraisal technique is used to take strategic decision in order to
analyse the viability of investment project in order to maximize shareholder's wealth and achieve
long term objective of the company. Investment appraisal techniques also analyze the
attractiveness of project or portfolio on which investment is done(Gotze, Northcott, and
Schuster, 2016).
Payback period method: This method is one of the simplest method of investment
appraisal technique. Payback period analyses a period of time an investment take to recover the
cash outflow. The payback period method is expressed in years to determine the time an
investment project would take to recover the the capital invested. Company tends to invest in
those projects which has shortest payback period.
Formula for payback period:
Payback period = Investment required
Net annual cash inflow
Advantages of payback period method:1) This method of capital investment appraisal is simple and easy to apply and understand.2) This method helps analyze the time for recovery of cash.3) This method helps company to measure the liquidity from investment project.4) Shorter the payback period lower the risk of loss.
Disadvantages of payback period:
1) This method does not consider time value of money which states that cash earned on a
future date will be lower as compared to the present time.
2) This method do not take into consideration cash yield after the completion of payback
period(Leyman and Vanhoucke, 2017).
3) Payback period method only focuses on recovery of investment cost rather than its
profitability of the investment project.
4) This method do not consider additional cash flows which may occur during investment
period.
10
⊘ This is a preview!⊘
Do you want full access?
Subscribe today to unlock all pages.
Trusted by 1+ million students worldwide
1 out of 16
Related Documents


Your All-in-One AI-Powered Toolkit for Academic Success.
+13062052269
info@desklib.com
Available 24*7 on WhatsApp / Email
![[object Object]](/_next/static/media/star-bottom.7253800d.svg)
Unlock your academic potential
Copyright © 2020–2026 A2Z Services. All Rights Reserved. Developed and managed by ZUCOL.