AC50026E Financial Accounting Report: NEXT Plc Ratio Analysis
VerifiedAdded on 2023/06/16
|12
|2412
|188
Report
AI Summary
This report provides a financial analysis of NEXT Plc using accounting ratios calculated from their 2021 annual report. It covers profitability ratios (operating profit ratio, gross profit ratio, return on capital employed), liquidity ratios (current ratio, quick ratio), efficiency ratios (debtors turnover period, fixed assets turnover), and solvency ratios (interest coverage ratio, debt to asset ratio). The interpretation of these ratios indicates a decline in financial performance in 2021 compared to previous years, particularly 2020, attributed to the global pandemic. Recommendations are made for NEXT Plc to improve its financial performance in subsequent years to regain its previous level of efficiency and effectiveness. The report concludes that while the company faced challenges in 2021, improvements are necessary to enhance its earning capacity.

Financial accounting
Paraphrase This Document
Need a fresh take? Get an instant paraphrase of this document with our AI Paraphraser
Table of Contents
Financial accounting............................................................................................................1
Table of Contents.............................................................................................................................2
Introduction......................................................................................................................................3
Accounting Ratios and Its Calculation...................................................................................3
Interpretation....................................................................................................................................4
Recommendation....................................................................................................................6
Conclusion..............................................................................................................................6
References........................................................................................................................................7
Books & Journals...................................................................................................................7
Appendix..........................................................................................................................................8
Introduction
In every organization, it is highly important to analyse the financial situation of the company
by carefully assessing the balancing sheet in a proper way. For this purpose, the use of
balance sheet can be utilized because all the important components of an organization that
comes in the financial capacity of an organization are included in it. In context to this report,
NEXT Plc has been taken into consideration. The annual report of this respective company
of the year 2021 are used and applied in order to calculate the accounting ratios and assess
the financial stability of the company.
Accounting Ratios and Its Calculation
Accounting Ratios can be considered as a highly valuable tool that basically helps in
making the financial decisions for the business organization in a very effective manner
(Adwan, Alhaj-Ismail and Girardone, 2020). This tool is majorly used by investors and
professionals in the finance field so that they can analyse the financial position of the
company carefully. In context to Next Plc, different ratios are explained and calculated
below:
1. Profitability Ratios: These are those ratios that helps in understanding the capacity of
the firm to create and generate earnings in accordance to the revenue by using the
financial data of the company. Several types of profitability ratios are mentioned
below:
a) Operating Profit Ratio: It is a type of ratio that helps in understanding the
capacity to earn profit and revenues out of the business operations. It is a
relationship between the operating profit & net sales.
b) Gross profit ratio: It can be defined as the difference between sales & cost of
goods sold, divided by net sales. It is usually expressed in percentage.
c) Return on Capital Employed: It is an accounting ratio used in the financial
management, valuation along with accounting. It helps in comparing the
profitability of companies for the purpose of capital used.
2. Liquidity Ratios: These are those accounting ratios that help in ascertaining the
capacity of the firm to assess ability of the firm to pay off its financial current debts
⊘ This is a preview!⊘
Do you want full access?
Subscribe today to unlock all pages.
Trusted by 1+ million students worldwide
(Kenny and Larson, 2018). it basically helps in measuring the company’s capability to
pay back the debts and all the obligation related to it. It includes various ratios that are
mentioned below:
A) Current Ratio: It is one of the liquidity ratio that helps in measuring the capacity
of the firm to deal with the short term responsibility.
B) Quick Ratio / Acid Test Ratio: It is a ratio that helps in measuring the capability
of the business organization to utilize for the purpose to use its near cash and the
asset which don’t include inventory.
3. Efficiency Ratios (measured in Days or in Times): these are basically those ratios
that help in analysing how efficiently the company can use its assets and liabilities of
the company. The major purpose of using this ratio is basically to track the
performance of commercial and investment institutions.
a) Debtors Turnover Period : It is an accounting measure that is used by the
company in order to extend credit along with the collecting debts. This helps in
understanding the firm capability to use its assets.
b) Fixed Assets Turnover : It is the ratio that helps in utilizing the fixed assets so that
the business organization can generate high level of sales.
4. Solvency Ratios: It can be defined as an effective measure that helps in ascertaining
the company’s ability to deal with all the long-term financial obligations. it is often
used by the business leaders as they will take the decision of providing funds on the
basis of this only.
a) Interest coverage ratio: It is a ratio that specifically helps in measuring the ability
of the company to honour the payments of debts.
b) Debt to asset ratio: It is a type of leverage ratio, that helps in indicating the assets
percentage. This ratio helps in financing with the debts. A higher amount of ratio,
the greater degree of risk exists in leverage and financial.
Interpretation
From the above calculation of all the accounting ratios, the interpretation of all the ratios is
mentioned below specifically for each type:
Operating profit ratio: Although, the operating profit margin of the year 2017 is
higher than 15% which is considered as good. In the case of critical comparison
Paraphrase This Document
Need a fresh take? Get an instant paraphrase of this document with our AI Paraphraser
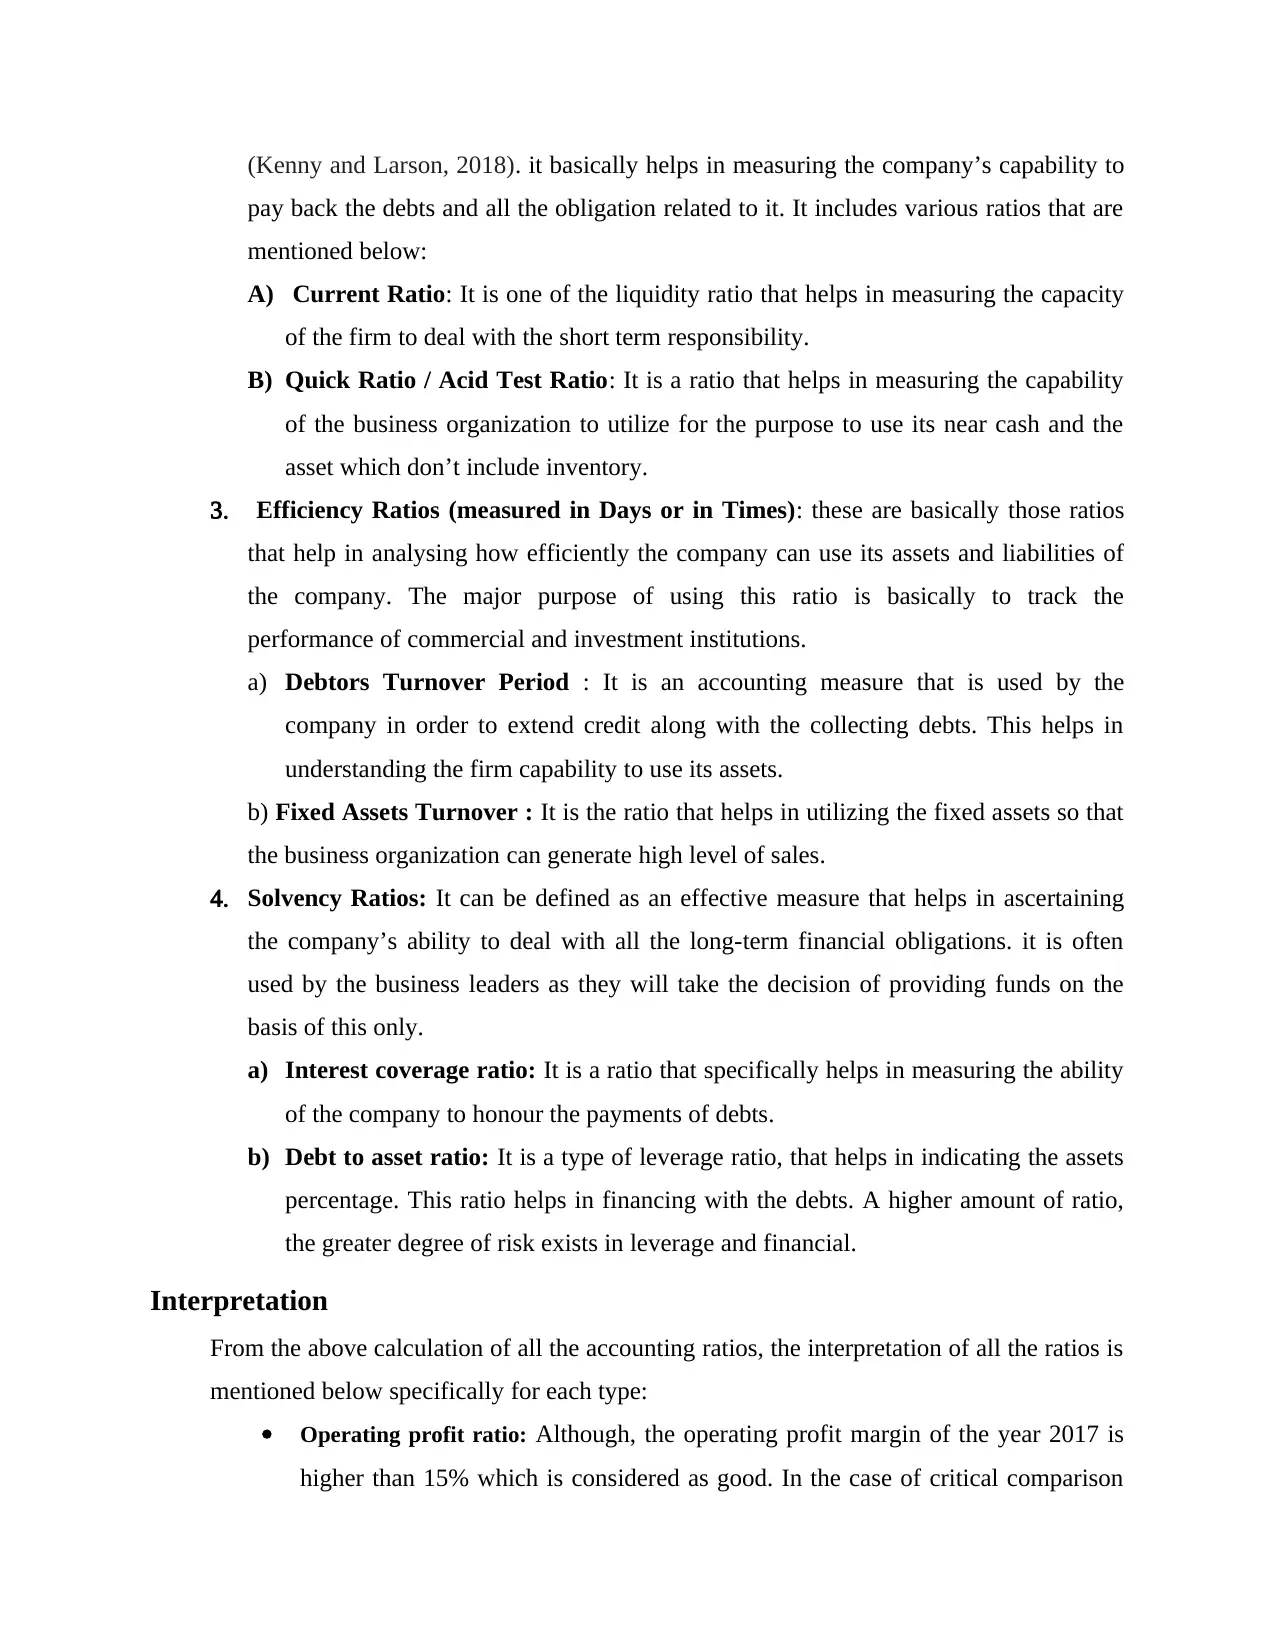
between all the years, the operating profit ratio was higher and better in the year
2020 stating that the company was earning enough money to handle to pay for all
the business operations cost. It can be considered that the ratio was consistent till
the year 2020 but there was a steep fall in the year 2021 because of Covid – 19.
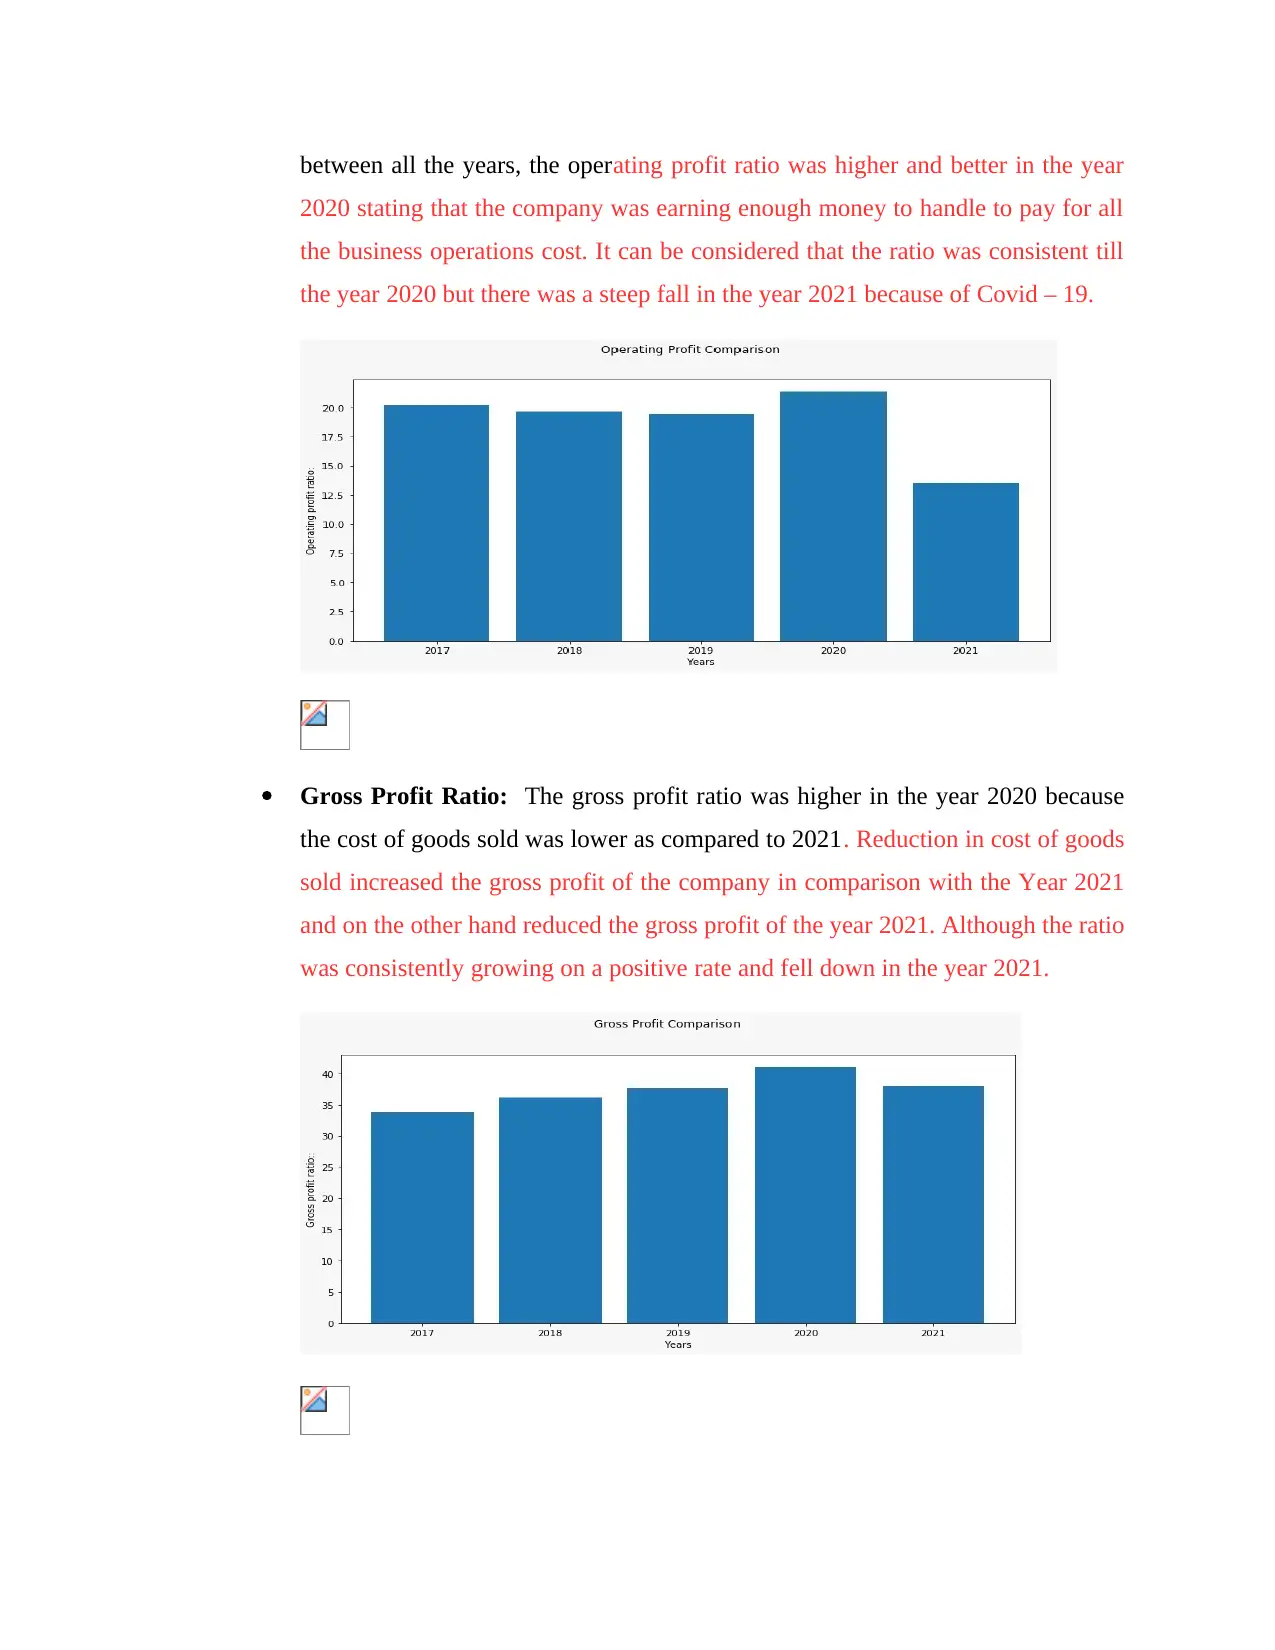
Gross Profit Ratio: The gross profit ratio was higher in the year 2020 because
the cost of goods sold was lower as compared to 2021. Reduction in cost of goods
sold increased the gross profit of the company in comparison with the Year 2021
and on the other hand reduced the gross profit of the year 2021. Although the ratio
was consistently growing on a positive rate and fell down in the year 2021.
2020 stating that the company was earning enough money to handle to pay for all
the business operations cost. It can be considered that the ratio was consistent till
the year 2020 but there was a steep fall in the year 2021 because of Covid – 19.
Gross Profit Ratio: The gross profit ratio was higher in the year 2020 because
the cost of goods sold was lower as compared to 2021. Reduction in cost of goods
sold increased the gross profit of the company in comparison with the Year 2021
and on the other hand reduced the gross profit of the year 2021. Although the ratio
was consistently growing on a positive rate and fell down in the year 2021.
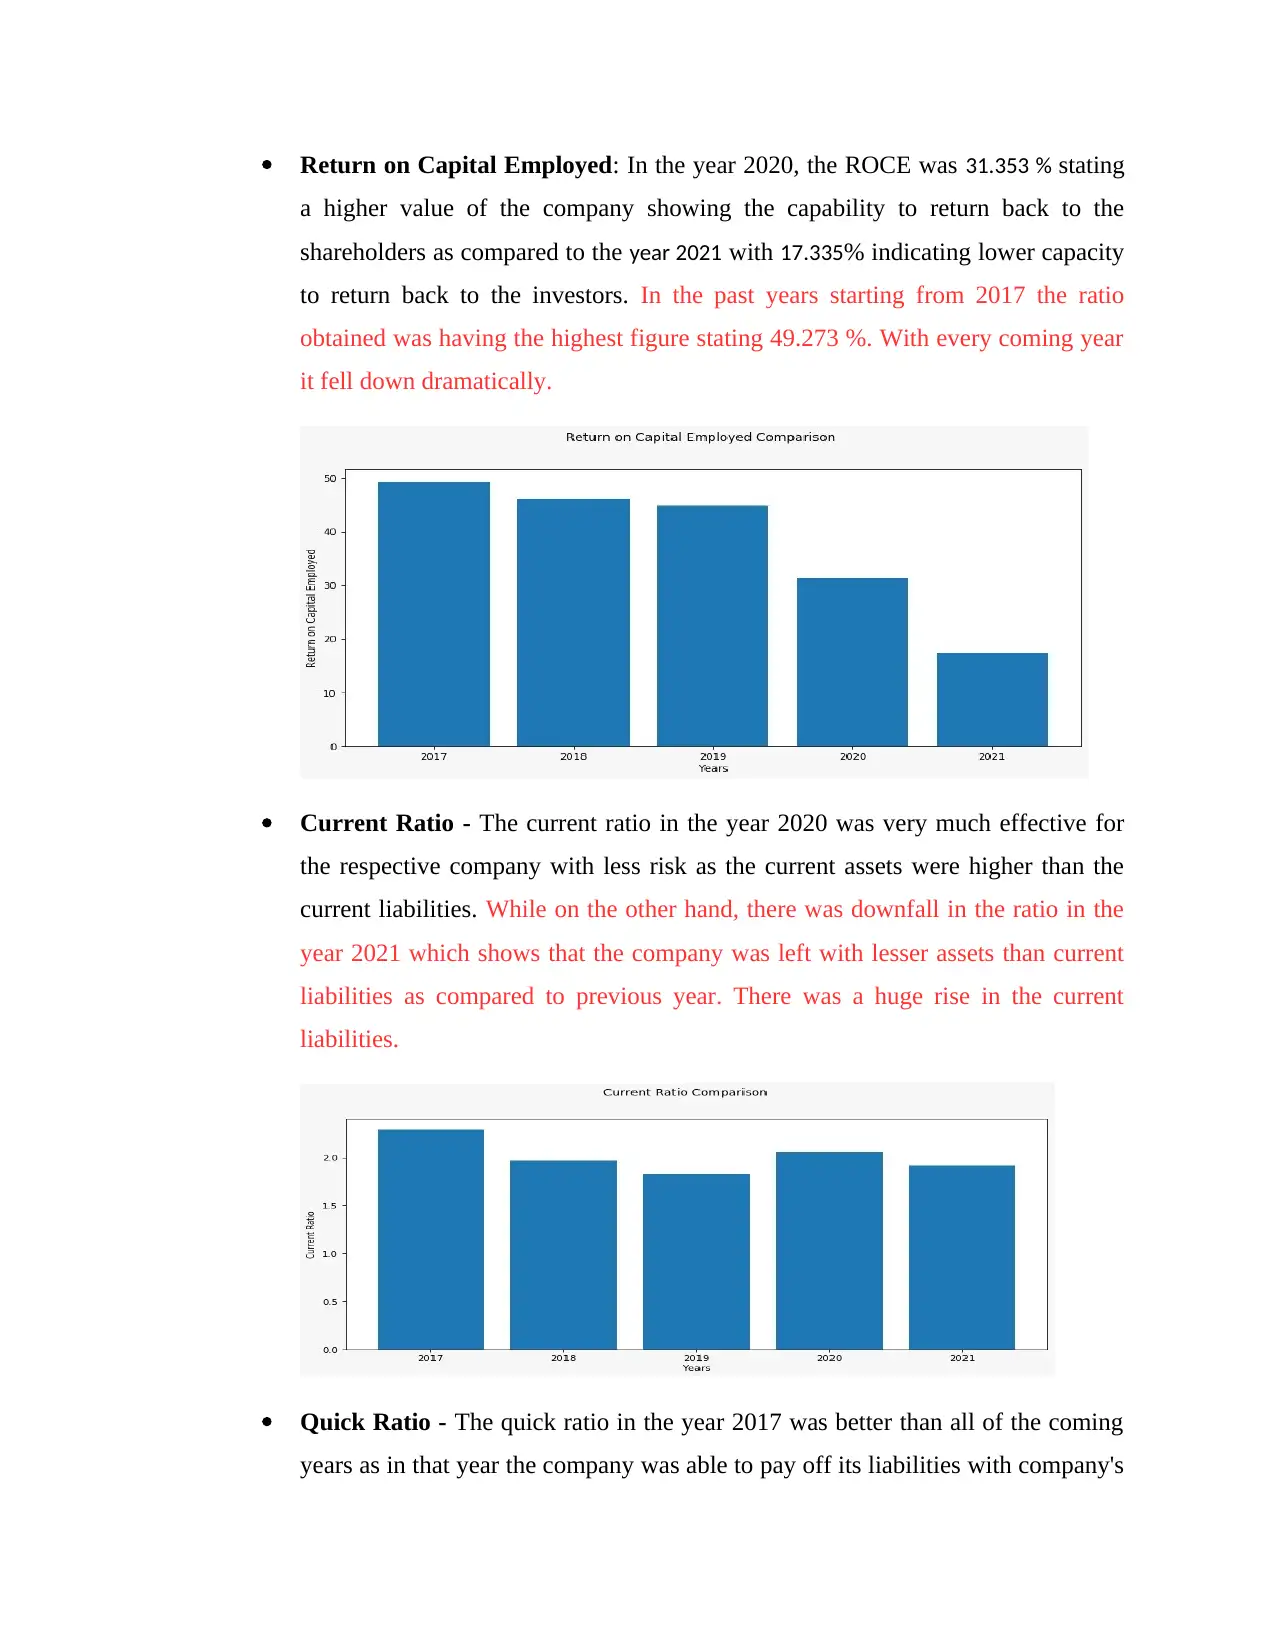
Return on Capital Employed: In the year 2020, the ROCE was 31.353 % stating
a higher value of the company showing the capability to return back to the
shareholders as compared to the year 2021 with 17.335% indicating lower capacity
to return back to the investors. In the past years starting from 2017 the ratio
obtained was having the highest figure stating 49.273 %. With every coming year
it fell down dramatically.
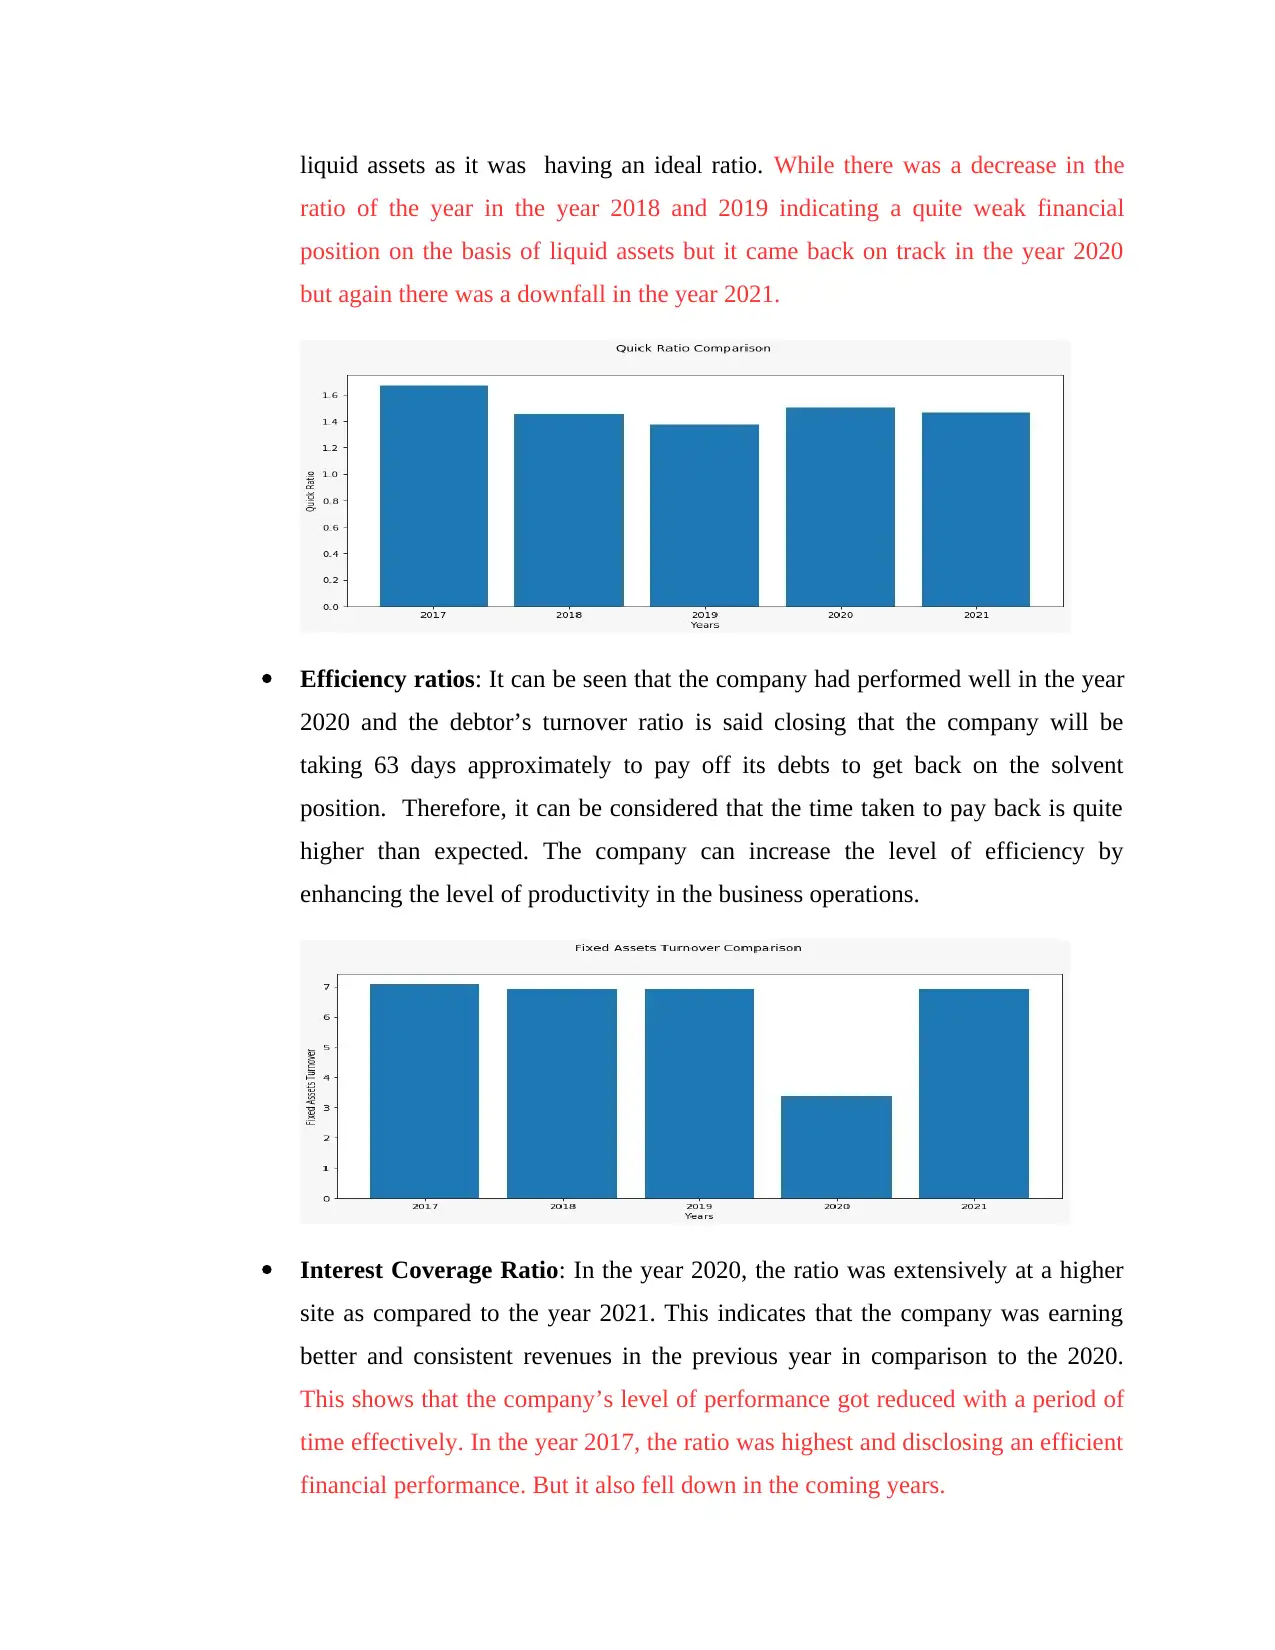
Current Ratio - The current ratio in the year 2020 was very much effective for
the respective company with less risk as the current assets were higher than the
current liabilities. While on the other hand, there was downfall in the ratio in the
year 2021 which shows that the company was left with lesser assets than current
liabilities as compared to previous year. There was a huge rise in the current
liabilities.
Quick Ratio - The quick ratio in the year 2017 was better than all of the coming
years as in that year the company was able to pay off its liabilities with company's
a higher value of the company showing the capability to return back to the
shareholders as compared to the year 2021 with 17.335% indicating lower capacity
to return back to the investors. In the past years starting from 2017 the ratio
obtained was having the highest figure stating 49.273 %. With every coming year
it fell down dramatically.
Current Ratio - The current ratio in the year 2020 was very much effective for
the respective company with less risk as the current assets were higher than the
current liabilities. While on the other hand, there was downfall in the ratio in the
year 2021 which shows that the company was left with lesser assets than current
liabilities as compared to previous year. There was a huge rise in the current
liabilities.
Quick Ratio - The quick ratio in the year 2017 was better than all of the coming
years as in that year the company was able to pay off its liabilities with company's
⊘ This is a preview!⊘
Do you want full access?
Subscribe today to unlock all pages.
Trusted by 1+ million students worldwide
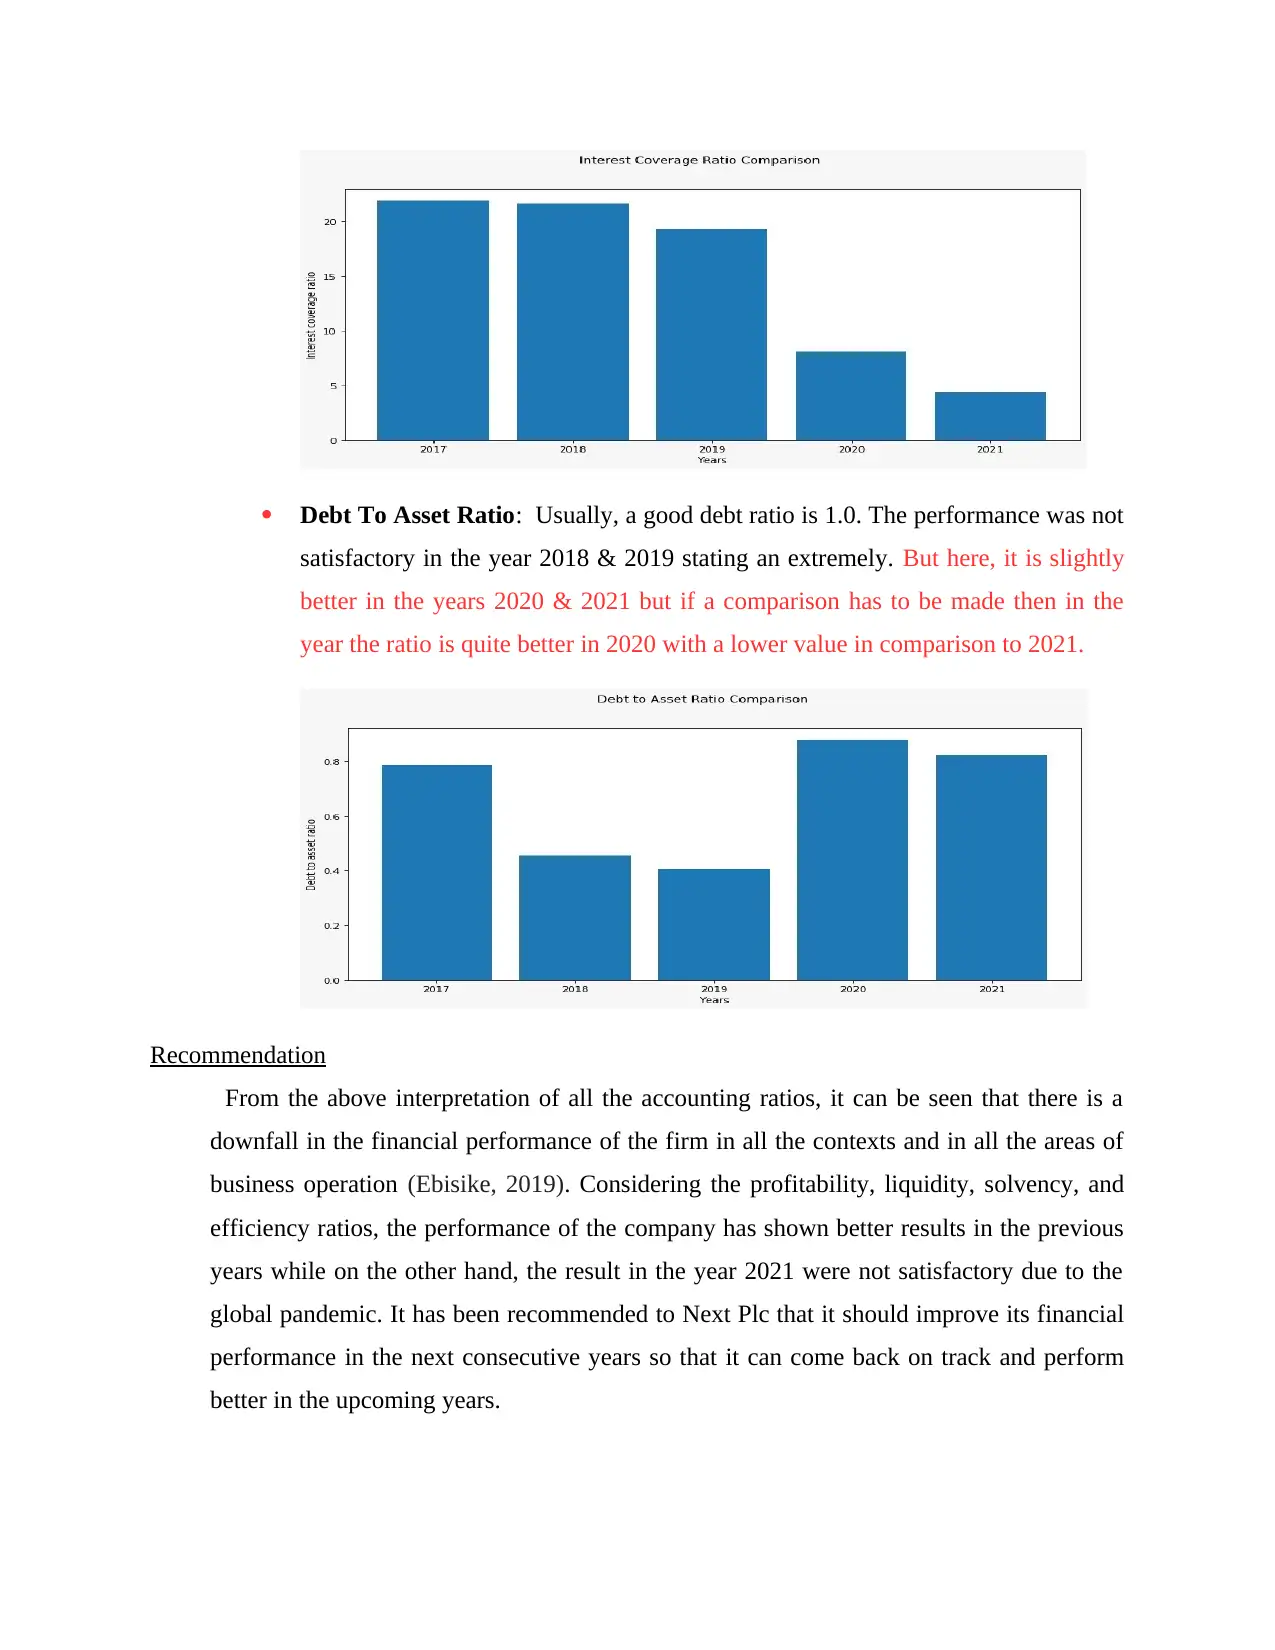
liquid assets as it was having an ideal ratio. While there was a decrease in the
ratio of the year in the year 2018 and 2019 indicating a quite weak financial
position on the basis of liquid assets but it came back on track in the year 2020
but again there was a downfall in the year 2021.
Efficiency ratios: It can be seen that the company had performed well in the year
2020 and the debtor’s turnover ratio is said closing that the company will be
taking 63 days approximately to pay off its debts to get back on the solvent
position. Therefore, it can be considered that the time taken to pay back is quite
higher than expected. The company can increase the level of efficiency by
enhancing the level of productivity in the business operations.
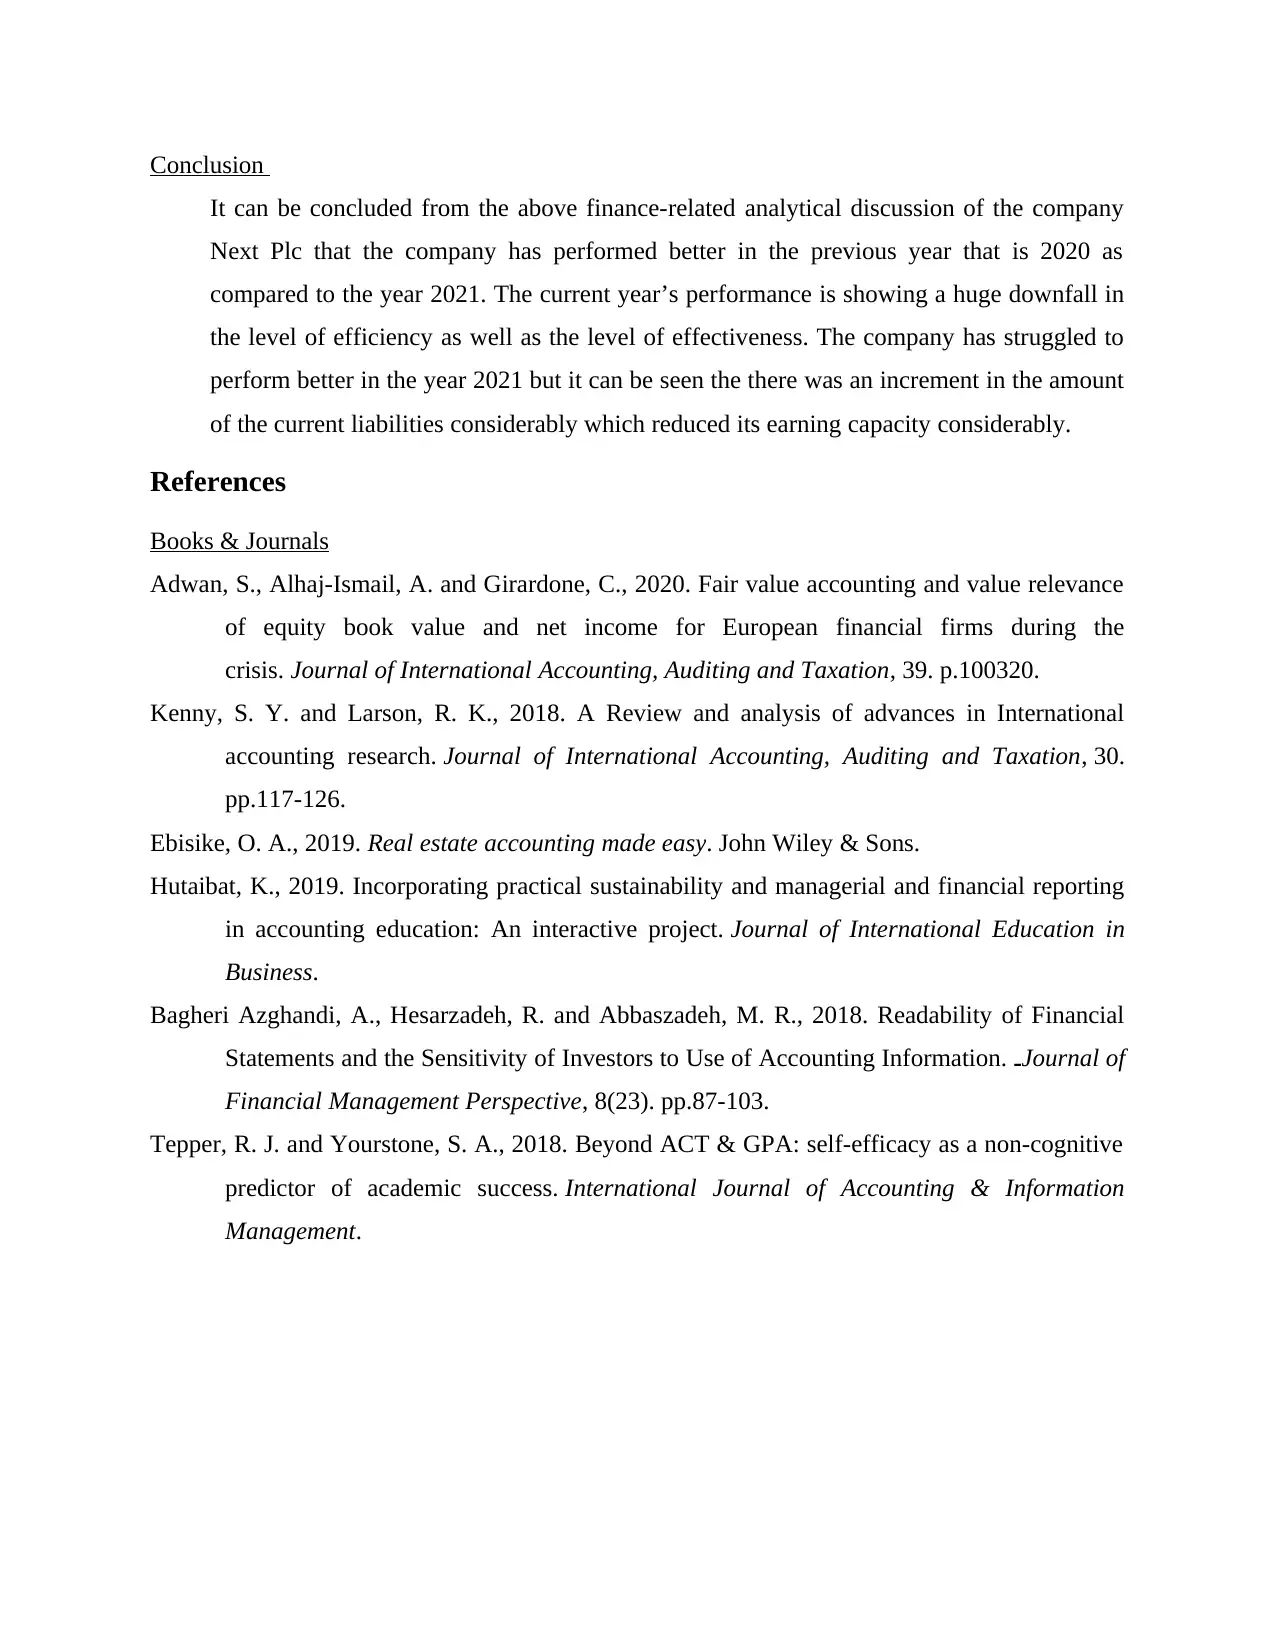
Interest Coverage Ratio: In the year 2020, the ratio was extensively at a higher
site as compared to the year 2021. This indicates that the company was earning
better and consistent revenues in the previous year in comparison to the 2020.
This shows that the company’s level of performance got reduced with a period of
time effectively. In the year 2017, the ratio was highest and disclosing an efficient
financial performance. But it also fell down in the coming years.
ratio of the year in the year 2018 and 2019 indicating a quite weak financial
position on the basis of liquid assets but it came back on track in the year 2020
but again there was a downfall in the year 2021.
Efficiency ratios: It can be seen that the company had performed well in the year
2020 and the debtor’s turnover ratio is said closing that the company will be
taking 63 days approximately to pay off its debts to get back on the solvent
position. Therefore, it can be considered that the time taken to pay back is quite
higher than expected. The company can increase the level of efficiency by
enhancing the level of productivity in the business operations.
Interest Coverage Ratio: In the year 2020, the ratio was extensively at a higher
site as compared to the year 2021. This indicates that the company was earning
better and consistent revenues in the previous year in comparison to the 2020.
This shows that the company’s level of performance got reduced with a period of
time effectively. In the year 2017, the ratio was highest and disclosing an efficient
financial performance. But it also fell down in the coming years.
Paraphrase This Document
Need a fresh take? Get an instant paraphrase of this document with our AI Paraphraser
Debt To Asset Ratio: Usually, a good debt ratio is 1.0. The performance was not
satisfactory in the year 2018 & 2019 stating an extremely. But here, it is slightly
better in the years 2020 & 2021 but if a comparison has to be made then in the
year the ratio is quite better in 2020 with a lower value in comparison to 2021.
Recommendation
From the above interpretation of all the accounting ratios, it can be seen that there is a
downfall in the financial performance of the firm in all the contexts and in all the areas of
business operation (Ebisike, 2019). Considering the profitability, liquidity, solvency, and
efficiency ratios, the performance of the company has shown better results in the previous
years while on the other hand, the result in the year 2021 were not satisfactory due to the
global pandemic. It has been recommended to Next Plc that it should improve its financial
performance in the next consecutive years so that it can come back on track and perform
better in the upcoming years.
Conclusion
It can be concluded from the above finance-related analytical discussion of the company
Next Plc that the company has performed better in the previous year that is 2020 as
compared to the year 2021. The current year’s performance is showing a huge downfall in
the level of efficiency as well as the level of effectiveness. The company has struggled to
perform better in the year 2021 but it can be seen the there was an increment in the amount
of the current liabilities considerably which reduced its earning capacity considerably.
References
Books & Journals
Adwan, S., Alhaj-Ismail, A. and Girardone, C., 2020. Fair value accounting and value relevance
of equity book value and net income for European financial firms during the
crisis. Journal of International Accounting, Auditing and Taxation, 39. p.100320.
Kenny, S. Y. and Larson, R. K., 2018. A Review and analysis of advances in International
accounting research. Journal of International Accounting, Auditing and Taxation, 30.
pp.117-126.
Ebisike, O. A., 2019. Real estate accounting made easy. John Wiley & Sons.
Hutaibat, K., 2019. Incorporating practical sustainability and managerial and financial reporting
in accounting education: An interactive project. Journal of International Education in
Business.
Bagheri Azghandi, A., Hesarzadeh, R. and Abbaszadeh, M. R., 2018. Readability of Financial
Statements and the Sensitivity of Investors to Use of Accounting Information. ـJournal of
Financial Management Perspective, 8(23). pp.87-103.
Tepper, R. J. and Yourstone, S. A., 2018. Beyond ACT & GPA: self-efficacy as a non-cognitive
predictor of academic success. International Journal of Accounting & Information
Management.
⊘ This is a preview!⊘
Do you want full access?
Subscribe today to unlock all pages.
Trusted by 1+ million students worldwide
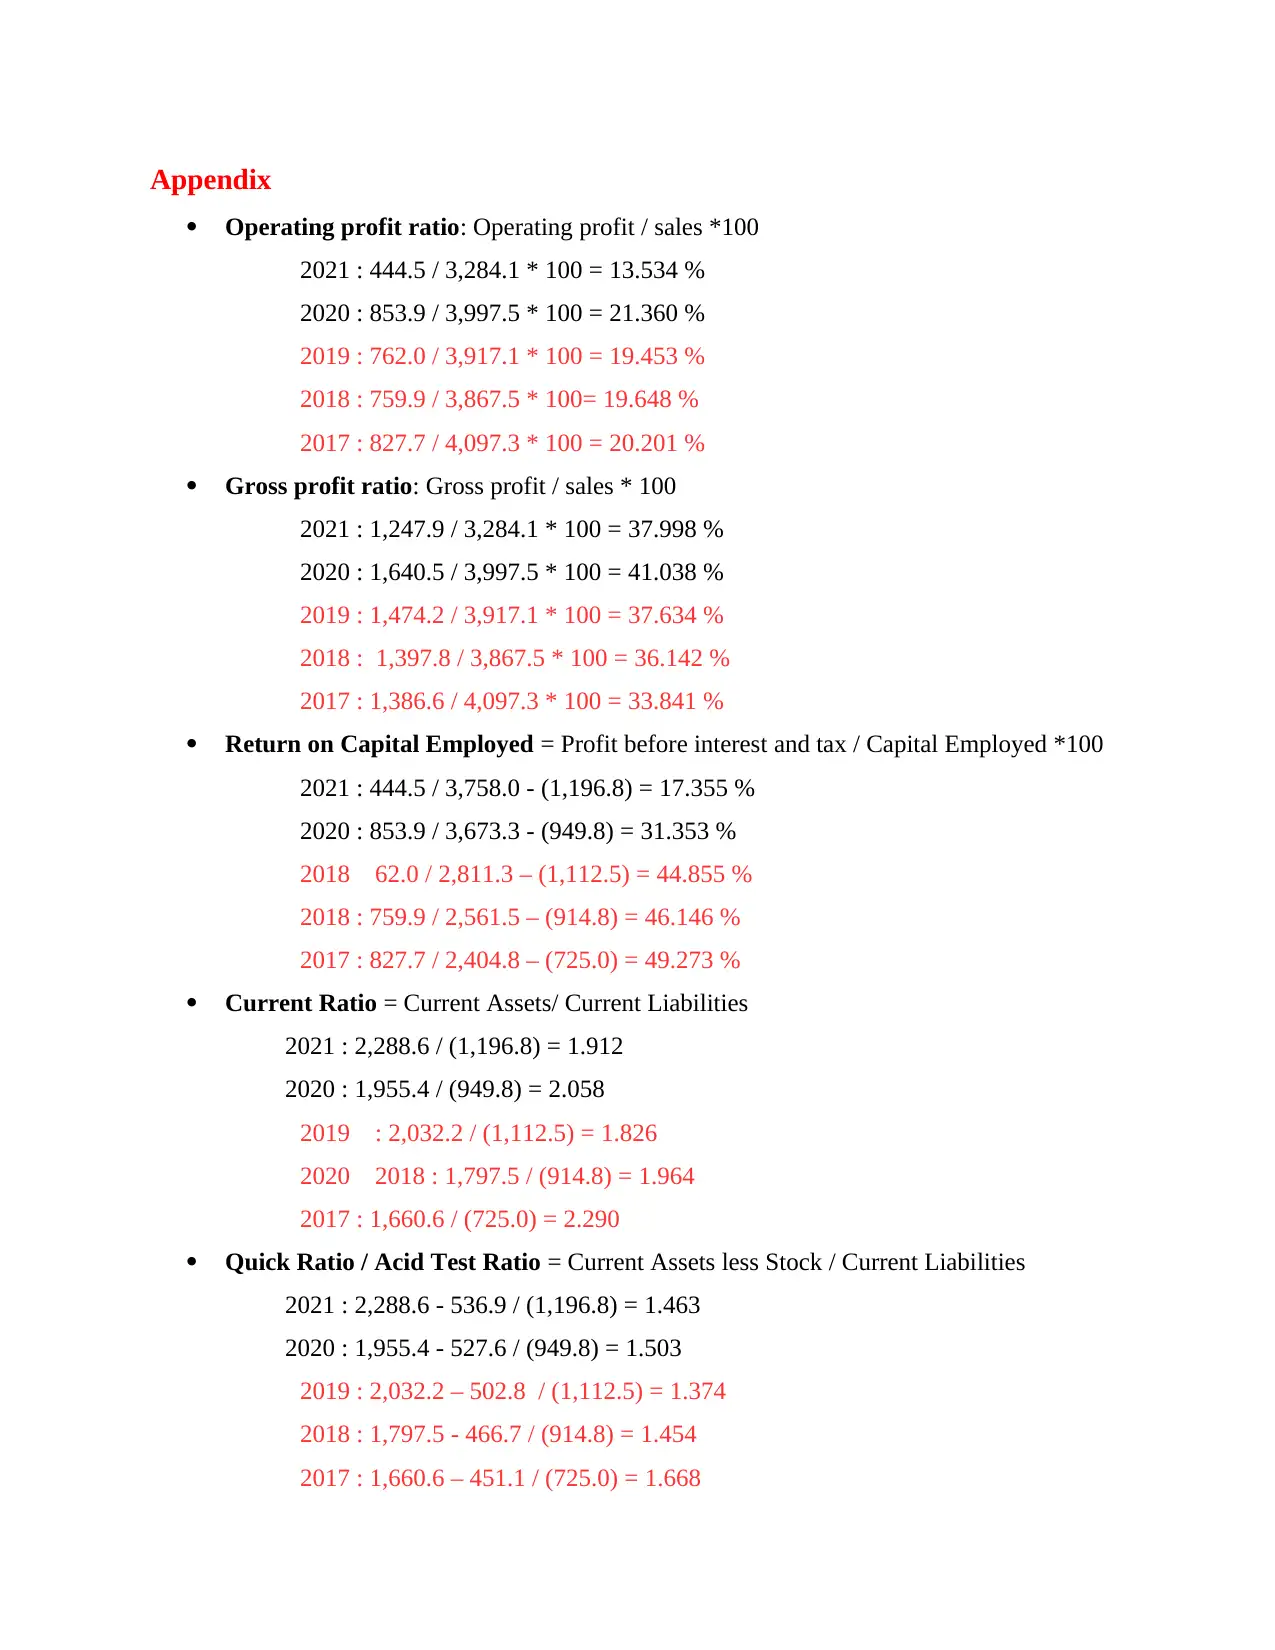
Appendix
Operating profit ratio: Operating profit / sales *100
2021 : 444.5 / 3,284.1 * 100 = 13.534 %
2020 : 853.9 / 3,997.5 * 100 = 21.360 %
2019 : 762.0 / 3,917.1 * 100 = 19.453 %
2018 : 759.9 / 3,867.5 * 100= 19.648 %
2017 : 827.7 / 4,097.3 * 100 = 20.201 %
Gross profit ratio: Gross profit / sales * 100
2021 : 1,247.9 / 3,284.1 * 100 = 37.998 %
2020 : 1,640.5 / 3,997.5 * 100 = 41.038 %
2019 : 1,474.2 / 3,917.1 * 100 = 37.634 %
2018 : 1,397.8 / 3,867.5 * 100 = 36.142 %
2017 : 1,386.6 / 4,097.3 * 100 = 33.841 %
Return on Capital Employed = Profit before interest and tax / Capital Employed *100
2021 : 444.5 / 3,758.0 - (1,196.8) = 17.355 %
2020 : 853.9 / 3,673.3 - (949.8) = 31.353 %
2018 62.0 / 2,811.3 – (1,112.5) = 44.855 %
2018 : 759.9 / 2,561.5 – (914.8) = 46.146 %
2017 : 827.7 / 2,404.8 – (725.0) = 49.273 %
Current Ratio = Current Assets/ Current Liabilities
2021 : 2,288.6 / (1,196.8) = 1.912
2020 : 1,955.4 / (949.8) = 2.058
2019 : 2,032.2 / (1,112.5) = 1.826
2020 2018 : 1,797.5 / (914.8) = 1.964
2017 : 1,660.6 / (725.0) = 2.290
Quick Ratio / Acid Test Ratio = Current Assets less Stock / Current Liabilities
2021 : 2,288.6 - 536.9 / (1,196.8) = 1.463
2020 : 1,955.4 - 527.6 / (949.8) = 1.503
2019 : 2,032.2 – 502.8 / (1,112.5) = 1.374
2018 : 1,797.5 - 466.7 / (914.8) = 1.454
2017 : 1,660.6 – 451.1 / (725.0) = 1.668
Paraphrase This Document
Need a fresh take? Get an instant paraphrase of this document with our AI Paraphraser
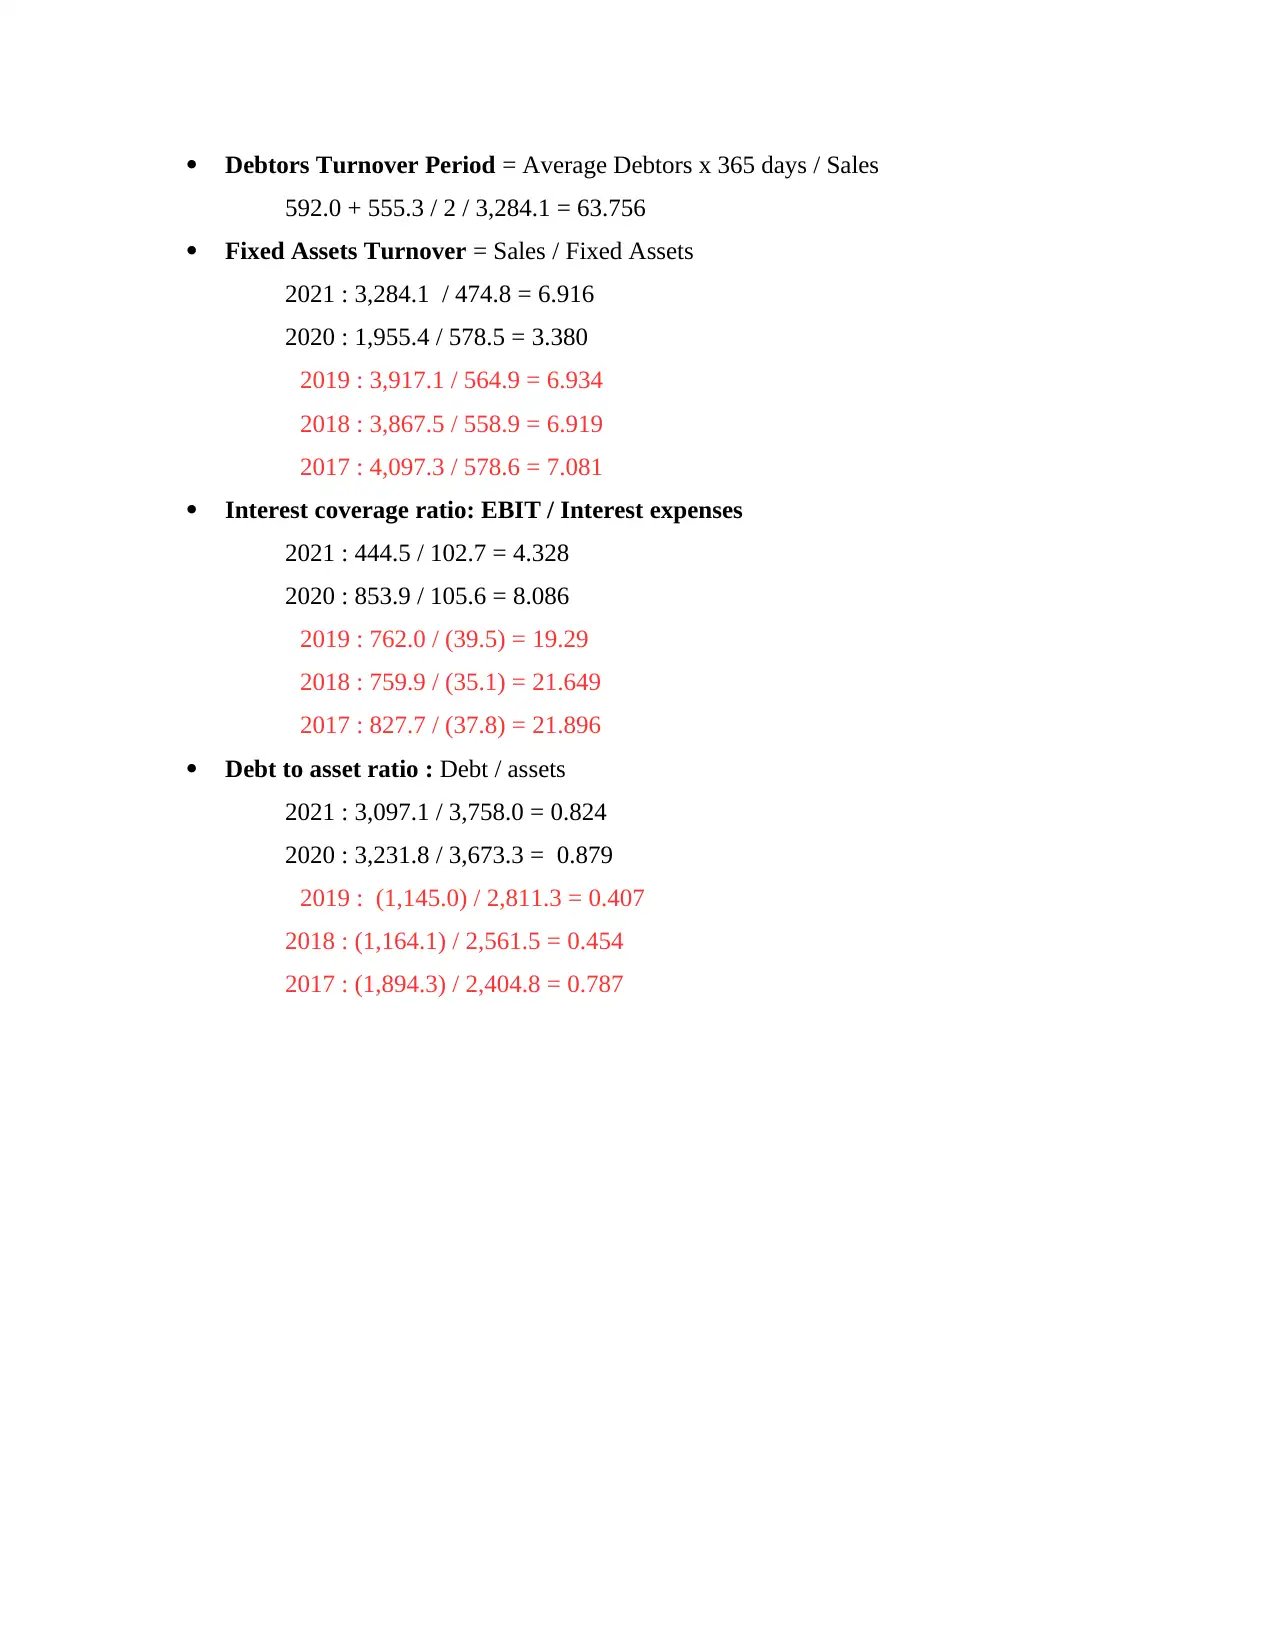
Debtors Turnover Period = Average Debtors x 365 days / Sales
592.0 + 555.3 / 2 / 3,284.1 = 63.756
Fixed Assets Turnover = Sales / Fixed Assets
2021 : 3,284.1 / 474.8 = 6.916
2020 : 1,955.4 / 578.5 = 3.380
2019 : 3,917.1 / 564.9 = 6.934
2018 : 3,867.5 / 558.9 = 6.919
2017 : 4,097.3 / 578.6 = 7.081
Interest coverage ratio: EBIT / Interest expenses
2021 : 444.5 / 102.7 = 4.328
2020 : 853.9 / 105.6 = 8.086
2019 : 762.0 / (39.5) = 19.29
2018 : 759.9 / (35.1) = 21.649
2017 : 827.7 / (37.8) = 21.896
Debt to asset ratio : Debt / assets
2021 : 3,097.1 / 3,758.0 = 0.824
2020 : 3,231.8 / 3,673.3 = 0.879
2019 : (1,145.0) / 2,811.3 = 0.407
2018 : (1,164.1) / 2,561.5 = 0.454
2017 : (1,894.3) / 2,404.8 = 0.787

⊘ This is a preview!⊘
Do you want full access?
Subscribe today to unlock all pages.
Trusted by 1+ million students worldwide
1 out of 12
Related Documents


Your All-in-One AI-Powered Toolkit for Academic Success.
+13062052269
info@desklib.com
Available 24*7 on WhatsApp / Email
![[object Object]](/_next/static/media/star-bottom.7253800d.svg)
Unlock your academic potential
Copyright © 2020–2026 A2Z Services. All Rights Reserved. Developed and managed by ZUCOL.