Financial Accounting Report: Investment Appraisal and Analysis
VerifiedAdded on 2023/01/05
|16
|3721
|79
Report
AI Summary
This report is a comprehensive financial accounting analysis, divided into three parts. Part A focuses on the income statement and financial position, including calculations of depreciation and income tax. It presents the income statement for the year ending December 31, 2019, and the balance sheet as of the same date. Part B delves into break-even analysis, calculating the break-even point and margin of safety, along with an analysis of a proposed business strategy. It includes calculations of contribution margin and profit under different scenarios. Part C discusses capital investment appraisal methods, exploring their merits and demerits, and also examines the limitations and benefits of using budgets for strategic planning. The report aims to provide a thorough understanding of financial accounting principles and their application.

UGB 163
Paraphrase This Document
Need a fresh take? Get an instant paraphrase of this document with our AI Paraphraser
Table of Contents
Introduction......................................................................................................................................3
Part A...............................................................................................................................................4
Part B...............................................................................................................................................9
PART 3..........................................................................................................................................11
a. Calculation for different investment appraisal techniques such as payback period, net
present value and accounting rate of return...............................................................................11
b. Explanation of all the limitations and merits of different techniques of investment appraisal
...................................................................................................................................................13
c. All the limitations and benefits of using budgets as the tool for strategic planning..............14
Conclusion.....................................................................................................................................15
REFERENCES..............................................................................................................................16
Introduction
Financial accounting is a specific branch of accounting involving a process of recording,
summarizing, and reporting the myriad of transactions resulting from business operations over a
period of time. These exchanges are provided in the design of the balance sheet summaries,
including the accounting report, the pay explanation, and the revenue claim, which records the
presentation of the organization's work in the pre-defined time.
Financial accounting uses incremental accounting rates. The choice of accounting
standards to be applied in accounting depends on the administrative and detailed requirements
that the sector faces. For US government agencies, organizations are required to save in
accordance with rigorous accounting standards (GAAP). The basis of these accounting standards
is to provide stable data to speculators, lenders, regulators and cost experts.
The financial statements used in cash accounting reflect the five main orders of cash
information: income, expenses, resources, liabilities, and value. Income and expenses are
represented and written on the payment definition. They can take everything from research and
development to finance.
Financial accounting determines total profitability at the lower end of the payment
definition. Resources, liabilities and accounts of value are accounted for in the cash register. The
cash register uses the cash reserves to account for liability for the organization's future financial
benefits.
The main objective of this report is to understand fundamental models, concepts and
techniques used in financial accounting and understanding the role of finance at local and
international level. The project report is divided into three parts; Part A, B and C. Where, Part A
discusses about income statement and financial position of the company. Part B is based on
analyses of break-even point and margin of safety. The final Part C is based on discussion of
capital investment appraisal methods. This part also discusses about merits and demerits of
investment appraisal techniques.
⊘ This is a preview!⊘
Do you want full access?
Subscribe today to unlock all pages.
Trusted by 1+ million students worldwide
Part A
Income statement:
The income statement is one of three significant tax summaries used to denote the presentation
of an organization’s cash in a particular accounting period, with the other two key statements
being the accounting report and the income statement. Also known as a benefit and misfortune
claim or income and expense claim, the payment call focuses specifically on the organization’s
income and expenses at a particular point in time.
The income statement is an important part of a group's performance reporting reports that
must be submitted to the Securities and Exchange Commission (SEC). While cash flow provides
the representation of an organization’s financial data as a specific date, salary definition reports
pay over a specific period of time and its headline shows the range.
The income statement is based on four main elements: income, expenses, additions and
disadvantages. It does not distinguish between cash and non-cash receipts (real money versus
loan offers) or cash payments / payments versus non-cash payments (real money versus layaway
purchases). Start with the subtleties of the contracts and then work your way up to measuring net
earnings and, in the long run, earnings per share (EPS). In essence, it provides a table of how the
organization's recognized income has been converted to net income (profit or deficit).
Revenues and Gains
The next ones are folded into a salary structure, but its arrangement may vary depending on a
neighbor's administrative prerequisites, extension of scope of activity and associated years of
work:
Operating Revenue
Income recognized through essential exercises is often referred to as earned income. For an
organization that manufactures an item, or for a circulator, trader or retailer that is busy selling
that item, the income from essential businesses refers to the income- in from offering the thing.
Also, for an organization (or their friends) that is busy with an administrative offer, the income
from an essential business refers to the income or expenses received in exchange for trading
those administrations offered.
Non-Operating Revenue
Paraphrase This Document
Need a fresh take? Get an instant paraphrase of this document with our AI Paraphraser
Revenue recognized through elective and non-selective industries is regularly referred to as non-
business income. This income is derived from profits outside the purchase and supply of goods
and enterprises and may include the earning of the income earned on the corporate capital
employed. in the bank, the rent from the business funds, the payment of principal associations
such as receipts for prestigious contributions or payment from an advertisement posted on a
company premises.
Gains
Also called other income, gains indicate the net money made from other activities, such as the
provision of long-range facilities. These include the net profit recognized by one-time non-
commercial businesses, such as an organization that sells its old transport van, unused land, or
support group.
Income should not be confused with income. Revenue is usually accounted for in the
period in which agreements are entered into or benefits are transferred. Receipts are the money
received and are represented when the money is received. For example, a customer can take
goods / administrations from an organization on September 28th, which requires the revenue
represented over the long term of September. Due to its high reputation, the customer may be
offered a 30-day lead time. It will take him until October 28 to make the allowance, which is
when the money will be represented.
Expenses and Losses
A company is called a cost to run the business and make money. Some of these costs may be
discounted on an expense form if they comply with IRS rules.
Primary Activity Expenses
All costs incurred in providing the normal operating income related to the essential activities of
the company Include product sales costs (COGS), sales, general and authoritative expenses
(SG&A) ), depreciation or impairment, and innovative labor costs (R&D). The common causes
of the downturn are representative salaries, business commissions, and costs for services such as
energy and transportation.
Secondary Activity Expenses
All costs associated with non-media commercial establishments, similar to the price paid in cash
on credit.
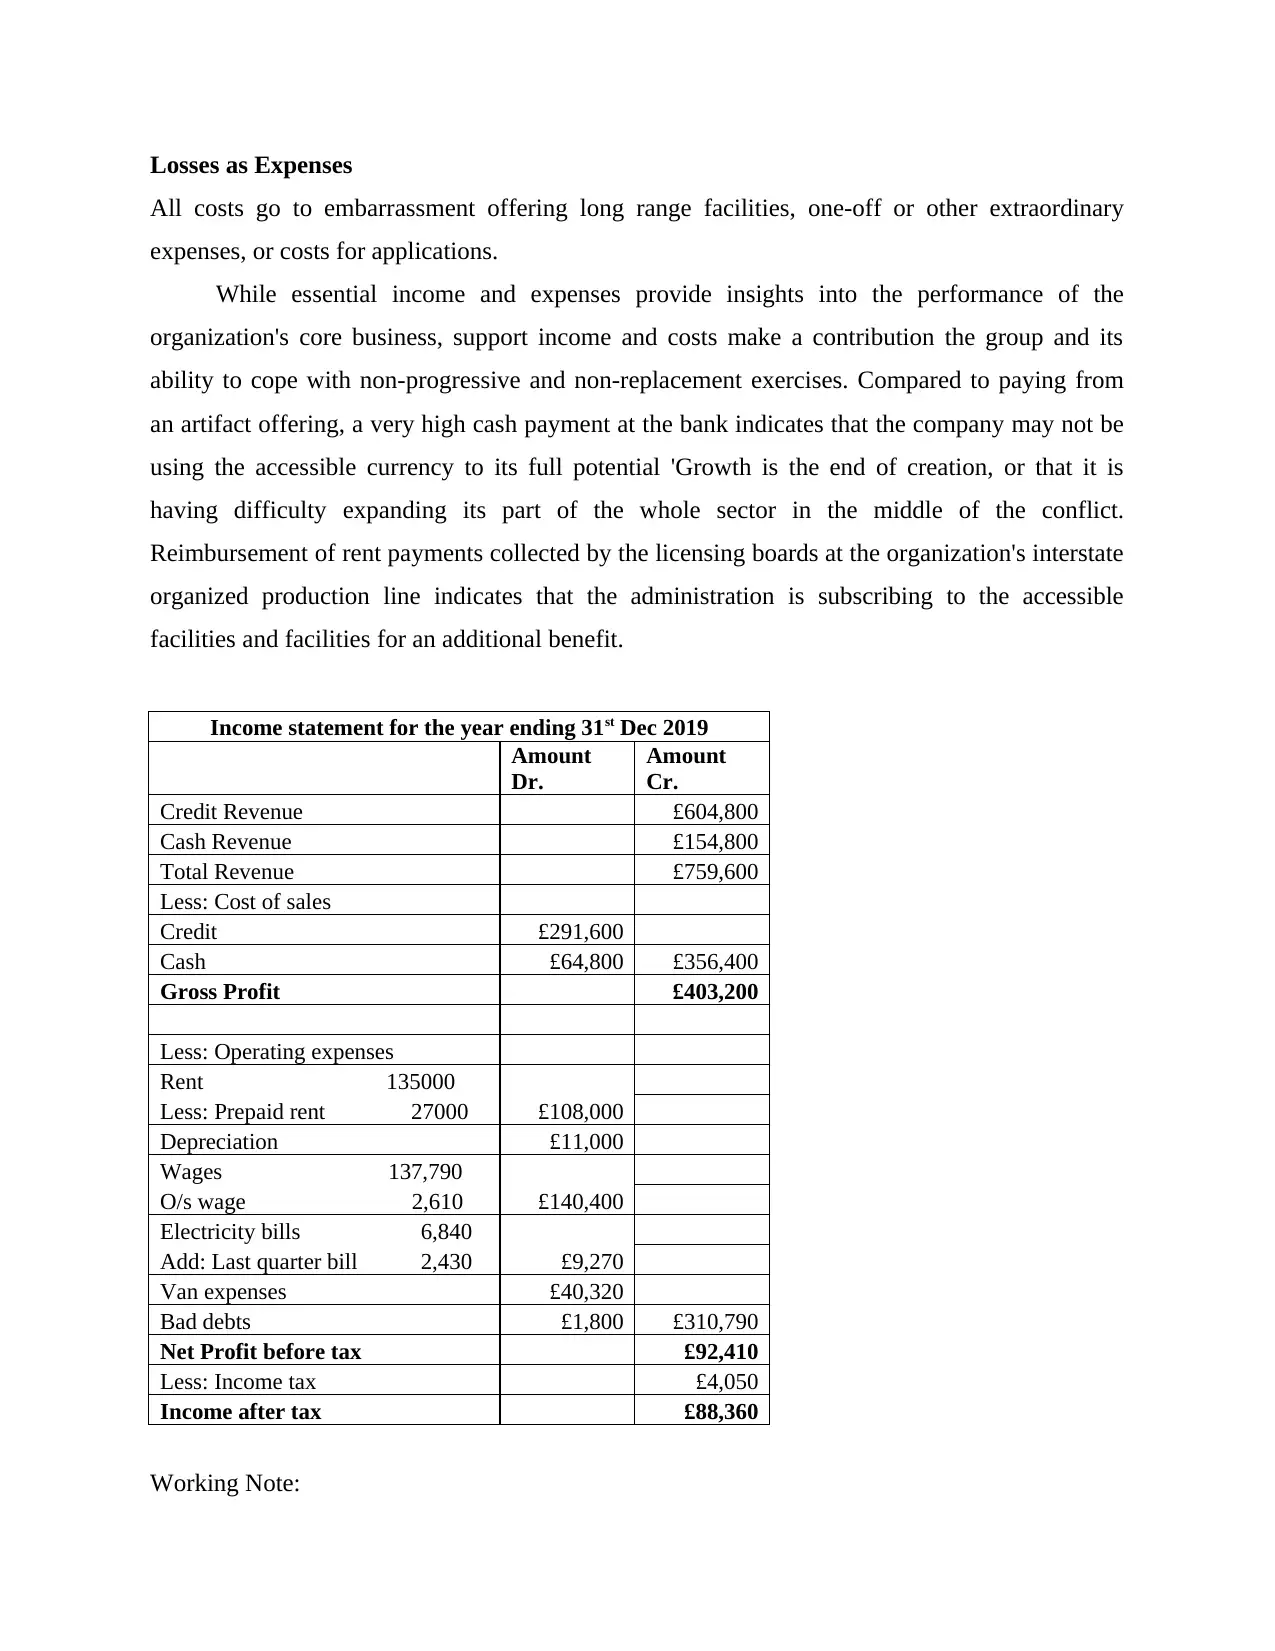
Losses as Expenses
All costs go to embarrassment offering long range facilities, one-off or other extraordinary
expenses, or costs for applications.
While essential income and expenses provide insights into the performance of the
organization's core business, support income and costs make a contribution the group and its
ability to cope with non-progressive and non-replacement exercises. Compared to paying from
an artifact offering, a very high cash payment at the bank indicates that the company may not be
using the accessible currency to its full potential 'Growth is the end of creation, or that it is
having difficulty expanding its part of the whole sector in the middle of the conflict.
Reimbursement of rent payments collected by the licensing boards at the organization's interstate
organized production line indicates that the administration is subscribing to the accessible
facilities and facilities for an additional benefit.
Income statement for the year ending 31st Dec 2019
Amount
Dr.
Amount
Cr.
Credit Revenue £604,800
Cash Revenue £154,800
Total Revenue £759,600
Less: Cost of sales
Credit £291,600
Cash £64,800 £356,400
Gross Profit £403,200
Less: Operating expenses
Rent 135000
Less: Prepaid rent 27000 £108,000
Depreciation £11,000
Wages 137,790
O/s wage 2,610 £140,400
Electricity bills 6,840
Add: Last quarter bill 2,430 £9,270
Van expenses £40,320
Bad debts £1,800 £310,790
Net Profit before tax £92,410
Less: Income tax £4,050
Income after tax £88,360
Working Note:
⊘ This is a preview!⊘
Do you want full access?
Subscribe today to unlock all pages.
Trusted by 1+ million students worldwide
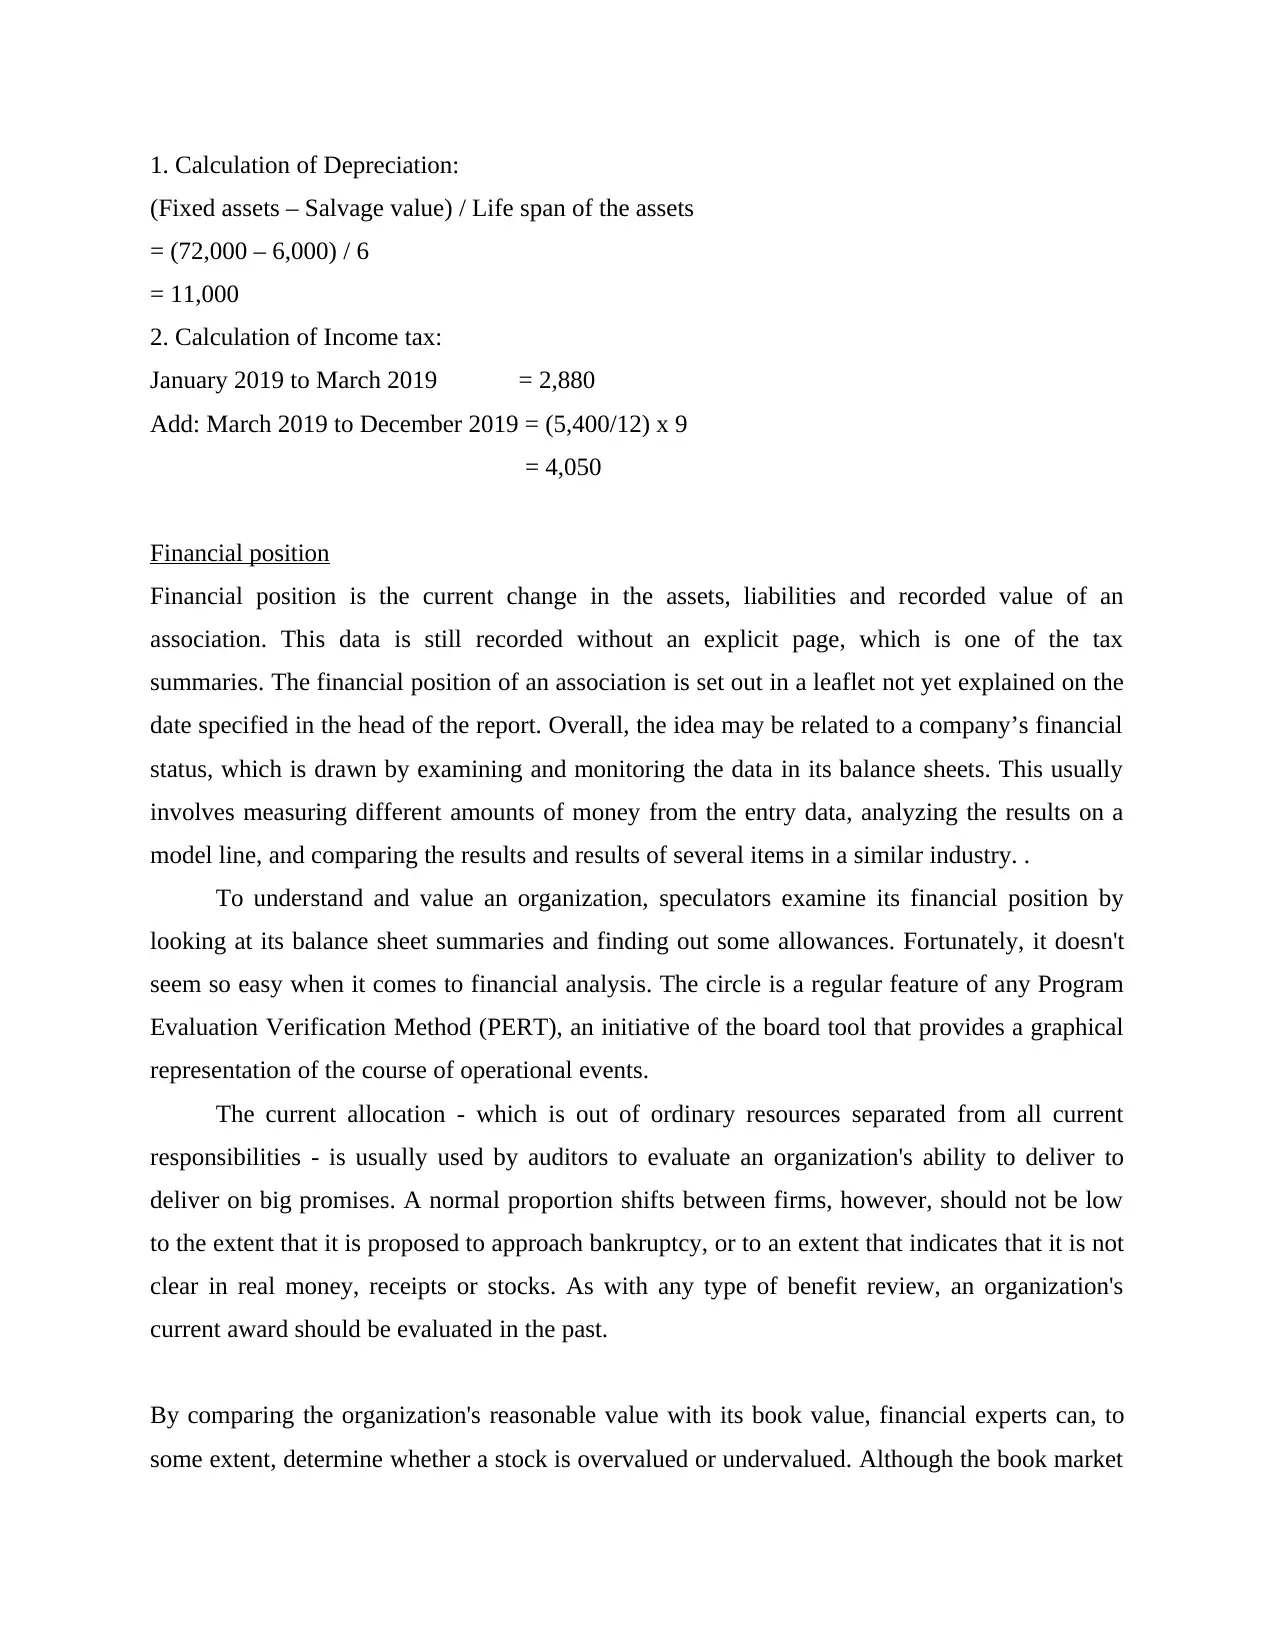
1. Calculation of Depreciation:
(Fixed assets – Salvage value) / Life span of the assets
= (72,000 – 6,000) / 6
= 11,000
2. Calculation of Income tax:
January 2019 to March 2019 = 2,880
Add: March 2019 to December 2019 = (5,400/12) x 9
= 4,050
Financial position
Financial position is the current change in the assets, liabilities and recorded value of an
association. This data is still recorded without an explicit page, which is one of the tax
summaries. The financial position of an association is set out in a leaflet not yet explained on the
date specified in the head of the report. Overall, the idea may be related to a company’s financial
status, which is drawn by examining and monitoring the data in its balance sheets. This usually
involves measuring different amounts of money from the entry data, analyzing the results on a
model line, and comparing the results and results of several items in a similar industry. .
To understand and value an organization, speculators examine its financial position by
looking at its balance sheet summaries and finding out some allowances. Fortunately, it doesn't
seem so easy when it comes to financial analysis. The circle is a regular feature of any Program
Evaluation Verification Method (PERT), an initiative of the board tool that provides a graphical
representation of the course of operational events.
The current allocation - which is out of ordinary resources separated from all current
responsibilities - is usually used by auditors to evaluate an organization's ability to deliver to
deliver on big promises. A normal proportion shifts between firms, however, should not be low
to the extent that it is proposed to approach bankruptcy, or to an extent that indicates that it is not
clear in real money, receipts or stocks. As with any type of benefit review, an organization's
current award should be evaluated in the past.
By comparing the organization's reasonable value with its book value, financial experts can, to
some extent, determine whether a stock is overvalued or undervalued. Although the book market
Paraphrase This Document
Need a fresh take? Get an instant paraphrase of this document with our AI Paraphraser
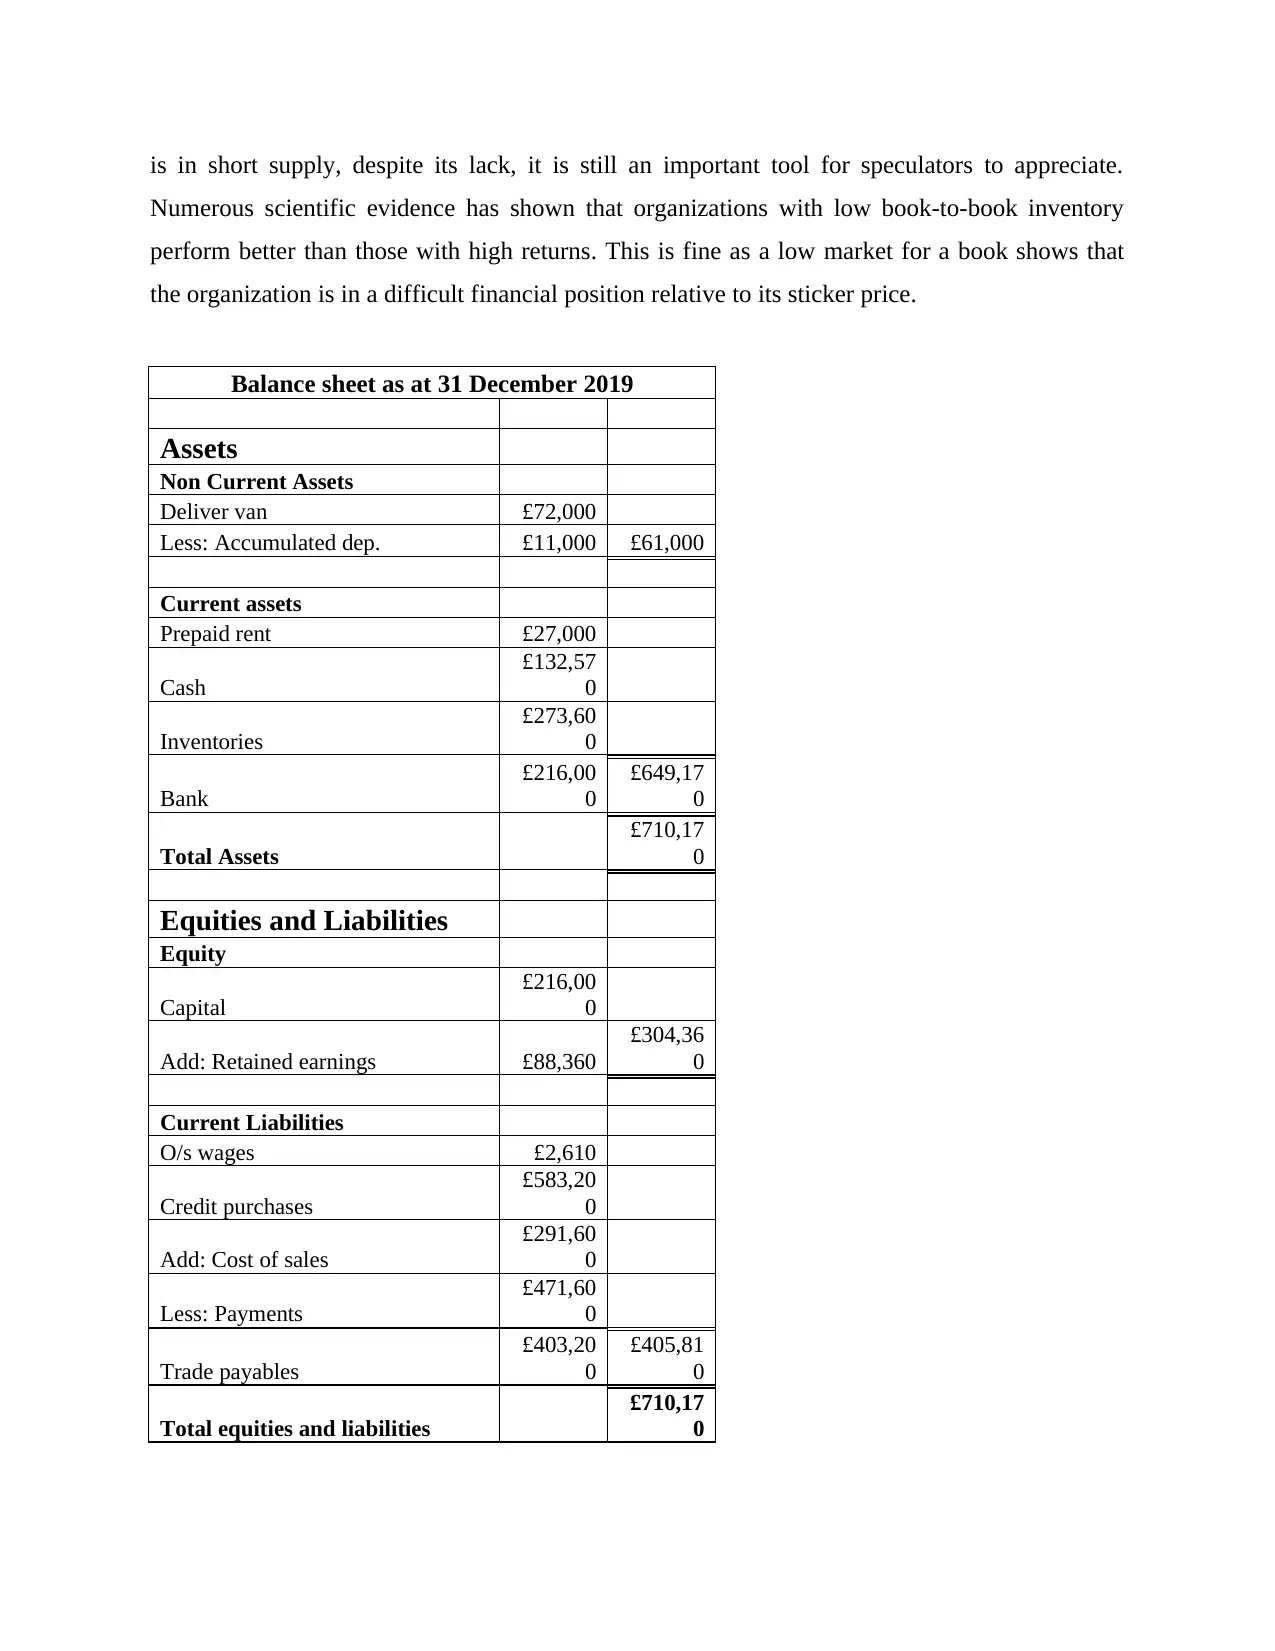
is in short supply, despite its lack, it is still an important tool for speculators to appreciate.
Numerous scientific evidence has shown that organizations with low book-to-book inventory
perform better than those with high returns. This is fine as a low market for a book shows that
the organization is in a difficult financial position relative to its sticker price.
Balance sheet as at 31 December 2019
Assets
Non Current Assets
Deliver van £72,000
Less: Accumulated dep. £11,000 £61,000
Current assets
Prepaid rent £27,000
Cash
£132,57
0
Inventories
£273,60
0
Bank
£216,00
0
£649,17
0
Total Assets
£710,17
0
Equities and Liabilities
Equity
Capital
£216,00
0
Add: Retained earnings £88,360
£304,36
0
Current Liabilities
O/s wages £2,610
Credit purchases
£583,20
0
Add: Cost of sales
£291,60
0
Less: Payments
£471,60
0
Trade payables
£403,20
0
£405,81
0
Total equities and liabilities
£710,17
0
Working Note:
1. Calculation of closing stock:
Inventories purchases – Cost of sales = Closing stock
(583,200 + 46,800) – (291,600 + 64,800) = Closing stock
Closing stock = 273,600
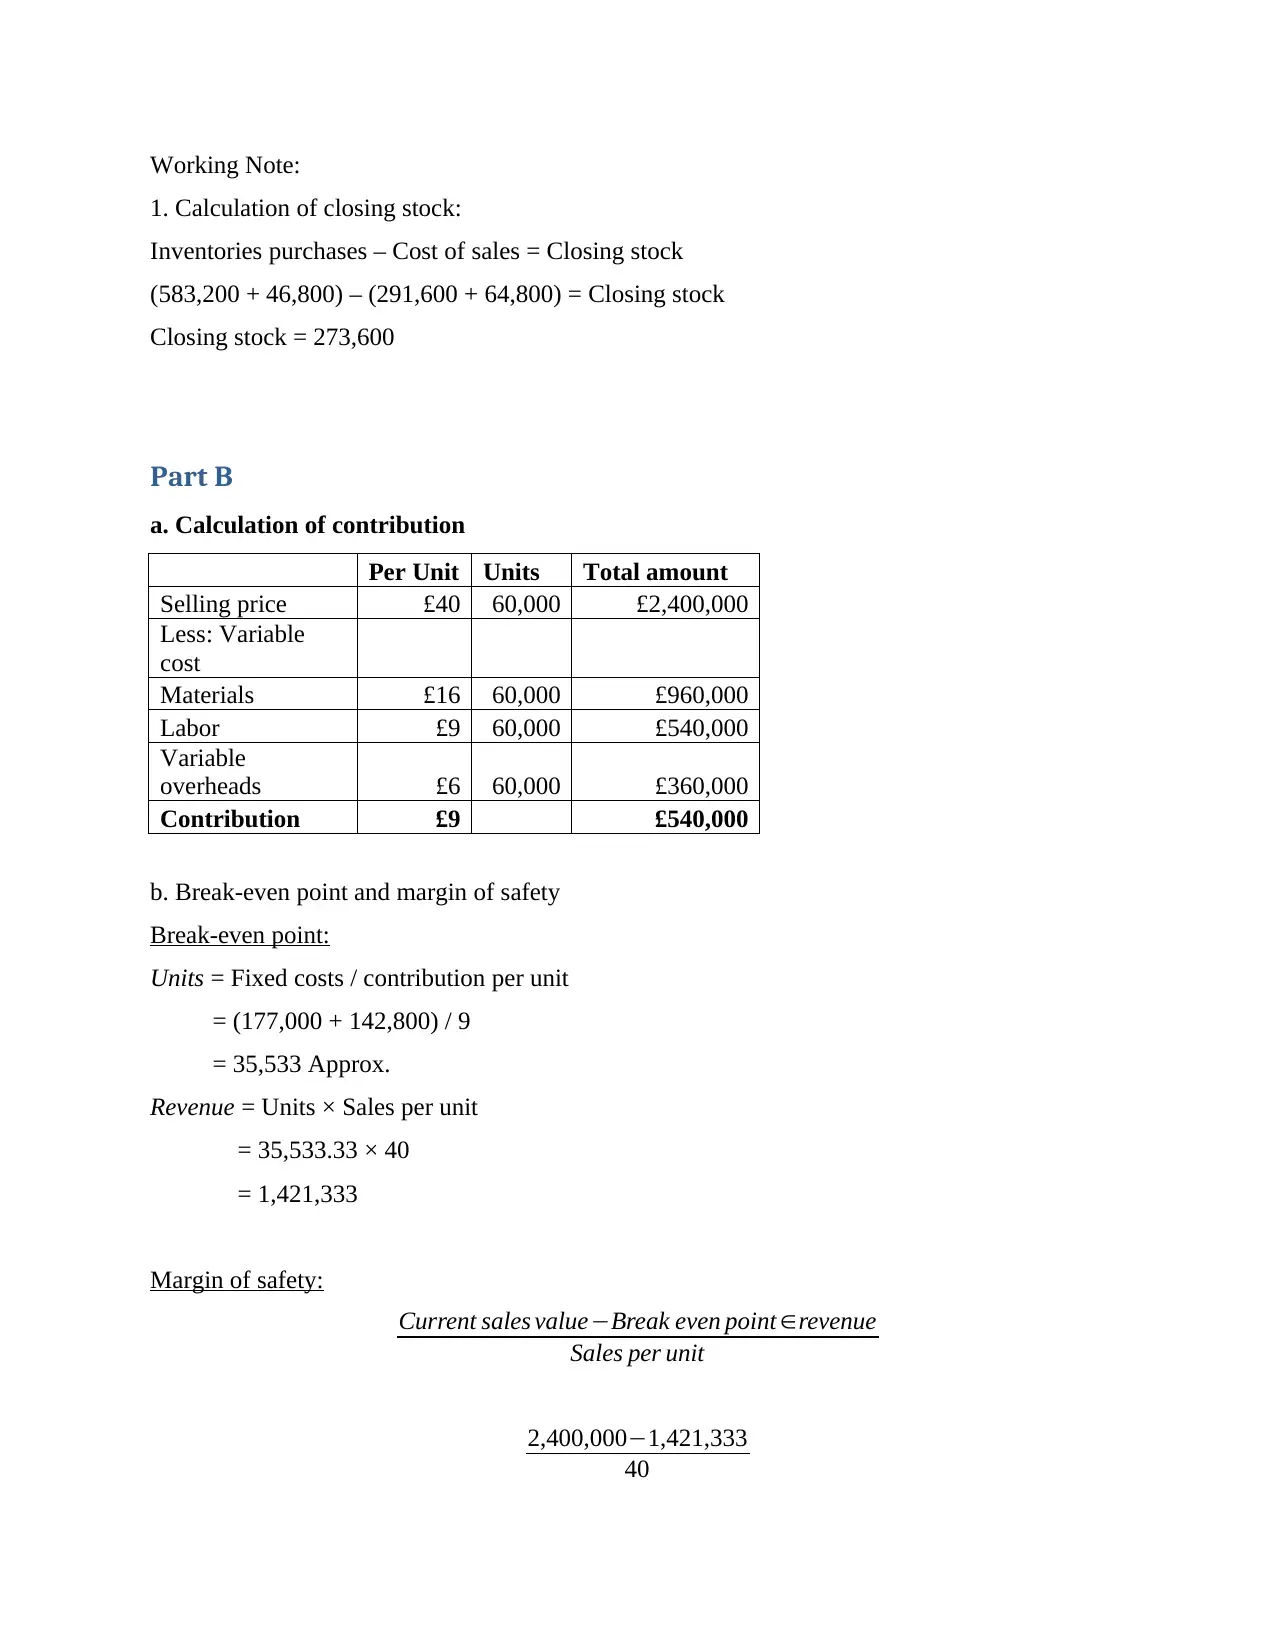
Part B
a. Calculation of contribution
Per Unit Units Total amount
Selling price £40 60,000 £2,400,000
Less: Variable
cost
Materials £16 60,000 £960,000
Labor £9 60,000 £540,000
Variable
overheads £6 60,000 £360,000
Contribution £9 £540,000
b. Break-even point and margin of safety
Break-even point:
Units = Fixed costs / contribution per unit
= (177,000 + 142,800) / 9
= 35,533 Approx.
Revenue = Units × Sales per unit
= 35,533.33 × 40
= 1,421,333
Margin of safety:
Current sales value−Break even point ∈revenue
Sales per unit
2,400,000−1,421,333
40
1. Calculation of closing stock:
Inventories purchases – Cost of sales = Closing stock
(583,200 + 46,800) – (291,600 + 64,800) = Closing stock
Closing stock = 273,600
Part B
a. Calculation of contribution
Per Unit Units Total amount
Selling price £40 60,000 £2,400,000
Less: Variable
cost
Materials £16 60,000 £960,000
Labor £9 60,000 £540,000
Variable
overheads £6 60,000 £360,000
Contribution £9 £540,000
b. Break-even point and margin of safety
Break-even point:
Units = Fixed costs / contribution per unit
= (177,000 + 142,800) / 9
= 35,533 Approx.
Revenue = Units × Sales per unit
= 35,533.33 × 40
= 1,421,333
Margin of safety:
Current sales value−Break even point ∈revenue
Sales per unit
2,400,000−1,421,333
40
⊘ This is a preview!⊘
Do you want full access?
Subscribe today to unlock all pages.
Trusted by 1+ million students worldwide
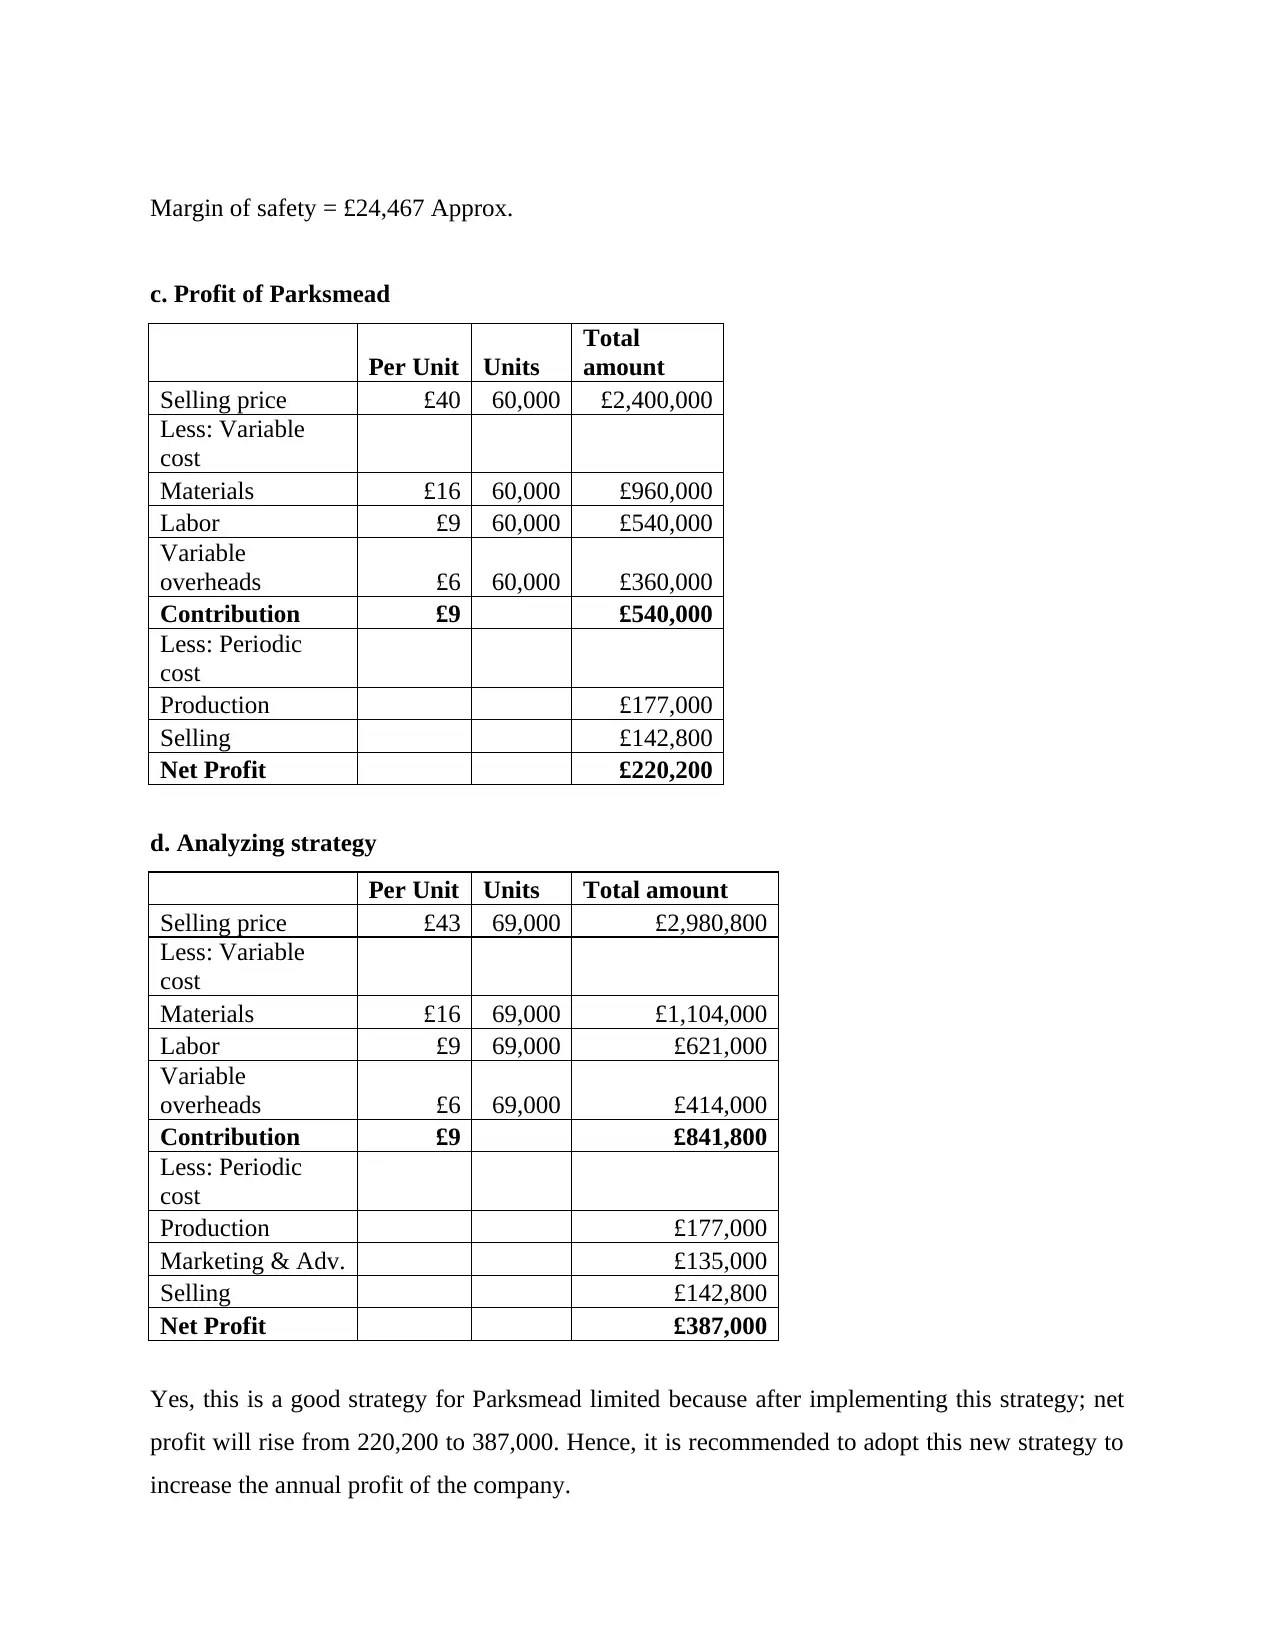
Margin of safety = £24,467 Approx.
c. Profit of Parksmead
Per Unit Units
Total
amount
Selling price £40 60,000 £2,400,000
Less: Variable
cost
Materials £16 60,000 £960,000
Labor £9 60,000 £540,000
Variable
overheads £6 60,000 £360,000
Contribution £9 £540,000
Less: Periodic
cost
Production £177,000
Selling £142,800
Net Profit £220,200
d. Analyzing strategy
Per Unit Units Total amount
Selling price £43 69,000 £2,980,800
Less: Variable
cost
Materials £16 69,000 £1,104,000
Labor £9 69,000 £621,000
Variable
overheads £6 69,000 £414,000
Contribution £9 £841,800
Less: Periodic
cost
Production £177,000
Marketing & Adv. £135,000
Selling £142,800
Net Profit £387,000
Yes, this is a good strategy for Parksmead limited because after implementing this strategy; net
profit will rise from 220,200 to 387,000. Hence, it is recommended to adopt this new strategy to
increase the annual profit of the company.
Paraphrase This Document
Need a fresh take? Get an instant paraphrase of this document with our AI Paraphraser
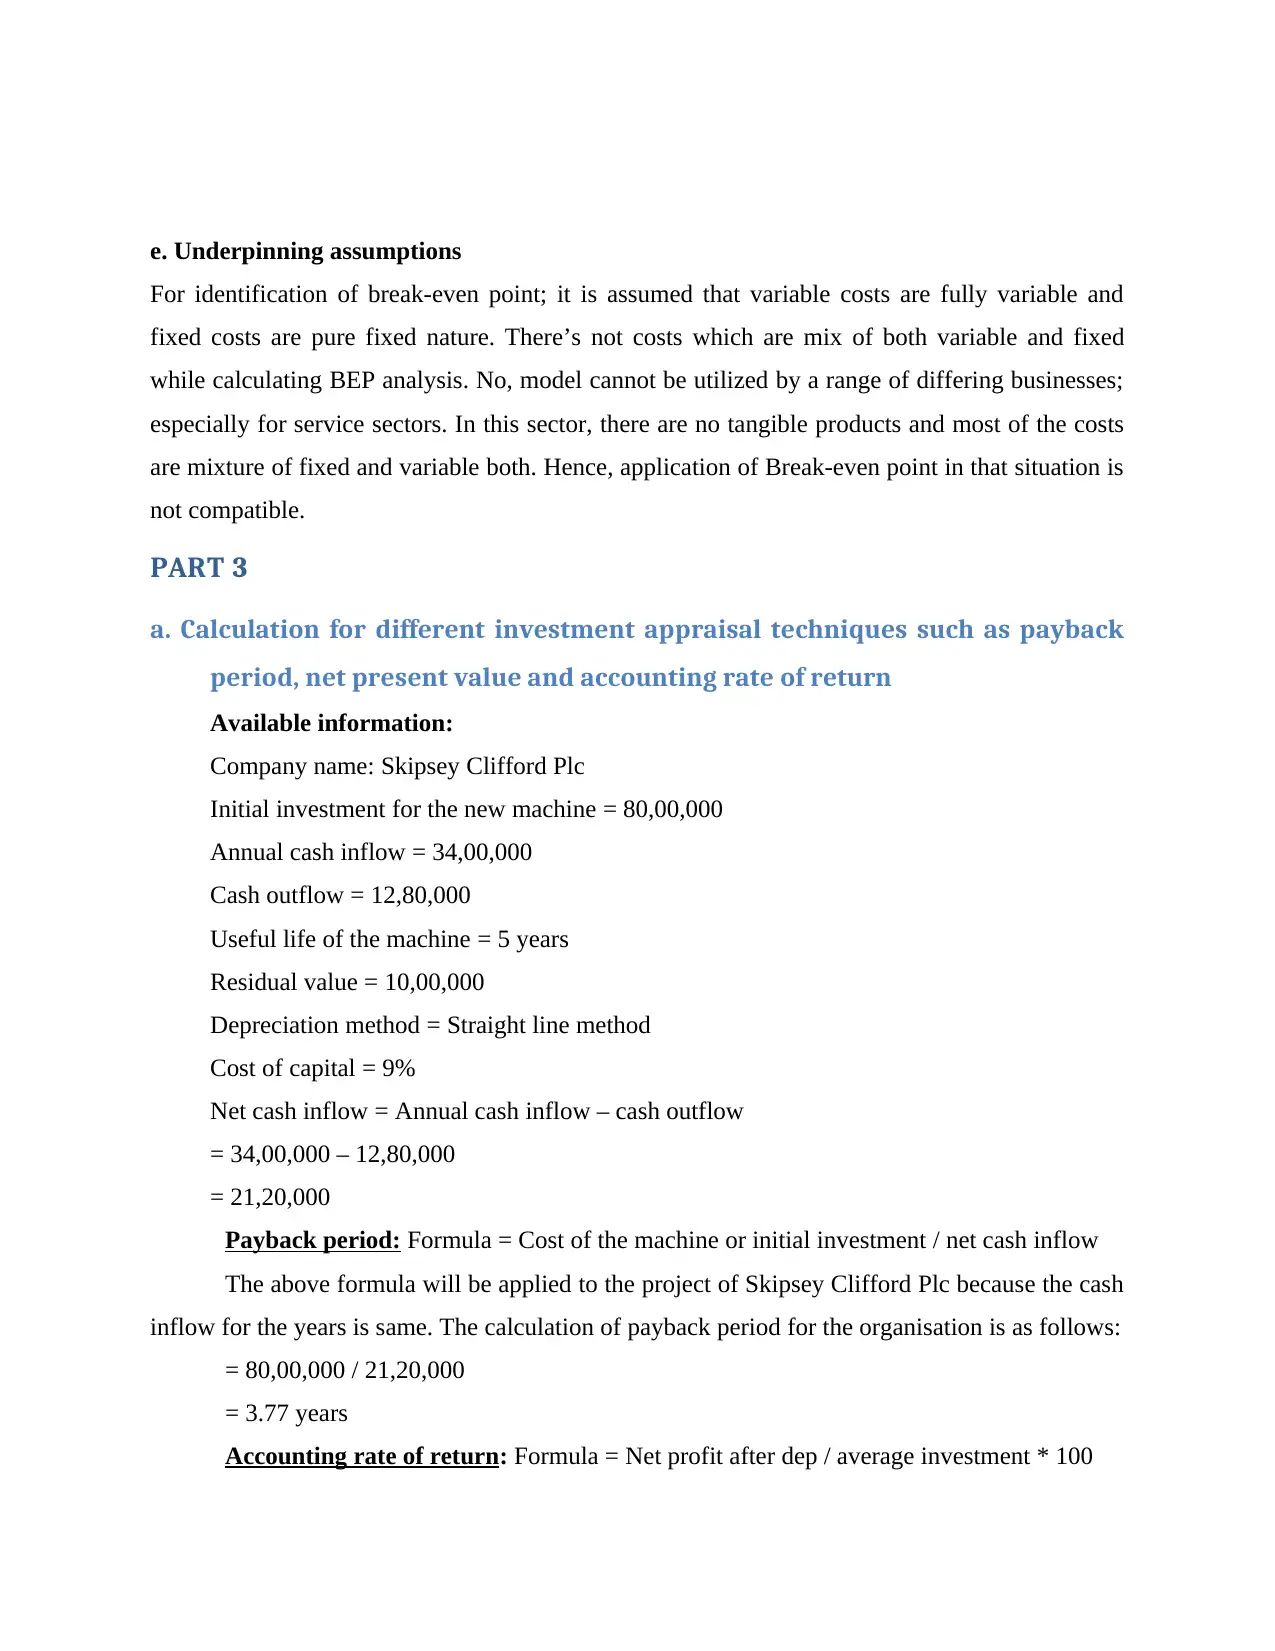
e. Underpinning assumptions
For identification of break-even point; it is assumed that variable costs are fully variable and
fixed costs are pure fixed nature. There’s not costs which are mix of both variable and fixed
while calculating BEP analysis. No, model cannot be utilized by a range of differing businesses;
especially for service sectors. In this sector, there are no tangible products and most of the costs
are mixture of fixed and variable both. Hence, application of Break-even point in that situation is
not compatible.
PART 3
a. Calculation for different investment appraisal techniques such as payback
period, net present value and accounting rate of return
Available information:
Company name: Skipsey Clifford Plc
Initial investment for the new machine = 80,00,000
Annual cash inflow = 34,00,000
Cash outflow = 12,80,000
Useful life of the machine = 5 years
Residual value = 10,00,000
Depreciation method = Straight line method
Cost of capital = 9%
Net cash inflow = Annual cash inflow – cash outflow
= 34,00,000 – 12,80,000
= 21,20,000
Payback period: Formula = Cost of the machine or initial investment / net cash inflow
The above formula will be applied to the project of Skipsey Clifford Plc because the cash
inflow for the years is same. The calculation of payback period for the organisation is as follows:
= 80,00,000 / 21,20,000
= 3.77 years
Accounting rate of return: Formula = Net profit after dep / average investment * 100
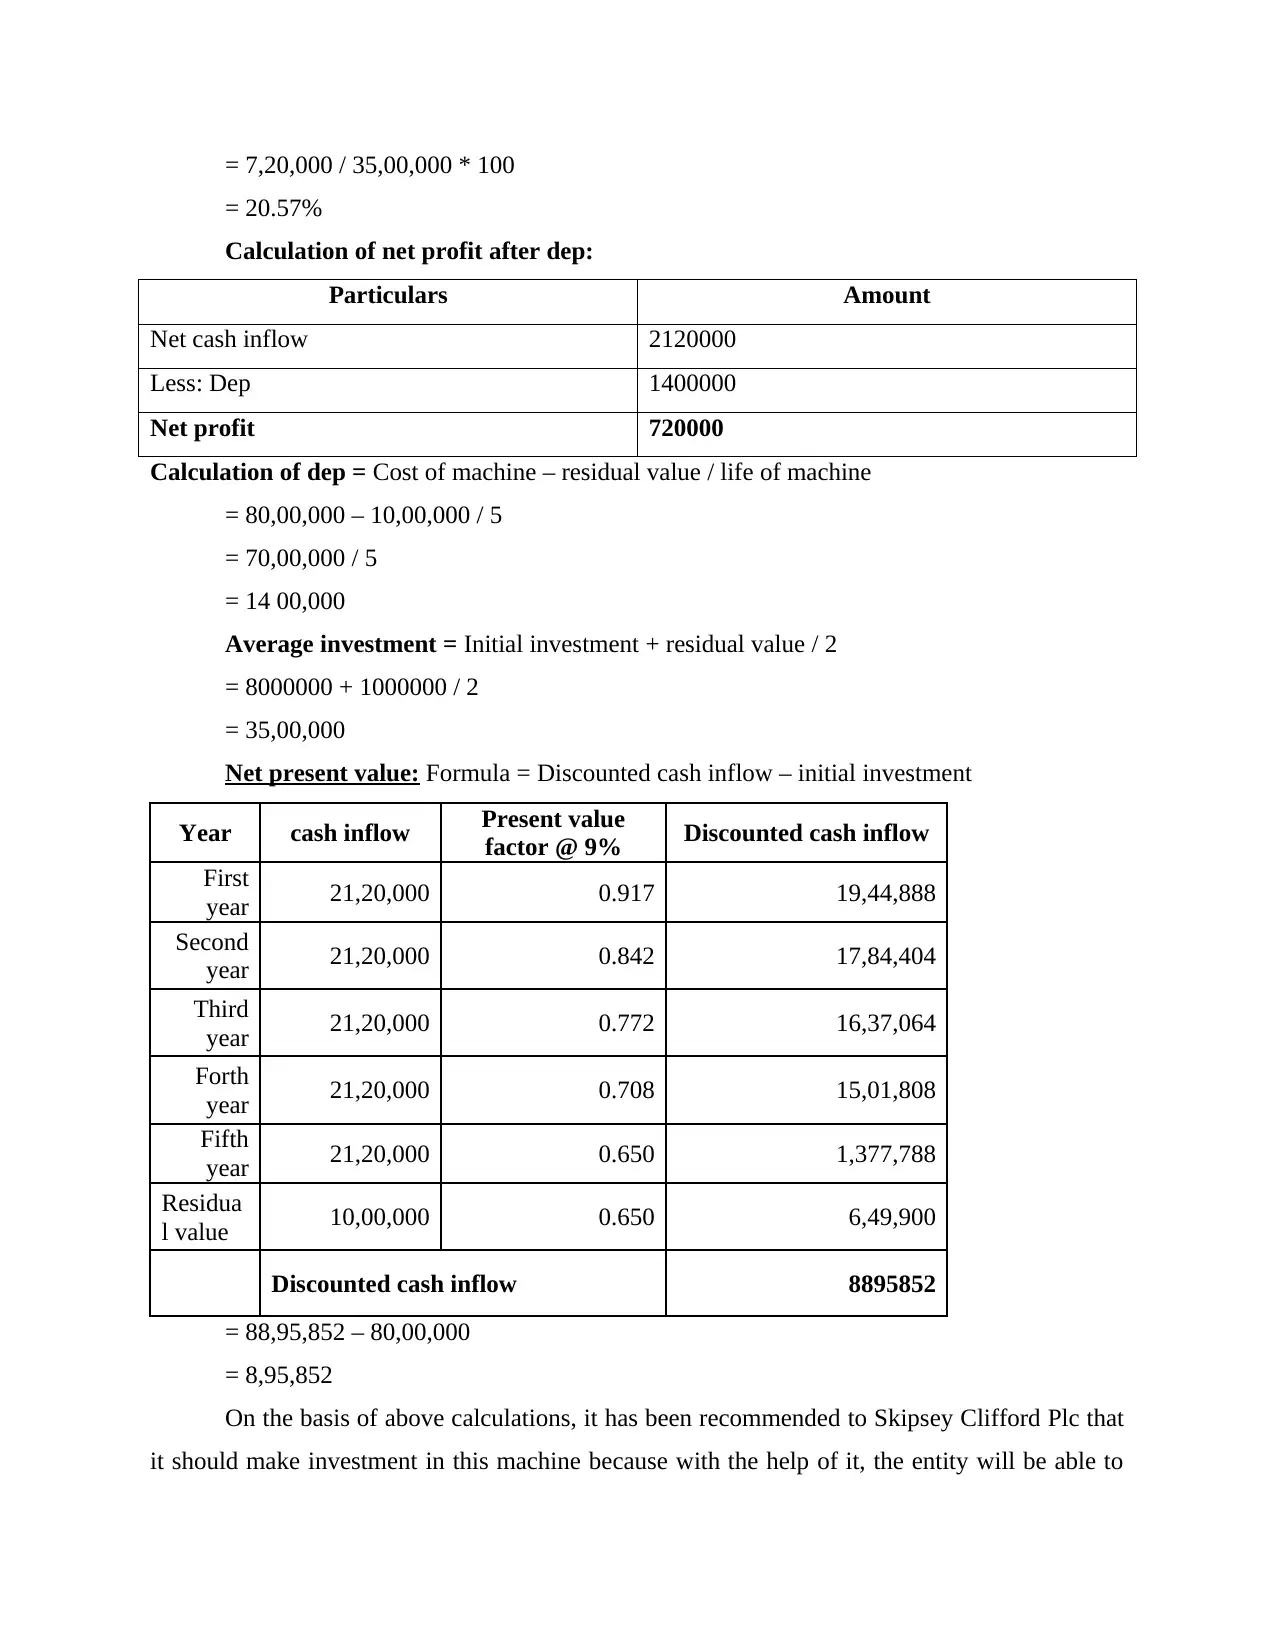
= 7,20,000 / 35,00,000 * 100
= 20.57%
Calculation of net profit after dep:
Particulars Amount
Net cash inflow 2120000
Less: Dep 1400000
Net profit 720000
Calculation of dep = Cost of machine – residual value / life of machine
= 80,00,000 – 10,00,000 / 5
= 70,00,000 / 5
= 14 00,000
Average investment = Initial investment + residual value / 2
= 8000000 + 1000000 / 2
= 35,00,000
Net present value: Formula = Discounted cash inflow – initial investment
Year cash inflow Present value
factor @ 9% Discounted cash inflow
First
year 21,20,000 0.917 19,44,888
Second
year 21,20,000 0.842 17,84,404
Third
year 21,20,000 0.772 16,37,064
Forth
year 21,20,000 0.708 15,01,808
Fifth
year 21,20,000 0.650 1,377,788
Residua
l value 10,00,000 0.650 6,49,900
Discounted cash inflow 8895852
= 88,95,852 – 80,00,000
= 8,95,852
On the basis of above calculations, it has been recommended to Skipsey Clifford Plc that
it should make investment in this machine because with the help of it, the entity will be able to
⊘ This is a preview!⊘
Do you want full access?
Subscribe today to unlock all pages.
Trusted by 1+ million students worldwide
1 out of 16
Related Documents


Your All-in-One AI-Powered Toolkit for Academic Success.
+13062052269
info@desklib.com
Available 24*7 on WhatsApp / Email
![[object Object]](/_next/static/media/star-bottom.7253800d.svg)
Unlock your academic potential
Copyright © 2020–2026 A2Z Services. All Rights Reserved. Developed and managed by ZUCOL.