ACC211 Report: Investment Appraisal Techniques Analysis
VerifiedAdded on 2023/01/16
|14
|3215
|82
Report
AI Summary
This report provides an in-depth analysis of project and investment appraisal techniques within a financial accounting context. It explores various management accounting techniques, such as Net Present Value (NPV), Internal Rate of Return (IRR), and Payback Period, applying them to evaluate a proposed investment in a new product line for Auditizz Electronics. The report details the discounted cash flow method, non-discounted payback period calculations, and the accounting rate of return, demonstrating how these tools are used to assess the feasibility of the investment. It includes a sensitivity analysis of NPV concerning changes in price and quantity, and concludes with an evaluation of the investment's feasibility, considering both discounted and non-discounted methods. The analysis provides a comprehensive evaluation of the project, offering insights into the application of financial tools for decision-making and interpretation of the results.

Running head: FINANCIAL ACCOUNTING
FINANCIAL ACCOUNTING
Name of the Student:
Name of the University:
Author’s Note:
FINANCIAL ACCOUNTING
Name of the Student:
Name of the University:
Author’s Note:
Paraphrase This Document
Need a fresh take? Get an instant paraphrase of this document with our AI Paraphraser

1FINANCIAL ACCOUNTING
Executive Summary:
This report aims at analysing and understanding various techniques of project and investment
appraisal. There are various management accounting techniques, which can be used in project
and investment appraisal. Some of them are NPV, IRR and Payback period. In this report, all
those techniques have been applied to evaluate their proposed investment in a newly developed
product line. The analysis helps in taking decisions related to the expansion of a new segment of
the business. Lastly, the report concludes with the interpretations of those financial tools which
have been used for the project appraisal technique.
2FINANCIAL ACCOUNTING
Table of Contents
Introduction:....................................................................................................................................3
Discounted Cash Flow Method of Assets Valuation:......................................................................3
Non-discounted Payback Period:.....................................................................................................4
Accounting Rate of Return:.............................................................................................................5
Net Present Value (NPV) and Internal Rate of Return (IRR):........................................................5
Sensitivity Analysis of NPV with respect to changes in price and quantity:..................................6
Feasibility of the Investment to the company:.................................................................................7
Positive NPV and Efficient Market hypothesis:..............................................................................9
Effect of Positive NPV in the Market value of the corporation:.....................................................9
Conclusion:....................................................................................................................................10
References and bibliography:........................................................................................................11
⊘ This is a preview!⊘
Do you want full access?
Subscribe today to unlock all pages.
Trusted by 1+ million students worldwide

3FINANCIAL ACCOUNTING
Introduction:
Investment in fixed assets and in new manufacturing unit requires a huge amount of fund.
It also requires huge amount of sunk cost. Hence, before investing in such a long-term project,
the feasibility or the viability of the project must be checked. There are various project appraisal
techniques such as NPV, IRR, Payback period which are used for checking the feasibility of the
investment options. In this report, such a feasibility analysis has been performed in the following
parts using the said project appraisal techniques. The report also explains the process of project
appraisal techniques and interprets the outcomes of such analysis (Matthew 2017).
Discounted Cash Flow Method of Assets Valuation:
In case of assets valuation, the future cash generating capacity of the assets and the future
expected return from the asset is important. Valuations of assets and or project appraisal can be
best evaluated if it is calculated in terms of present value. That means all the future cash inflows
and outflows need to be computed in terms of present value by discounting the cash flows, by a
suitable discounting rate. Here, minimum required rate from the assets of the investment is
considered as the discounting rate. If all the cash flows can be converted into the present value
by discounting it with the required rate of return, the total present value of the investment can be
ascertained. This method of asset valuation or project appraisal is known as the Discounted Cash
Flow Model. It is widely accepted in various business and project evaluation. In the following
parts of this report some of such techniques have been applied for a better understanding of the
technique (Matthew 2017).
Paraphrase This Document
Need a fresh take? Get an instant paraphrase of this document with our AI Paraphraser
4FINANCIAL ACCOUNTING
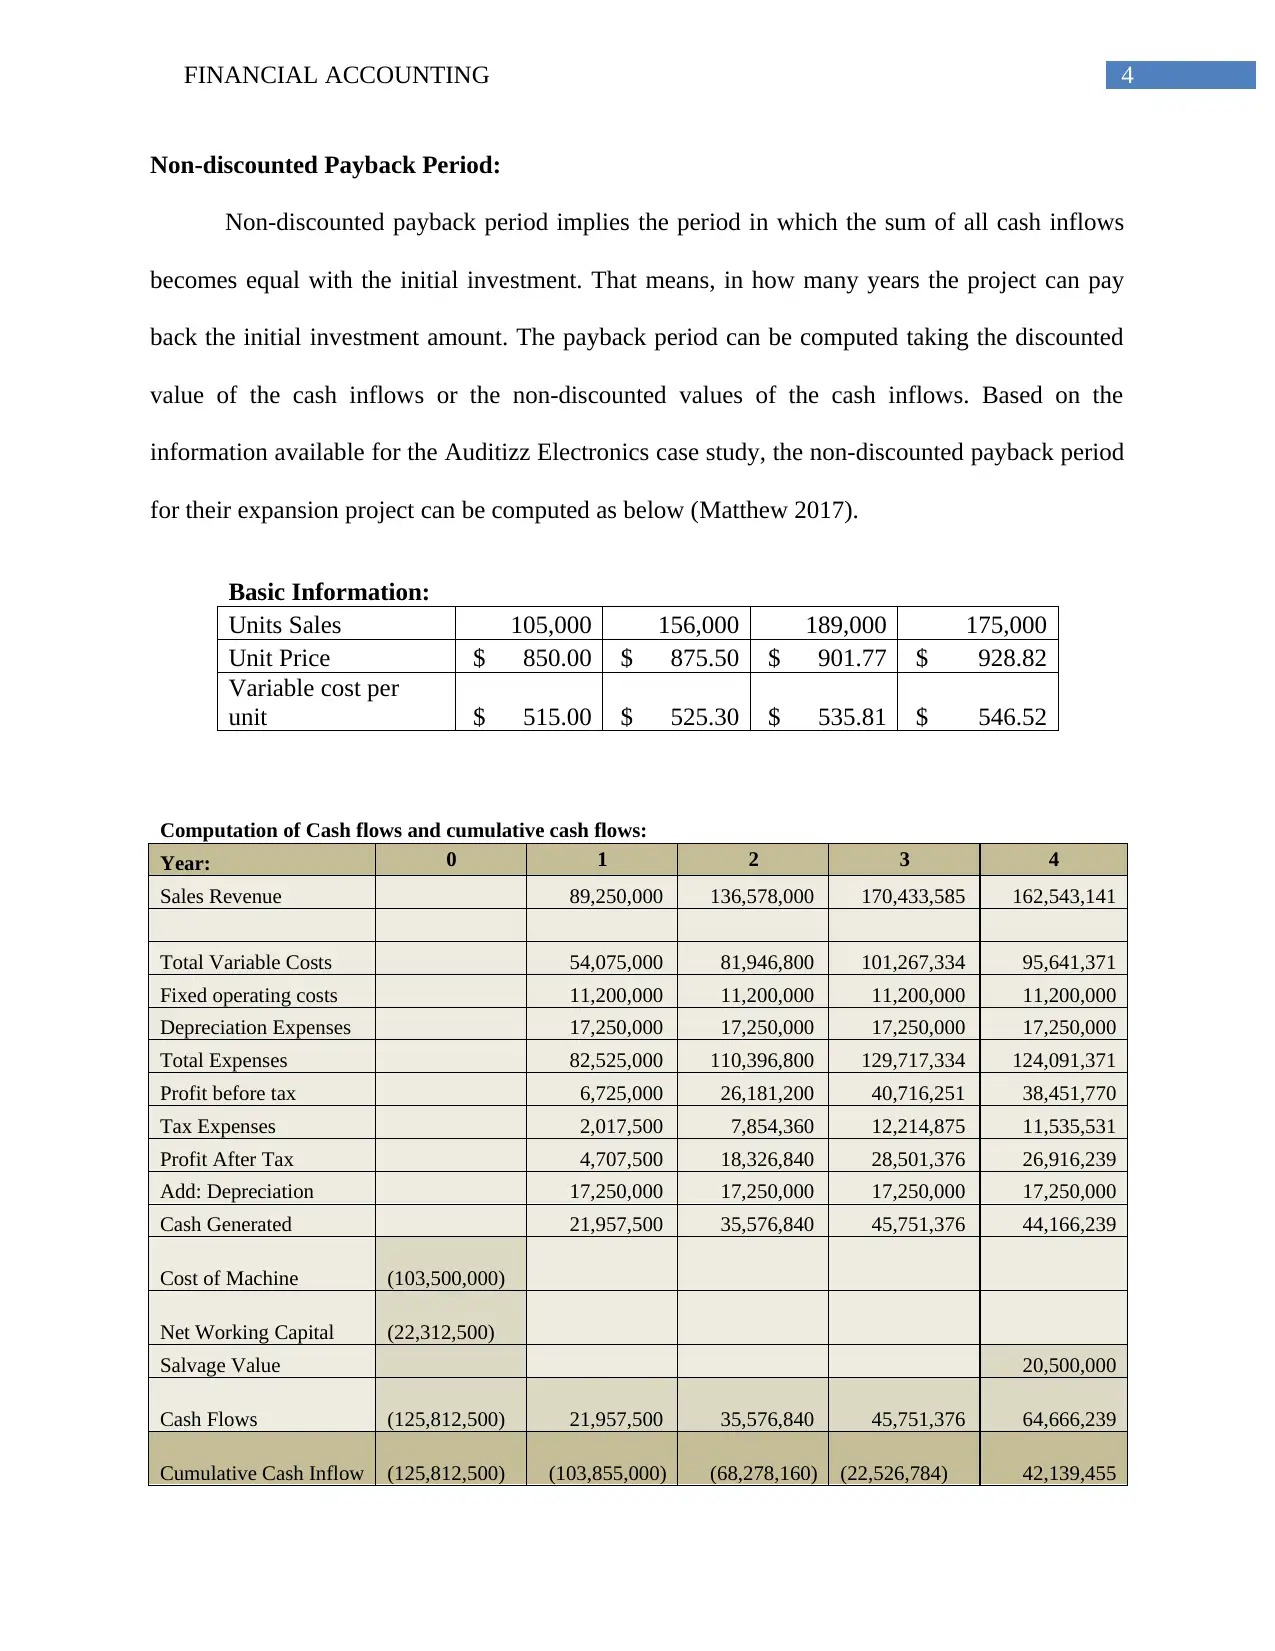
Non-discounted Payback Period:
Non-discounted payback period implies the period in which the sum of all cash inflows
becomes equal with the initial investment. That means, in how many years the project can pay
back the initial investment amount. The payback period can be computed taking the discounted
value of the cash inflows or the non-discounted values of the cash inflows. Based on the
information available for the Auditizz Electronics case study, the non-discounted payback period
for their expansion project can be computed as below (Matthew 2017).
Basic Information:
Units Sales 105,000 156,000 189,000 175,000
Unit Price $ 850.00 $ 875.50 $ 901.77 $ 928.82
Variable cost per
unit $ 515.00 $ 525.30 $ 535.81 $ 546.52
Computation of Cash flows and cumulative cash flows:
Year: 0 1 2 3 4
Sales Revenue 89,250,000 136,578,000 170,433,585 162,543,141
Total Variable Costs 54,075,000 81,946,800 101,267,334 95,641,371
Fixed operating costs 11,200,000 11,200,000 11,200,000 11,200,000
Depreciation Expenses 17,250,000 17,250,000 17,250,000 17,250,000
Total Expenses 82,525,000 110,396,800 129,717,334 124,091,371
Profit before tax 6,725,000 26,181,200 40,716,251 38,451,770
Tax Expenses 2,017,500 7,854,360 12,214,875 11,535,531
Profit After Tax 4,707,500 18,326,840 28,501,376 26,916,239
Add: Depreciation 17,250,000 17,250,000 17,250,000 17,250,000
Cash Generated 21,957,500 35,576,840 45,751,376 44,166,239
Cost of Machine (103,500,000)
Net Working Capital (22,312,500)
Salvage Value 20,500,000
Cash Flows (125,812,500) 21,957,500 35,576,840 45,751,376 64,666,239
Cumulative Cash Inflow (125,812,500) (103,855,000) (68,278,160) (22,526,784) 42,139,455
5FINANCIAL ACCOUNTING
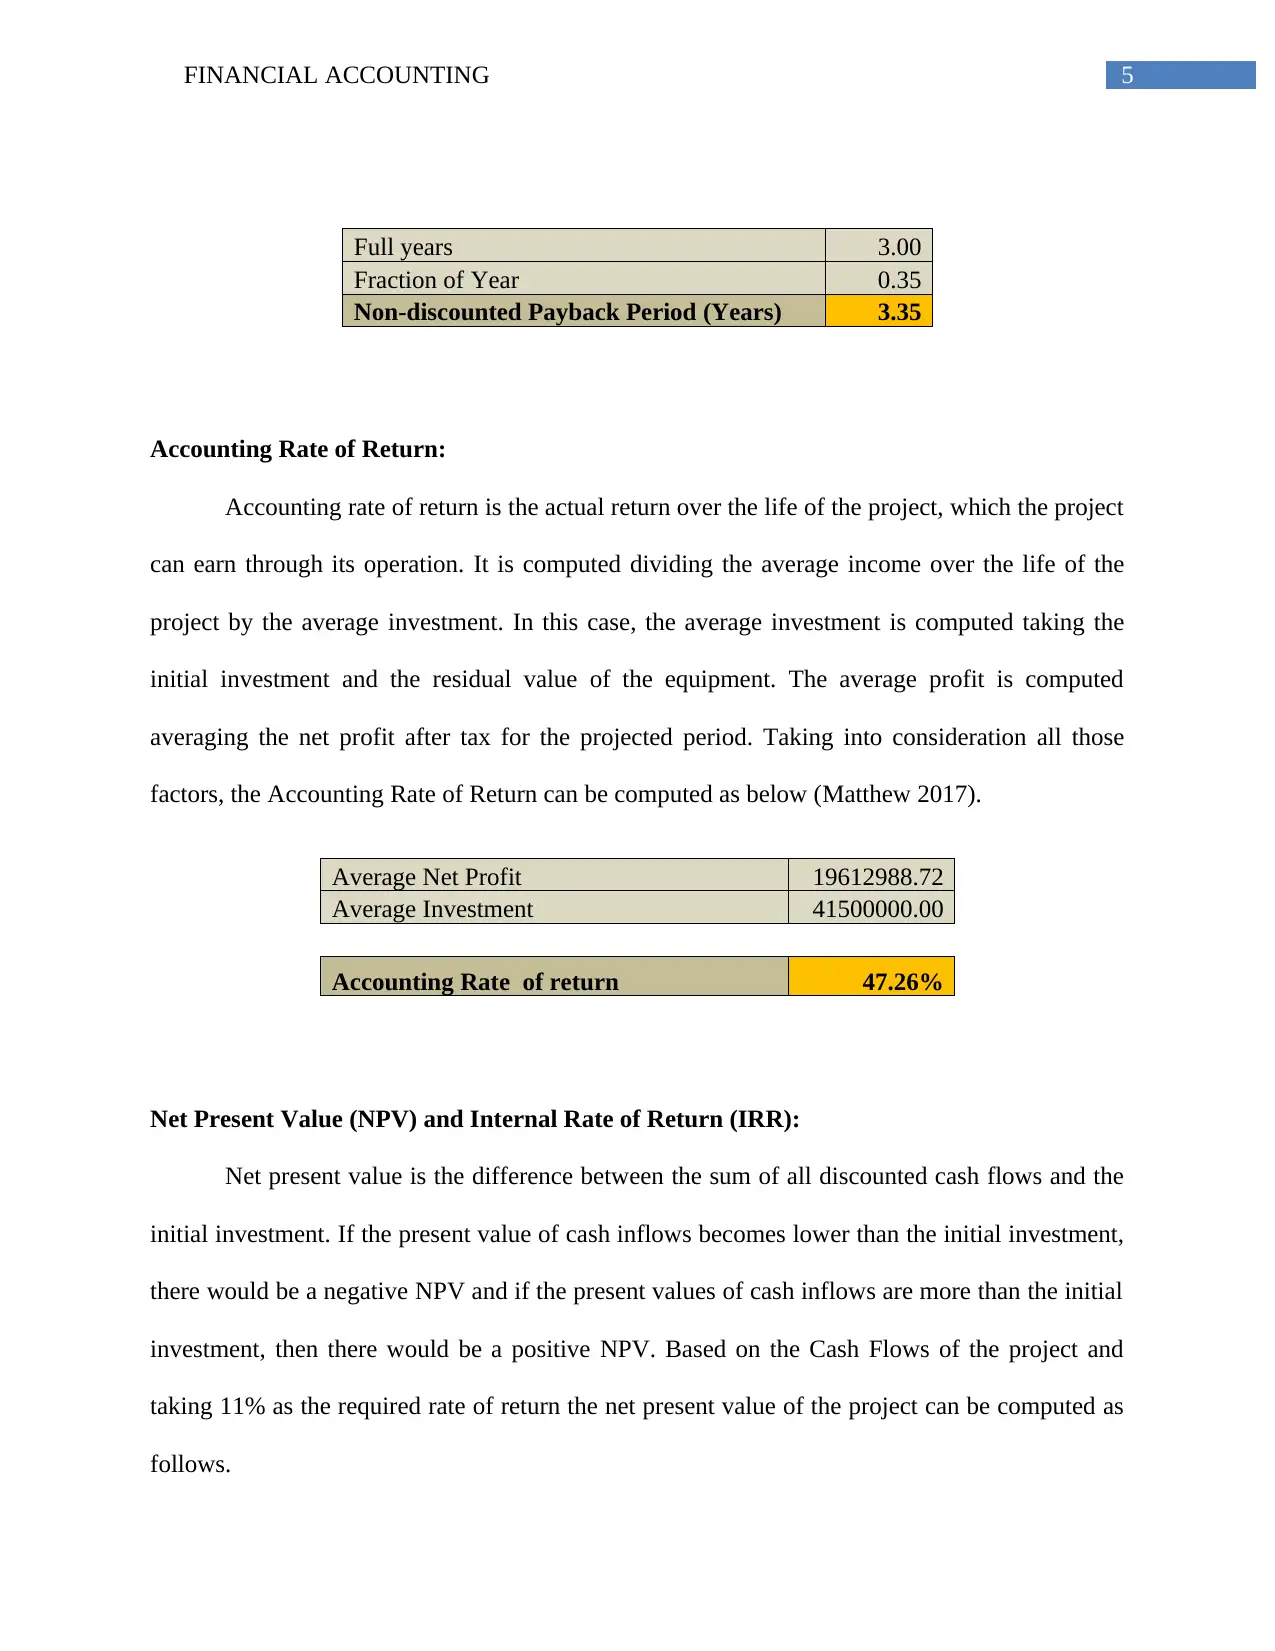
Full years 3.00
Fraction of Year 0.35
Non-discounted Payback Period (Years) 3.35
Accounting Rate of Return:
Accounting rate of return is the actual return over the life of the project, which the project
can earn through its operation. It is computed dividing the average income over the life of the
project by the average investment. In this case, the average investment is computed taking the
initial investment and the residual value of the equipment. The average profit is computed
averaging the net profit after tax for the projected period. Taking into consideration all those
factors, the Accounting Rate of Return can be computed as below (Matthew 2017).
Average Net Profit 19612988.72
Average Investment 41500000.00
Accounting Rate of return 47.26%
Net Present Value (NPV) and Internal Rate of Return (IRR):
Net present value is the difference between the sum of all discounted cash flows and the
initial investment. If the present value of cash inflows becomes lower than the initial investment,
there would be a negative NPV and if the present values of cash inflows are more than the initial
investment, then there would be a positive NPV. Based on the Cash Flows of the project and
taking 11% as the required rate of return the net present value of the project can be computed as
follows.
⊘ This is a preview!⊘
Do you want full access?
Subscribe today to unlock all pages.
Trusted by 1+ million students worldwide

6FINANCIAL ACCOUNTING
Year: 0 1 2 3 4
Cash Flows -125812500
2195750
0 35576840
4575137
6 64666239
PV Factor @ 11% 1.000 0.901 0.812 0.731 0.659
PV of Cash Flows -125812500
1978153
2 28874961
3345301
2 42597655
Net Present Value -1105341
IRR 10.65%
Internal Rate of Return is the discounting rate at which the discounted value of all the
cash inflows would be equal to the initial investment. Applying the same technique, the internal
rate of return for the project in the case study can be computed to 10.65% as shown above.
Sensitivity Analysis of NPV with respect to changes in price and quantity:
Net Present Value of a project depends on the future cash inflows of the project, and
future cash flows depend on the profitability of the project. If the price fluctuates, the total
revenue also fluctuates, and if the quantity of demand for the market fluctuates, again the sales
revenue fluctuates. As the sales revenue is the main source of this type of projects, it has a direct
impact on the profitability and the cash generation of the project. Hence, it can be understood
that, changes in price and changes in quantity demanded have direct impact on the cash flows
and the Net Present Value of the project. To understand it in a better way, a sensitivity analysis
has been done as below taking an increase of 5000 units each in the base quantity demanded a
$50 increase in the subsequent prices.
Sensitivity Analysis of NPV
-1105340.7 850 900 950 1000
105000 -1105341 14997622 31100584 47203547
Paraphrase This Document
Need a fresh take? Get an instant paraphrase of this document with our AI Paraphraser

7FINANCIAL ACCOUNTING
110000 47482826 15086586 31284706 47482826
115000 48041384 15264514 31652949 48041384
120000 48879222 15531405 32205314 48879222
It can be observed from the above sensitivity analysis table of NPV, that the NPV
increases with the increase in quantity demanded and price of the product. A highest $48.88
million NPV can be generated if the project starts with minimum price of $1,000 per unit and
initial demand of 12,000 units for the product. It can easily be understood from the table that the
NPV changes with the change in price of the product and the quantity demanded for the product.
As price increases the revenue from the project also increase, and on the other hand, if the
quantity demand for the products increases, the revenue also increase. Hence increase in price
and quantity demanded for the product are having a direct impact in the net present value of the
project. In this case study also, it can be evidenced that with every combination of price and
quantity demanded the NPV also changes. This change in NPV with respect to change in price
and quantity demanded is known as the volatility of the NPV (Hilton and Platt 2013).
In all these techniques, evaluation of the projects and investment opportunities are done
on the basis of certain forecasted data and projected information. It also includes certain
assumptions and propositions for conduction the valuation or project appraisal process. In reality,
the actual thing may not be the same as it was projected. Hence, it is presupposed that, there
might be some errors in forecasting and future cash flow projections. That means, we can make a
forecast based on certain assumption for the future but the actual happenings in the future may
not be the same. Hence, there are some risk associated with the forecasting and future cash flow
projection (Hilton and Platt 2013).
8FINANCIAL ACCOUNTING
Feasibility of the Investment to the company:
As discussed earlier, before investing into a project, a feasibility study or a project
evaluation must be conducted. There are various discounted and non-discounted project appraisal
techniques. In this case study, non-discounted payback period, IRR, NPV, ARR have been
computed to evaluate the feasibility of the project. Payback period is the time period in which the
invested amount can be generated back. Lower the payback period more feasible the investment
opportunity (Hilton and Platt 2013). In this case the payback period has been computed to 3.35
years. The total life of the project is 4 years, hence in terms of payback period, it can be
suggested to accept the investment option. In terms of ARR, which talks about the actual rate of
return could be generated from the project, the investment option is having a 47.26%. As the
investment option is having a significant rate of actual return, it can be recommended to accept
the investment project.
In terms of NPV, the project is having a negative NPV of $1.1 million, which denotes a
capital rosion or loss in long-term perspective. From this point of view, it can be recommended
not to go for the investment option, as it will not be able to generate the minimum required
return. Internal Rate of Return is also a parameter of actual profitability of the investment. The
acceptance criteria for IRR is that, if the IRR is more than the required rate of return then the
project should be accepted and if the IRR is lower than the required rate of return, then the
project should be rejected. As it has been computed above, the proposed project is having an IRR
of 10.65% which is lesser than the required rate of return of 11%. From this side also the project
is recommended to be rejected.
Therefore, if an overall analysis can be done, it is recommended that, the project should
be rejected as the NPV is negative and the IRR is lower than the required rate of return. Non-
⊘ This is a preview!⊘
Do you want full access?
Subscribe today to unlock all pages.
Trusted by 1+ million students worldwide

9FINANCIAL ACCOUNTING
discounted payback period do not consider the time value of money, hence it is less scientific
and rational (Collis and Hussey 2017). ARR also do not consider the time value of money, it
only considers the future profitability of the project. On the other hand, the NPV and IRR
considers the time value of money, and hence it is considered to be more scientific and rational.
Therefore, based on the NPV and IRR result of the above computation, it can be recommended
for the company not to go for the project (Collis and Hussey 2017).
Positive NPV and Efficient Market hypothesis:
Positive NPV means the sum of present values of cash flows will be more than the initial
investment. As the cash flows are discounted by the required rate of return, it considers the
minimum required return in computation. Hence, a positive NPV denotes more return over and
above the required rate of return. Generally the market rate of return is considered as the required
rate of return in computing the NPV, hence it fulfils the proposition that, if the NPV is positive,
the investment can generate a return more than the market rate of return(Kaplan and Atkinson
2015). Efficient market hypothesis states that, there is a complete flow of information in the
market and all investors are aware of the market conditions. They behave rationally with the
knowledge of every activity in the market. No single investor can influence the market condition.
It also says that, the asset prices are adjusted and reflected as per the information available in the
market. As the positive NPV means a higher return than the market rate of return, it cannot
prevail in the longer period of time, as flow of information will make it to fall and come to the
market rate of return (Kaplan and Atkinson 2015).
Paraphrase This Document
Need a fresh take? Get an instant paraphrase of this document with our AI Paraphraser

10FINANCIAL ACCOUNTING
Effect of Positive NPV in the Market value of the corporation:
Positive NPV denotes, the project or the investment can earn a return more than the
market-required rate; hence, it has a relationship with the market-required rate of return. Market
required rate is the expected rate of return whereas the actual rate is the actual return from the
project. The market value of the project is determined by the market rate of return and the
intrinsic value of the corporation is computed by its actual profitability. The intrinsic value of the
corporation is backed by the net assets of the corporation. Hence there is no significant effect of
a positive NPV on the market value of the corporation, though it has a major impact on the
intrinsic value of the corporation (Brooks and Mukherjee 2013).
Conclusion:
From the above analysis and discussion, it can be concluded that, various project
appraisal techniques can be applied for assets valuation and project appraisal. Techniques which
considers the time value of money are more preferable than the non discounted techniques. It
helps to make key investment decision for potential investment opportunities. Lastly it can be
said that, the NPV and Profitability of investment have some impact on the market value as well
as the intrinsic value of the corporation.

11FINANCIAL ACCOUNTING
References and bibliography:
Allen, R., Hemming, R. and Potter, B. eds., 2013. The International Handbook of Public
Financial Management. Springer.
Baños-Caballero, S., García-Teruel, P.J. and Martínez-Solano, P., 2014. Working capital
management, corporate performance, and financial constraints. Journal of Business
Research, 67(3), pp.332-338.
Bodnar, G.M., Consolandi, C., Gabbi, G. and Jaiswal‐Dale, A., 2013. Risk Management for
Italian Non‐Financial Firms: Currency and Interest Rate Exposure. European Financial
Management, 19(5), pp.887-910.
Brooks, R. and Mukherjee, A.K., 2013. Financial management: core concepts. Pearson.
Cangiano, M.M., Curristine, M.T.R. and Lazare, M.M., 2013. Public financial management and
its emerging architecture. International Monetary Fund.
Collis, J. and Hussey, R., 2017. Cost and management accounting. Macmillan International
Higher Education.
Crosby, N. and Henneberry, J., 2016. Financialisation, the valuation of investment property and
the urban built environment in the UK. Urban Studies, 53(7), pp.1424-1441.
Damodaran, A., 2016. Damodaran on valuation: security analysis for investment and corporate
finance (Vol. 324). John Wiley & Sons.
DRURY, C.M., 2013. Management and cost accounting. Springer.
⊘ This is a preview!⊘
Do you want full access?
Subscribe today to unlock all pages.
Trusted by 1+ million students worldwide
1 out of 14
Related Documents


Your All-in-One AI-Powered Toolkit for Academic Success.
+13062052269
info@desklib.com
Available 24*7 on WhatsApp / Email
![[object Object]](/_next/static/media/star-bottom.7253800d.svg)
Unlock your academic potential
Copyright © 2020–2026 A2Z Services. All Rights Reserved. Developed and managed by ZUCOL.