Financial Accounting Assignment: Dialog Group Berhad Case Study Report
VerifiedAdded on 2022/08/13
|12
|2206
|18
Report
AI Summary
This financial accounting assignment presents a case study analysis of Dialog Group Berhad, a Malaysian company listed on Bursa Malaysia. The report examines the company's capital, assets, equities, and liabilities from 2017 to 2019 using accounting equation tables. It evaluates the company's financial performance through ratio analysis, assessing liquidity, efficiency, profitability, solvency, and market performance. The analysis includes calculations of current and quick ratios, total assets turnover, debtor turnover, gross margin, return on equity, debt-to-equity ratio, and earnings per share. The conclusion highlights the company's strong financial performance, with improved profitability and a decline in financial leverage, while also noting a decline in asset utilization efficiency. The report references several academic sources to support its analysis.
Running head: FINANCIAL ACCOUNTING ASSIGNMENT
Financial accounting assignment
Name of the Student
Name of the University
Author Note
Financial accounting assignment
Name of the Student
Name of the University
Author Note
Paraphrase This Document
Need a fresh take? Get an instant paraphrase of this document with our AI Paraphraser
FINANCIAL ACCOUNTING ASSIGNMENT
Table of Contents
Introduction:...............................................................................................................................2
Discussion:.................................................................................................................................2
Elaborating the capital, assets, equities and liabilities of Dialog Group Berhad:......................2
Evaluating the analysis of the financial statements and performance of organization:.............3
Conclusion:................................................................................................................................8
References and Bibliography list:..............................................................................................9
FINANCIAL ACCOUNTING ASSIGNMENT
Introduction:
The paper demonstrates the case study analysis of one of the companies listed on the
stock exchange of Malaysia that is Bursa Malaysia with the objective of assessing the
complex business environment and analysing the financial and non-financial data. Dialog
group Berhad was established in the year 1984 and is a leading provider of technical service
in the gas, oil and pharmaceutical industries. The company has a global footprint with its
operations and offices in countries such as Malaysia, Singapore, China, Indonesia,
Philippines, Saudi Arabia, New Zealand, Australia and United Arab Emirates. The vision of
Dialog is to be the leading provider of technical service to the midstream, upstream and
downstream sectors of the gas, oil and petrochemical industries at the international level and
Malaysia (dialogasia.com 2020). Mission of the company on other hand is to
continuously enhance the competence, competitiveness and leadership in provisioning the
service and committing to the timely completion of job and maintaining quality. In addition
to this, continuous retention of motivated and skilled employees and development of
professional workforce for serving the best interest of the communities is the mission of the
company. The business objective of Dialog is to excel in the delivery and execution of the
services and projects in the gas, oil and petrochemical industries internationally
(dialogasia.com 2020).
⊘ This is a preview!⊘
Do you want full access?
Subscribe today to unlock all pages.
Trusted by 1+ million students worldwide
FINANCIAL ACCOUNTING ASSIGNMENT
Discussion:
Elaborating the capital, assets, equities and liabilities of Dialog Group Berhad:
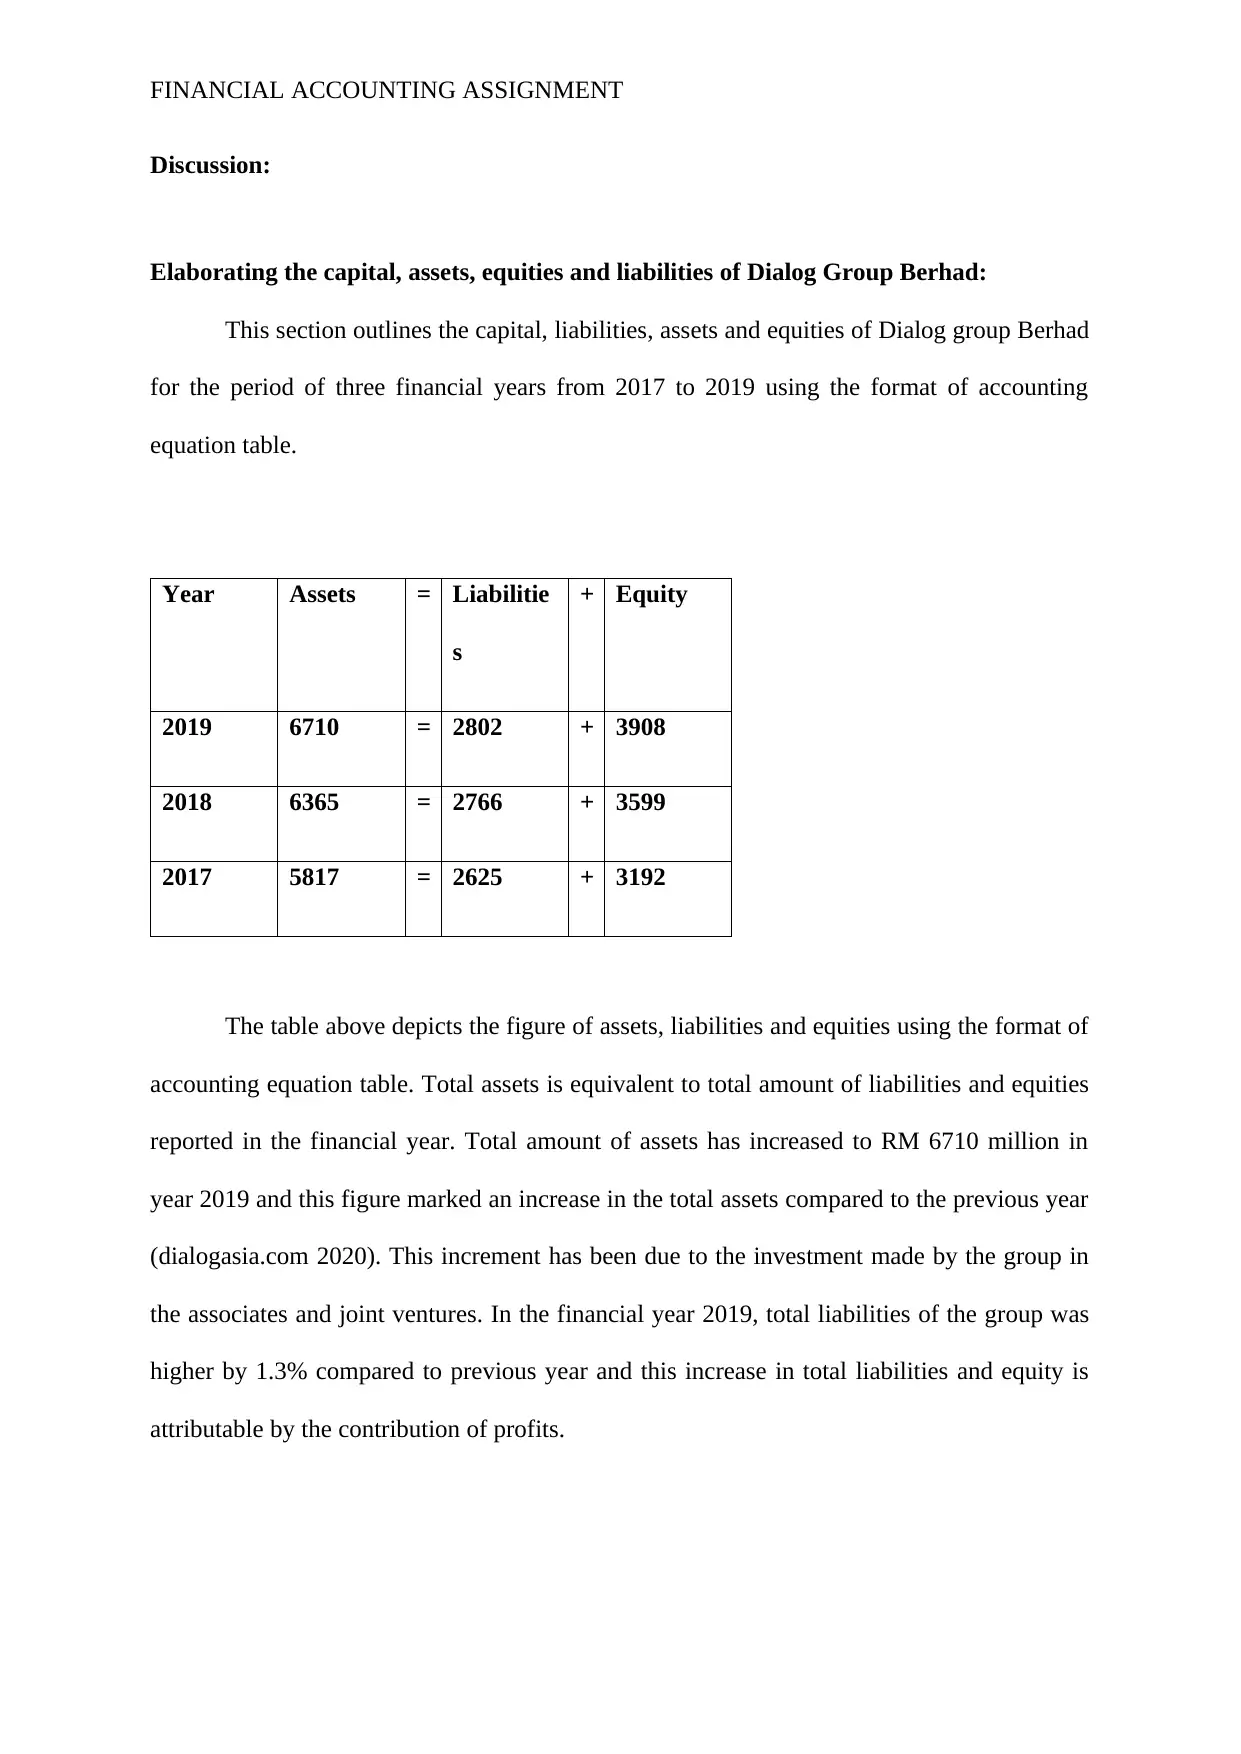
This section outlines the capital, liabilities, assets and equities of Dialog group Berhad
for the period of three financial years from 2017 to 2019 using the format of accounting
equation table.
Year Assets = Liabilitie
s
+ Equity
2019 6710 = 2802 + 3908
2018 6365 = 2766 + 3599
2017 5817 = 2625 + 3192
The table above depicts the figure of assets, liabilities and equities using the format of
accounting equation table. Total assets is equivalent to total amount of liabilities and equities
reported in the financial year. Total amount of assets has increased to RM 6710 million in
year 2019 and this figure marked an increase in the total assets compared to the previous year
(dialogasia.com 2020). This increment has been due to the investment made by the group in
the associates and joint ventures. In the financial year 2019, total liabilities of the group was
higher by 1.3% compared to previous year and this increase in total liabilities and equity is
attributable by the contribution of profits.
Discussion:
Elaborating the capital, assets, equities and liabilities of Dialog Group Berhad:
This section outlines the capital, liabilities, assets and equities of Dialog group Berhad
for the period of three financial years from 2017 to 2019 using the format of accounting
equation table.
Year Assets = Liabilitie
s
+ Equity
2019 6710 = 2802 + 3908
2018 6365 = 2766 + 3599
2017 5817 = 2625 + 3192
The table above depicts the figure of assets, liabilities and equities using the format of
accounting equation table. Total assets is equivalent to total amount of liabilities and equities
reported in the financial year. Total amount of assets has increased to RM 6710 million in
year 2019 and this figure marked an increase in the total assets compared to the previous year
(dialogasia.com 2020). This increment has been due to the investment made by the group in
the associates and joint ventures. In the financial year 2019, total liabilities of the group was
higher by 1.3% compared to previous year and this increase in total liabilities and equity is
attributable by the contribution of profits.
Paraphrase This Document
Need a fresh take? Get an instant paraphrase of this document with our AI Paraphraser
FINANCIAL ACCOUNTING ASSIGNMENT
Evaluating the analysis of the financial statements and performance of organization:
Financial performance of Dialog Group Berhad has been evaluated by the analysing
and assessing the financial statements of the company. Financial statements of the company
is analysed by the application of ratio analysis tool that has helped in assessing the overall
financial performance in terms of liquidity, efficiency, profitability, solvency and ratios
measuring the market performance of organization (Kimmel et al., 2018).
A strong financial performance was delivered by the group in the current financial
year with an increase in the profit after tax and this strong performance is attributable to the
better operational performances in Malaysia in the downstream and upstream activities
particularly from plant maintenance, construction and engineering of several projects
(dialogasia.com, 2020). The intense competition and the challenging market has lowered the
margins that has caused the net profit margin to be lowered on the international front for the
current financial year. Higher net profit has been generated in the associates and the joint
venture of the group.
Overall performance of Dialog is evaluated by the computation of various ratios
measuring the liquidity, profitability, solvency, efficiency and market performance.
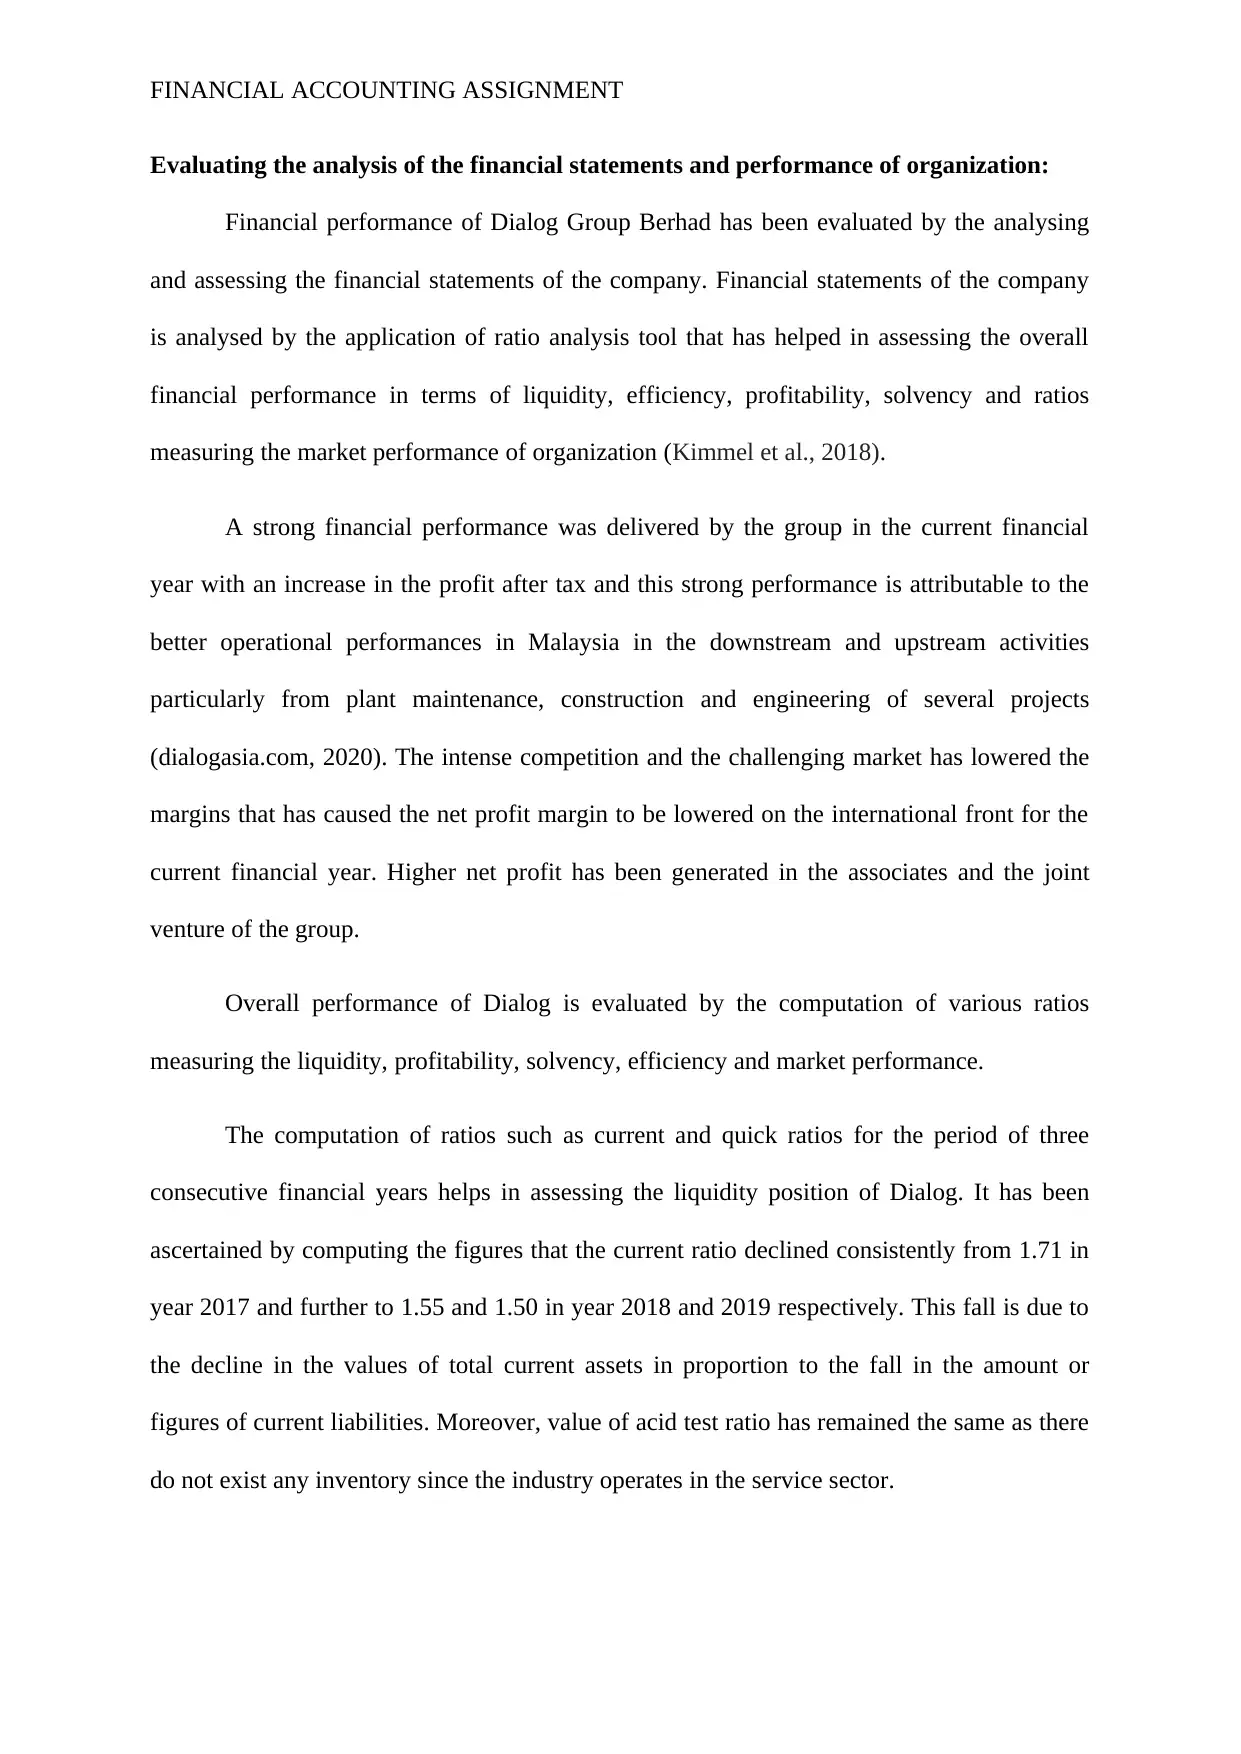
The computation of ratios such as current and quick ratios for the period of three
consecutive financial years helps in assessing the liquidity position of Dialog. It has been
ascertained by computing the figures that the current ratio declined consistently from 1.71 in
year 2017 and further to 1.55 and 1.50 in year 2018 and 2019 respectively. This fall is due to
the decline in the values of total current assets in proportion to the fall in the amount or
figures of current liabilities. Moreover, value of acid test ratio has remained the same as there
do not exist any inventory since the industry operates in the service sector.
Evaluating the analysis of the financial statements and performance of organization:
Financial performance of Dialog Group Berhad has been evaluated by the analysing
and assessing the financial statements of the company. Financial statements of the company
is analysed by the application of ratio analysis tool that has helped in assessing the overall
financial performance in terms of liquidity, efficiency, profitability, solvency and ratios
measuring the market performance of organization (Kimmel et al., 2018).
A strong financial performance was delivered by the group in the current financial
year with an increase in the profit after tax and this strong performance is attributable to the
better operational performances in Malaysia in the downstream and upstream activities
particularly from plant maintenance, construction and engineering of several projects
(dialogasia.com, 2020). The intense competition and the challenging market has lowered the
margins that has caused the net profit margin to be lowered on the international front for the
current financial year. Higher net profit has been generated in the associates and the joint
venture of the group.
Overall performance of Dialog is evaluated by the computation of various ratios
measuring the liquidity, profitability, solvency, efficiency and market performance.
The computation of ratios such as current and quick ratios for the period of three
consecutive financial years helps in assessing the liquidity position of Dialog. It has been
ascertained by computing the figures that the current ratio declined consistently from 1.71 in
year 2017 and further to 1.55 and 1.50 in year 2018 and 2019 respectively. This fall is due to
the decline in the values of total current assets in proportion to the fall in the amount or
figures of current liabilities. Moreover, value of acid test ratio has remained the same as there
do not exist any inventory since the industry operates in the service sector.
FINANCIAL ACCOUNTING ASSIGNMENT
2019 2018 2017
1.35
1.45
1.55
1.65
1.75
1.50
1.55
1.71
1.5
1.6
1.7
Liquidity ratios
Current Ratio
Quick Ratio
Chart 1:
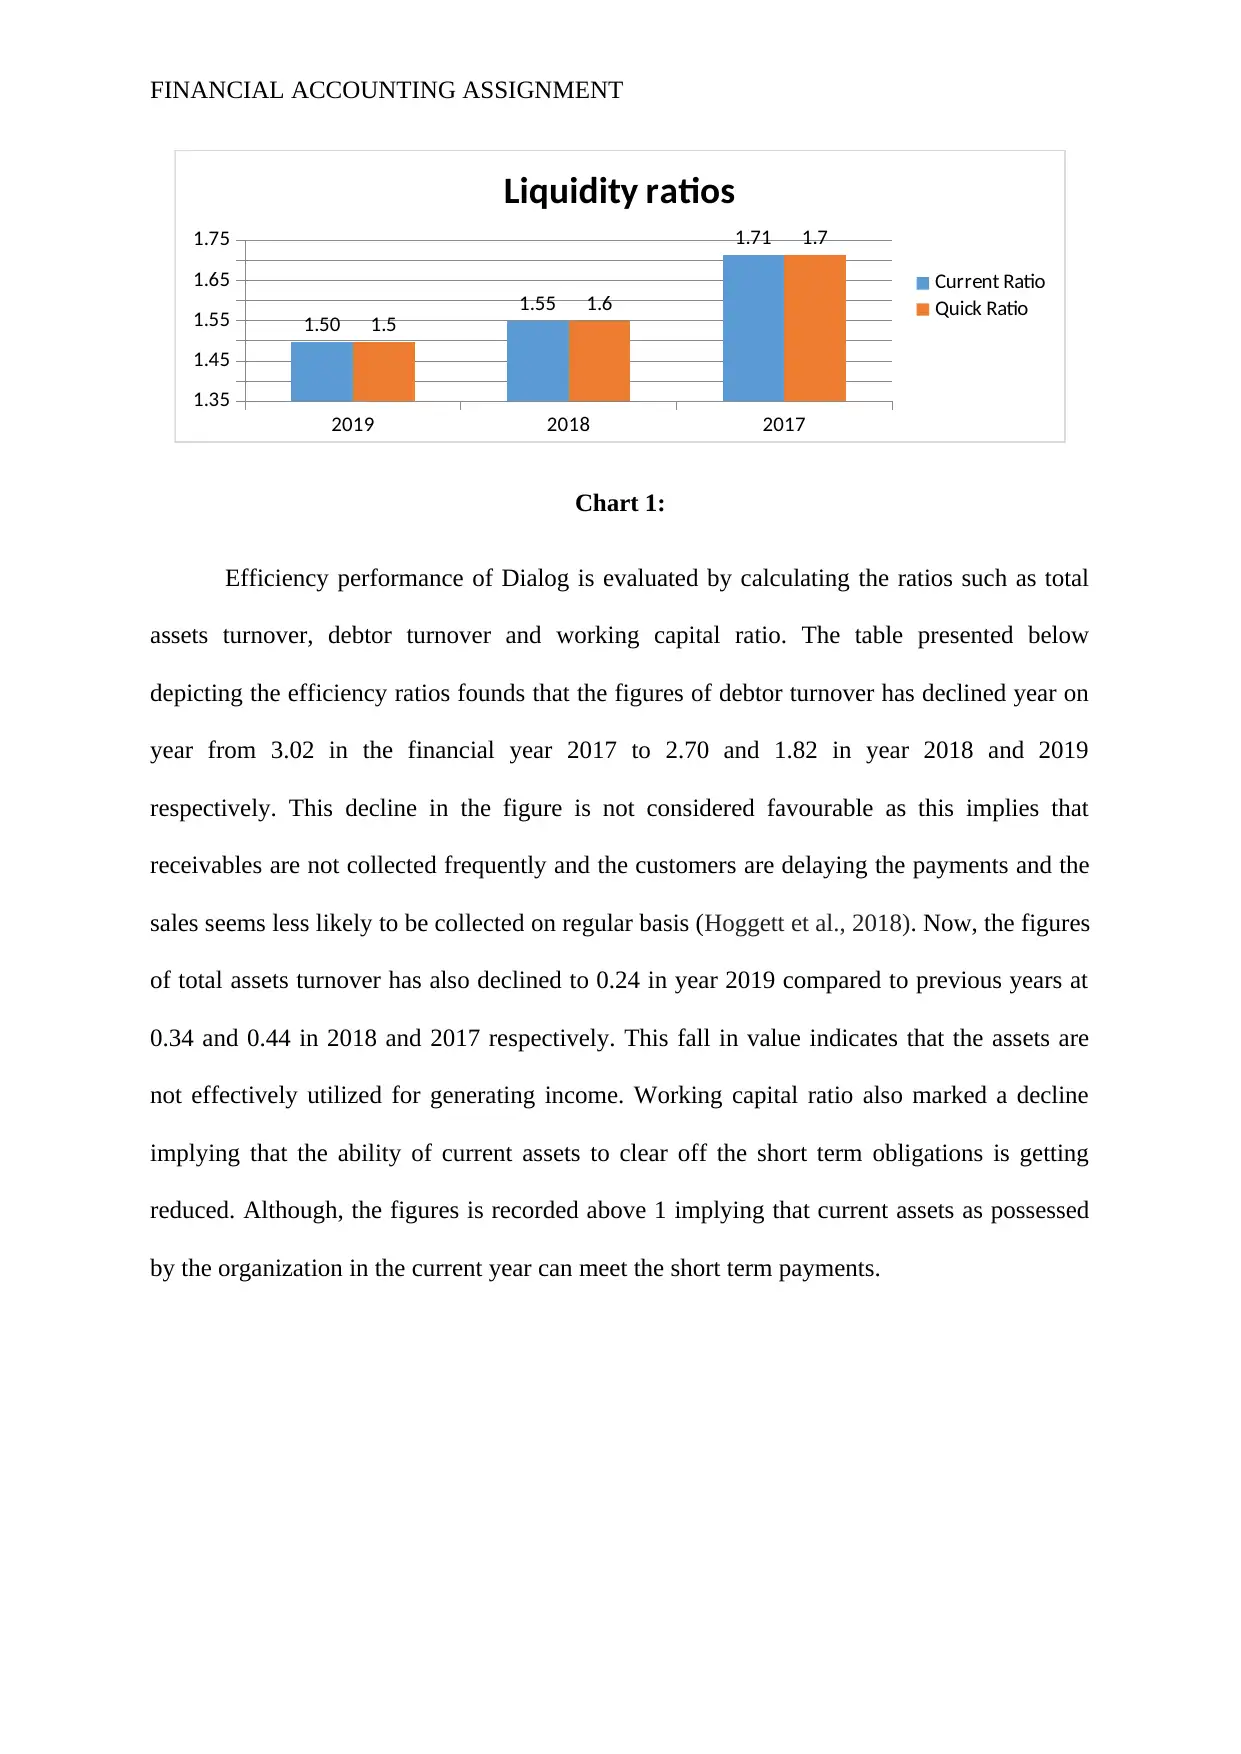
Efficiency performance of Dialog is evaluated by calculating the ratios such as total
assets turnover, debtor turnover and working capital ratio. The table presented below
depicting the efficiency ratios founds that the figures of debtor turnover has declined year on
year from 3.02 in the financial year 2017 to 2.70 and 1.82 in year 2018 and 2019
respectively. This decline in the figure is not considered favourable as this implies that
receivables are not collected frequently and the customers are delaying the payments and the
sales seems less likely to be collected on regular basis (Hoggett et al., 2018). Now, the figures
of total assets turnover has also declined to 0.24 in year 2019 compared to previous years at
0.34 and 0.44 in 2018 and 2017 respectively. This fall in value indicates that the assets are
not effectively utilized for generating income. Working capital ratio also marked a decline
implying that the ability of current assets to clear off the short term obligations is getting
reduced. Although, the figures is recorded above 1 implying that current assets as possessed
by the organization in the current year can meet the short term payments.
2019 2018 2017
1.35
1.45
1.55
1.65
1.75
1.50
1.55
1.71
1.5
1.6
1.7
Liquidity ratios
Current Ratio
Quick Ratio
Chart 1:
Efficiency performance of Dialog is evaluated by calculating the ratios such as total
assets turnover, debtor turnover and working capital ratio. The table presented below
depicting the efficiency ratios founds that the figures of debtor turnover has declined year on
year from 3.02 in the financial year 2017 to 2.70 and 1.82 in year 2018 and 2019
respectively. This decline in the figure is not considered favourable as this implies that
receivables are not collected frequently and the customers are delaying the payments and the
sales seems less likely to be collected on regular basis (Hoggett et al., 2018). Now, the figures
of total assets turnover has also declined to 0.24 in year 2019 compared to previous years at
0.34 and 0.44 in 2018 and 2017 respectively. This fall in value indicates that the assets are
not effectively utilized for generating income. Working capital ratio also marked a decline
implying that the ability of current assets to clear off the short term obligations is getting
reduced. Although, the figures is recorded above 1 implying that current assets as possessed
by the organization in the current year can meet the short term payments.
⊘ This is a preview!⊘
Do you want full access?
Subscribe today to unlock all pages.
Trusted by 1+ million students worldwide
FINANCIAL ACCOUNTING ASSIGNMENT
2019 2018 2017
0.00
0.50
1.00
1.50
2.00
2.50
3.00
3.50
1.82
2.70
3.02
0.24 0.34 0.44
1.50 1.55 1.71
Efficiency ratios
Debtors Turnover
Total Asset turnover
Working capital ratio
Chart 2:
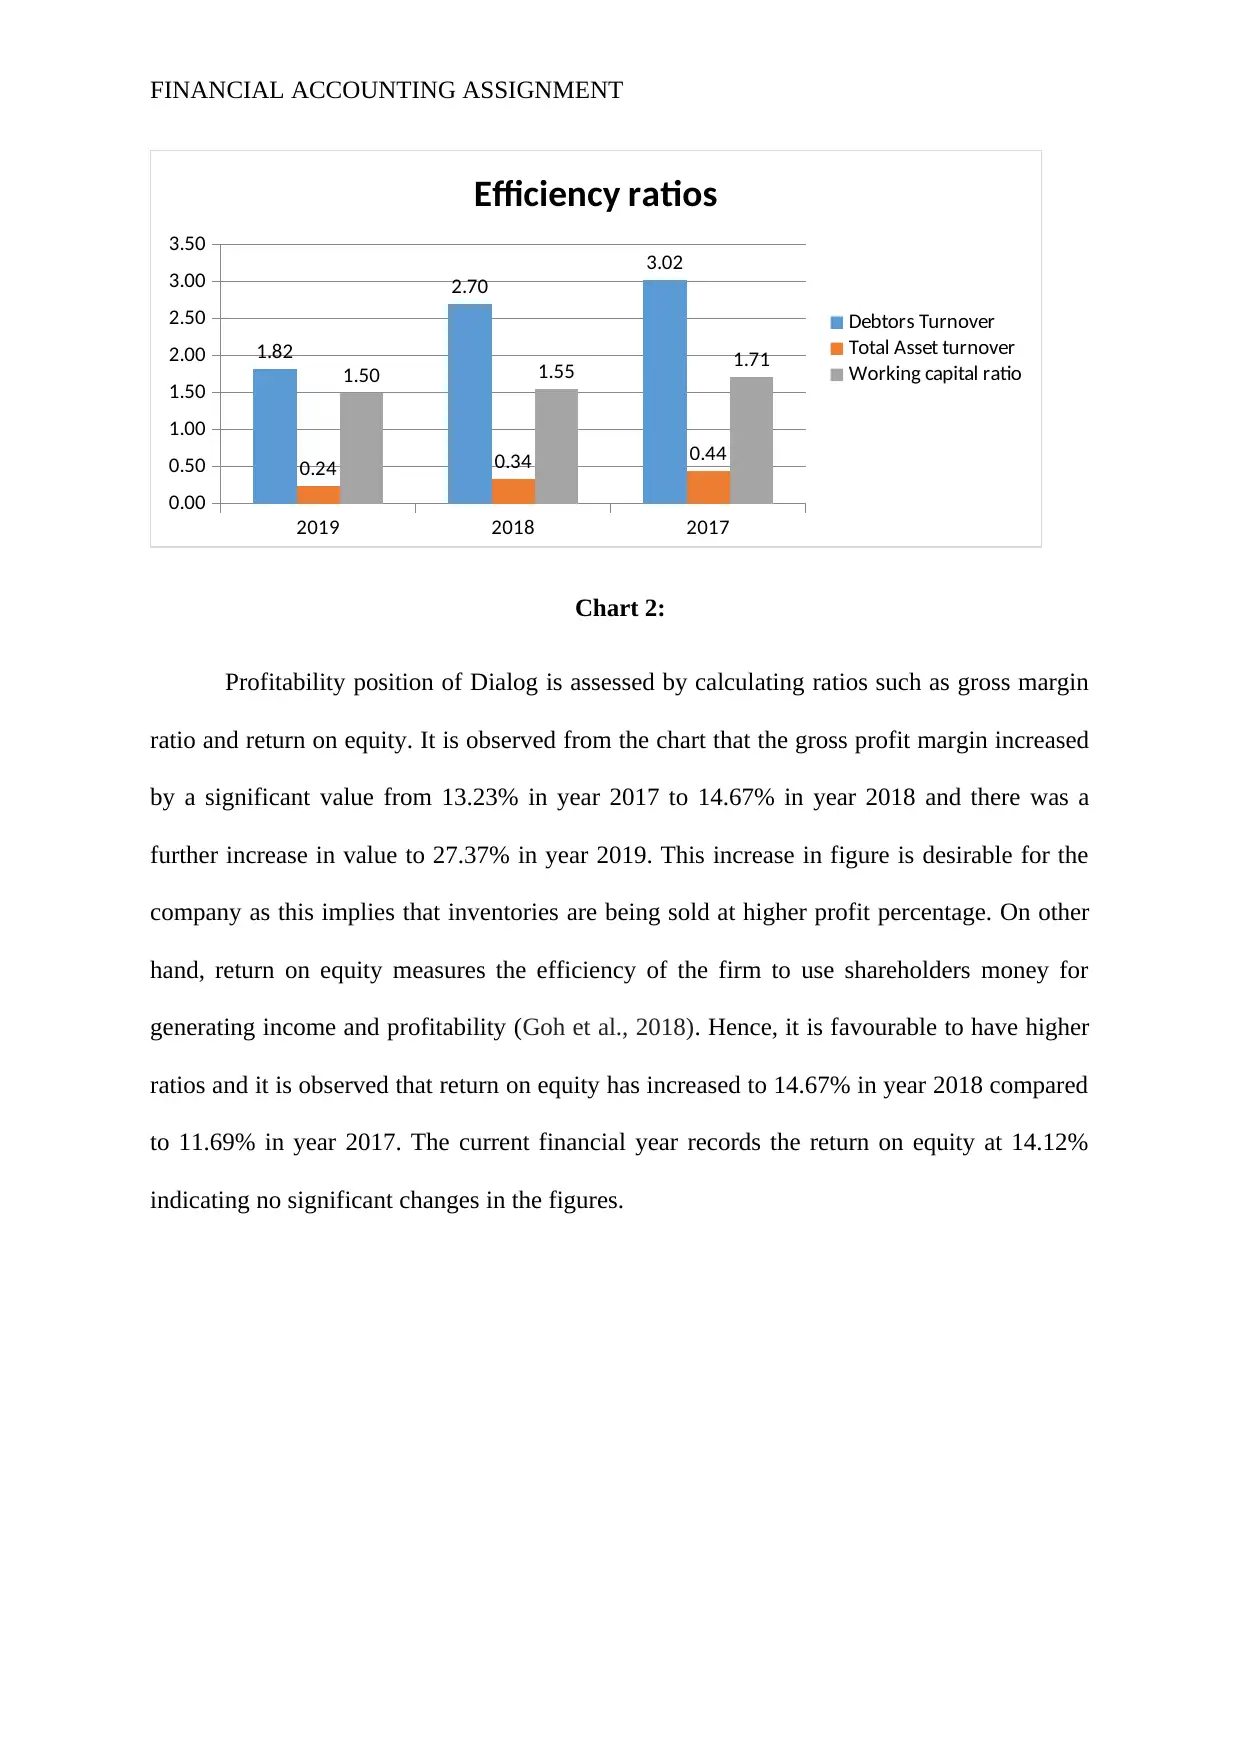
Profitability position of Dialog is assessed by calculating ratios such as gross margin
ratio and return on equity. It is observed from the chart that the gross profit margin increased
by a significant value from 13.23% in year 2017 to 14.67% in year 2018 and there was a
further increase in value to 27.37% in year 2019. This increase in figure is desirable for the
company as this implies that inventories are being sold at higher profit percentage. On other
hand, return on equity measures the efficiency of the firm to use shareholders money for
generating income and profitability (Goh et al., 2018). Hence, it is favourable to have higher
ratios and it is observed that return on equity has increased to 14.67% in year 2018 compared
to 11.69% in year 2017. The current financial year records the return on equity at 14.12%
indicating no significant changes in the figures.
2019 2018 2017
0.00
0.50
1.00
1.50
2.00
2.50
3.00
3.50
1.82
2.70
3.02
0.24 0.34 0.44
1.50 1.55 1.71
Efficiency ratios
Debtors Turnover
Total Asset turnover
Working capital ratio
Chart 2:
Profitability position of Dialog is assessed by calculating ratios such as gross margin
ratio and return on equity. It is observed from the chart that the gross profit margin increased
by a significant value from 13.23% in year 2017 to 14.67% in year 2018 and there was a
further increase in value to 27.37% in year 2019. This increase in figure is desirable for the
company as this implies that inventories are being sold at higher profit percentage. On other
hand, return on equity measures the efficiency of the firm to use shareholders money for
generating income and profitability (Goh et al., 2018). Hence, it is favourable to have higher
ratios and it is observed that return on equity has increased to 14.67% in year 2018 compared
to 11.69% in year 2017. The current financial year records the return on equity at 14.12%
indicating no significant changes in the figures.
Paraphrase This Document
Need a fresh take? Get an instant paraphrase of this document with our AI Paraphraser
FINANCIAL ACCOUNTING ASSIGNMENT
2019 2018 2017
0.00%
5.00%
10.00%
15.00%
20.00%
25.00%
30.00% 27.37%
20.19%
13.23%
14.12% 14.67%
11.69%
Profitability ratios
Gross Profit Margin Return on Equity
Chart 3:
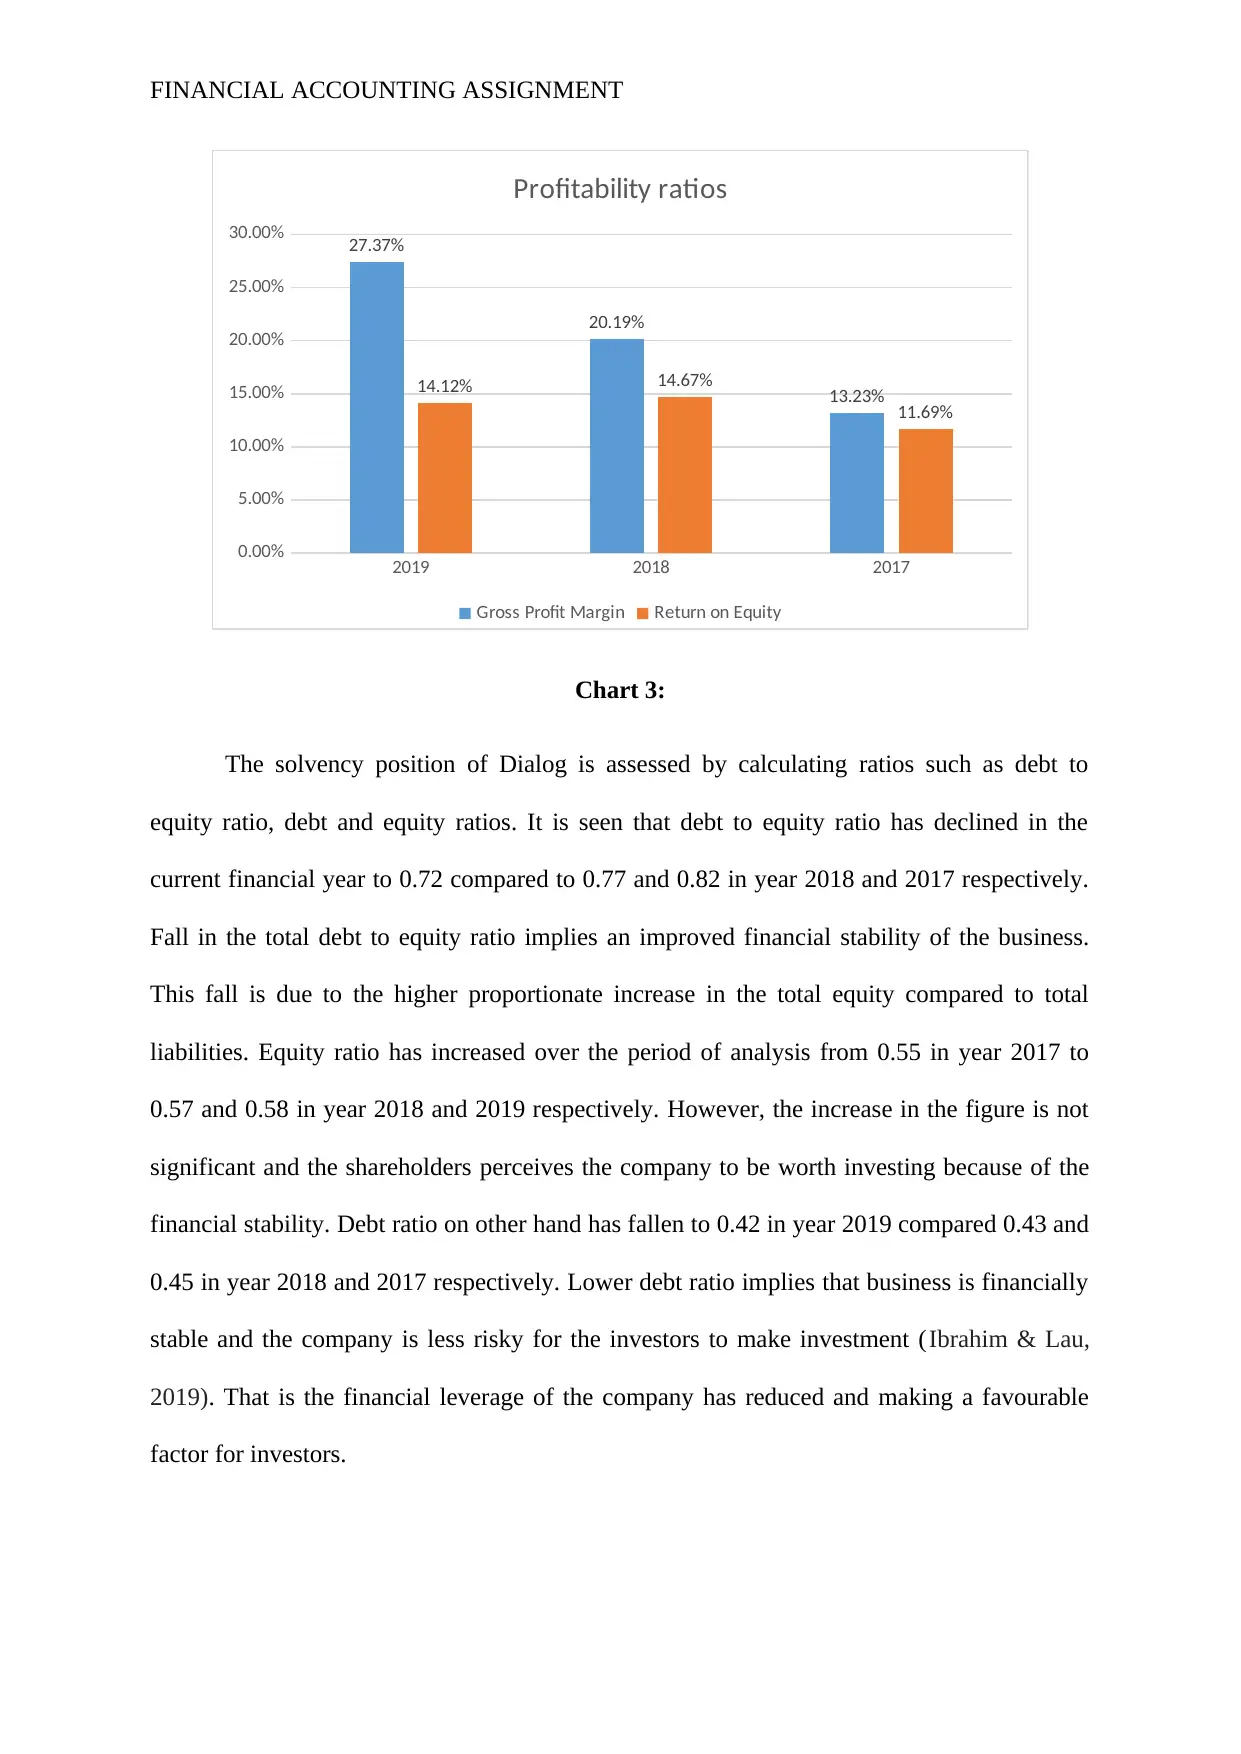
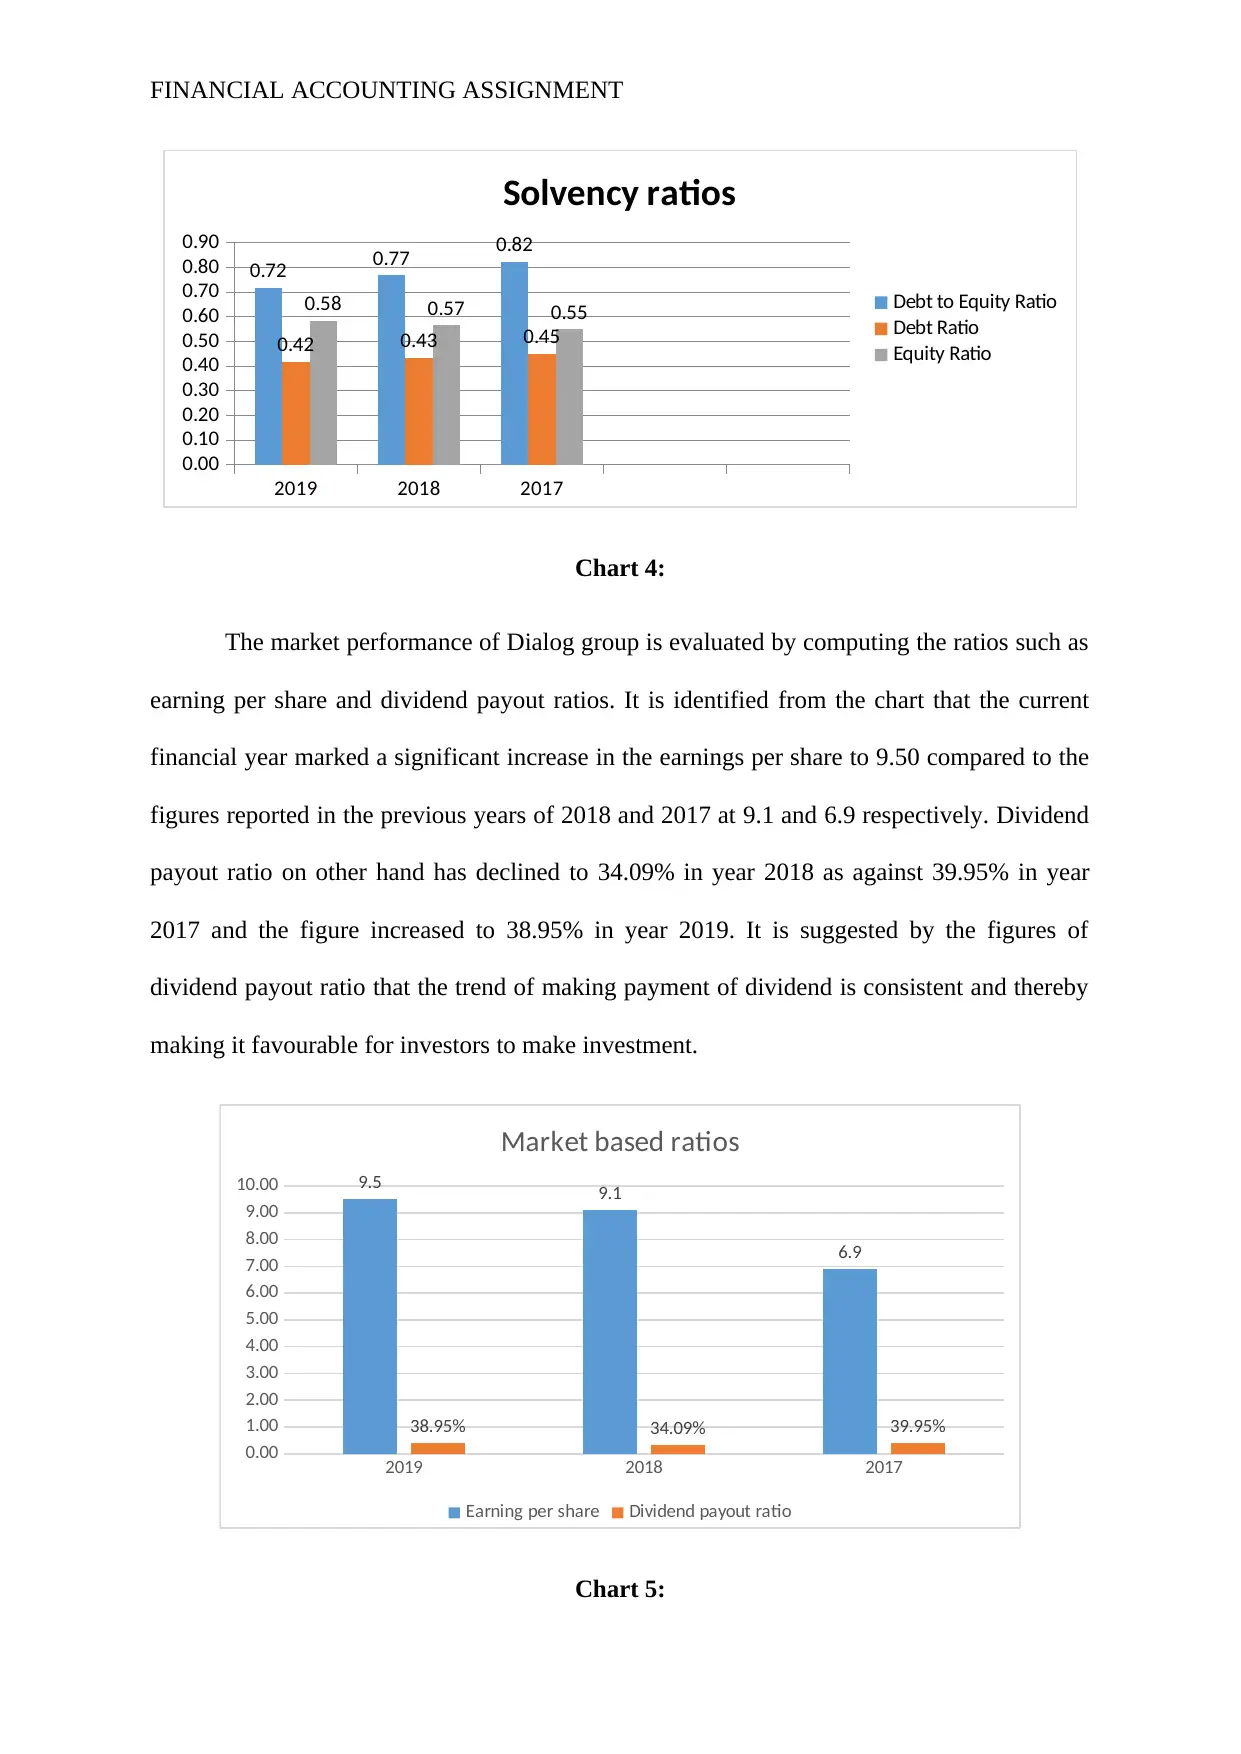
The solvency position of Dialog is assessed by calculating ratios such as debt to
equity ratio, debt and equity ratios. It is seen that debt to equity ratio has declined in the
current financial year to 0.72 compared to 0.77 and 0.82 in year 2018 and 2017 respectively.
Fall in the total debt to equity ratio implies an improved financial stability of the business.
This fall is due to the higher proportionate increase in the total equity compared to total
liabilities. Equity ratio has increased over the period of analysis from 0.55 in year 2017 to
0.57 and 0.58 in year 2018 and 2019 respectively. However, the increase in the figure is not
significant and the shareholders perceives the company to be worth investing because of the
financial stability. Debt ratio on other hand has fallen to 0.42 in year 2019 compared 0.43 and
0.45 in year 2018 and 2017 respectively. Lower debt ratio implies that business is financially
stable and the company is less risky for the investors to make investment (Ibrahim & Lau,
2019). That is the financial leverage of the company has reduced and making a favourable
factor for investors.
2019 2018 2017
0.00%
5.00%
10.00%
15.00%
20.00%
25.00%
30.00% 27.37%
20.19%
13.23%
14.12% 14.67%
11.69%
Profitability ratios
Gross Profit Margin Return on Equity
Chart 3:
The solvency position of Dialog is assessed by calculating ratios such as debt to
equity ratio, debt and equity ratios. It is seen that debt to equity ratio has declined in the
current financial year to 0.72 compared to 0.77 and 0.82 in year 2018 and 2017 respectively.
Fall in the total debt to equity ratio implies an improved financial stability of the business.
This fall is due to the higher proportionate increase in the total equity compared to total
liabilities. Equity ratio has increased over the period of analysis from 0.55 in year 2017 to
0.57 and 0.58 in year 2018 and 2019 respectively. However, the increase in the figure is not
significant and the shareholders perceives the company to be worth investing because of the
financial stability. Debt ratio on other hand has fallen to 0.42 in year 2019 compared 0.43 and
0.45 in year 2018 and 2017 respectively. Lower debt ratio implies that business is financially
stable and the company is less risky for the investors to make investment (Ibrahim & Lau,
2019). That is the financial leverage of the company has reduced and making a favourable
factor for investors.
FINANCIAL ACCOUNTING ASSIGNMENT
2019 2018 2017
0.00
0.10
0.20
0.30
0.40
0.50
0.60
0.70
0.80
0.90
0.72 0.77 0.82
0.42 0.43 0.45
0.58 0.57 0.55
Solvency ratios
Debt to Equity Ratio
Debt Ratio
Equity Ratio
Chart 4:
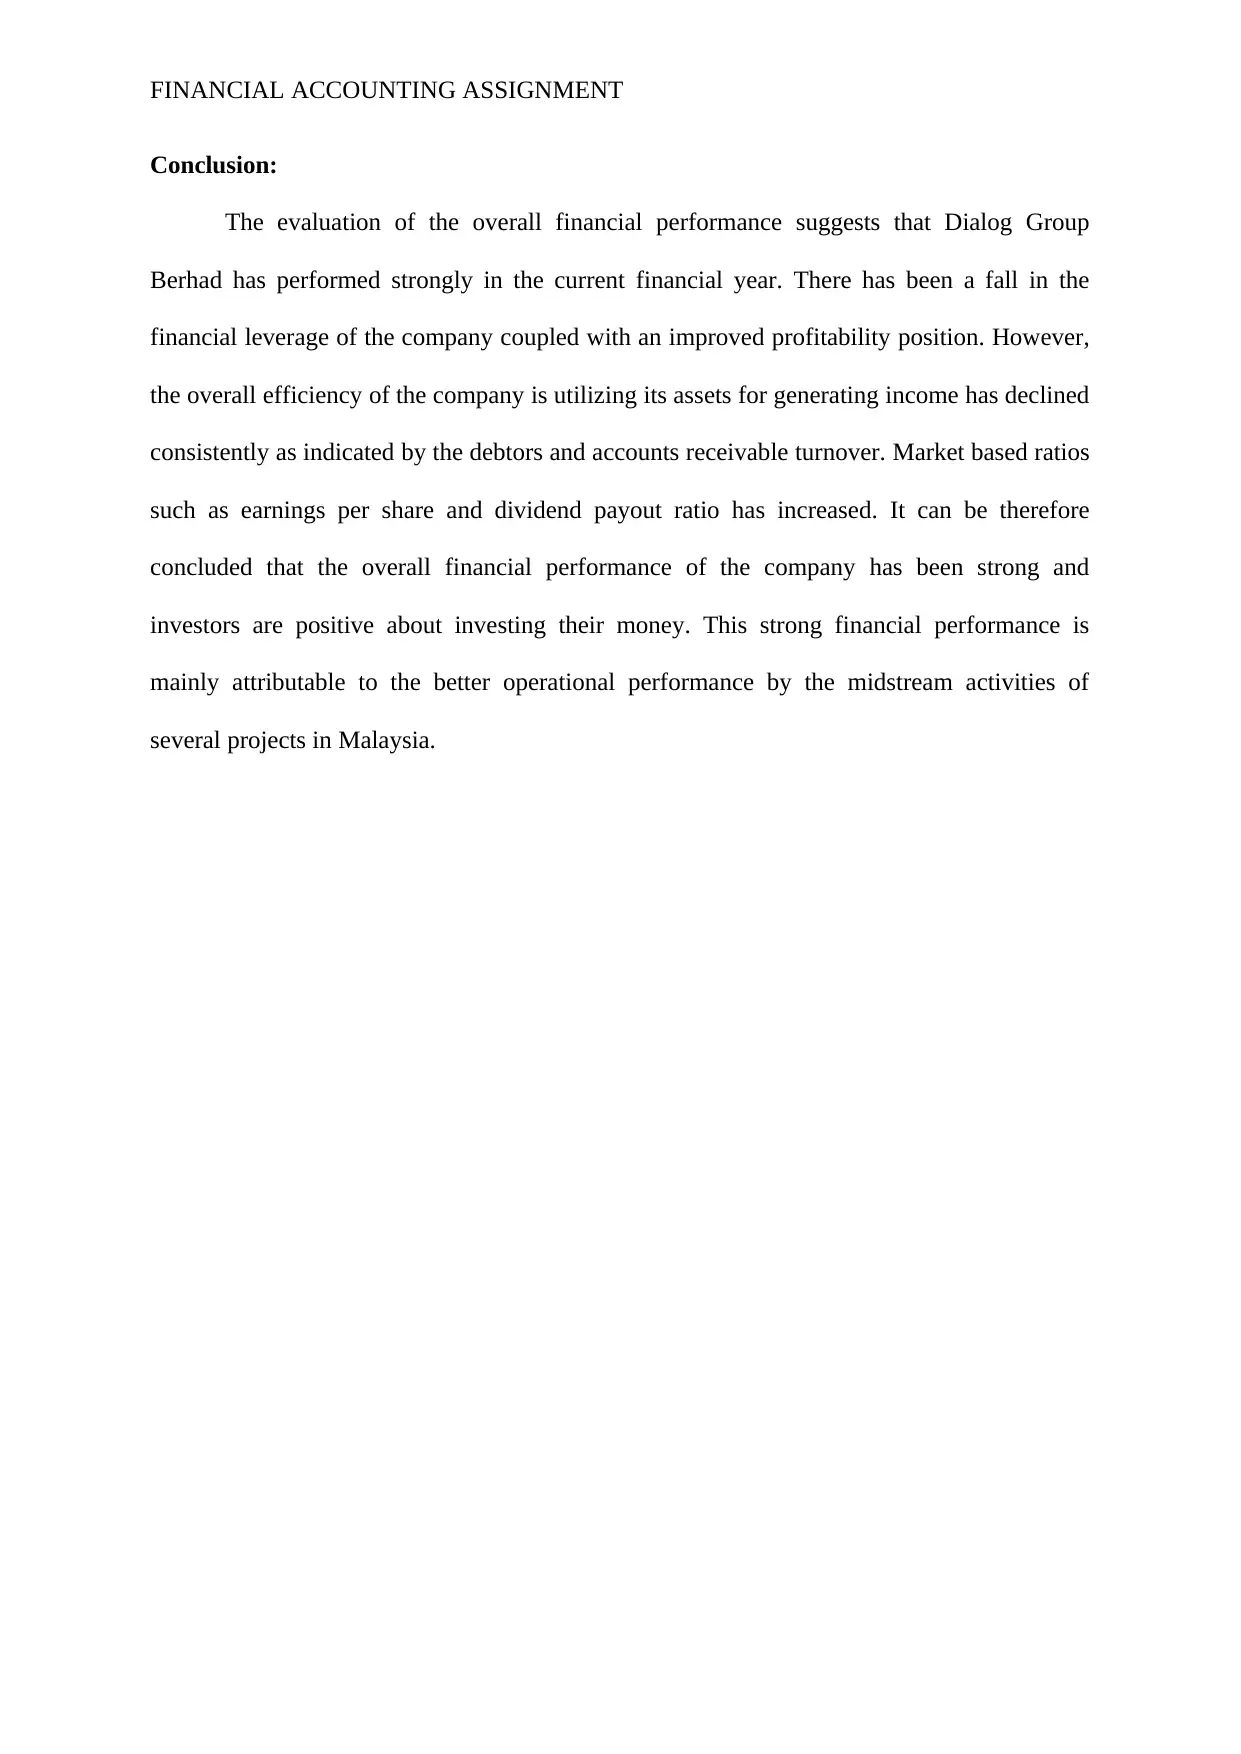
The market performance of Dialog group is evaluated by computing the ratios such as
earning per share and dividend payout ratios. It is identified from the chart that the current
financial year marked a significant increase in the earnings per share to 9.50 compared to the
figures reported in the previous years of 2018 and 2017 at 9.1 and 6.9 respectively. Dividend
payout ratio on other hand has declined to 34.09% in year 2018 as against 39.95% in year
2017 and the figure increased to 38.95% in year 2019. It is suggested by the figures of
dividend payout ratio that the trend of making payment of dividend is consistent and thereby
making it favourable for investors to make investment.
2019 2018 2017
0.00
1.00
2.00
3.00
4.00
5.00
6.00
7.00
8.00
9.00
10.00 9.5 9.1
6.9
38.95% 34.09% 39.95%
Market based ratios
Earning per share Dividend payout ratio
Chart 5:
2019 2018 2017
0.00
0.10
0.20
0.30
0.40
0.50
0.60
0.70
0.80
0.90
0.72 0.77 0.82
0.42 0.43 0.45
0.58 0.57 0.55
Solvency ratios
Debt to Equity Ratio
Debt Ratio
Equity Ratio
Chart 4:
The market performance of Dialog group is evaluated by computing the ratios such as
earning per share and dividend payout ratios. It is identified from the chart that the current
financial year marked a significant increase in the earnings per share to 9.50 compared to the
figures reported in the previous years of 2018 and 2017 at 9.1 and 6.9 respectively. Dividend
payout ratio on other hand has declined to 34.09% in year 2018 as against 39.95% in year
2017 and the figure increased to 38.95% in year 2019. It is suggested by the figures of
dividend payout ratio that the trend of making payment of dividend is consistent and thereby
making it favourable for investors to make investment.
2019 2018 2017
0.00
1.00
2.00
3.00
4.00
5.00
6.00
7.00
8.00
9.00
10.00 9.5 9.1
6.9
38.95% 34.09% 39.95%
Market based ratios
Earning per share Dividend payout ratio
Chart 5:
⊘ This is a preview!⊘
Do you want full access?
Subscribe today to unlock all pages.
Trusted by 1+ million students worldwide
FINANCIAL ACCOUNTING ASSIGNMENT
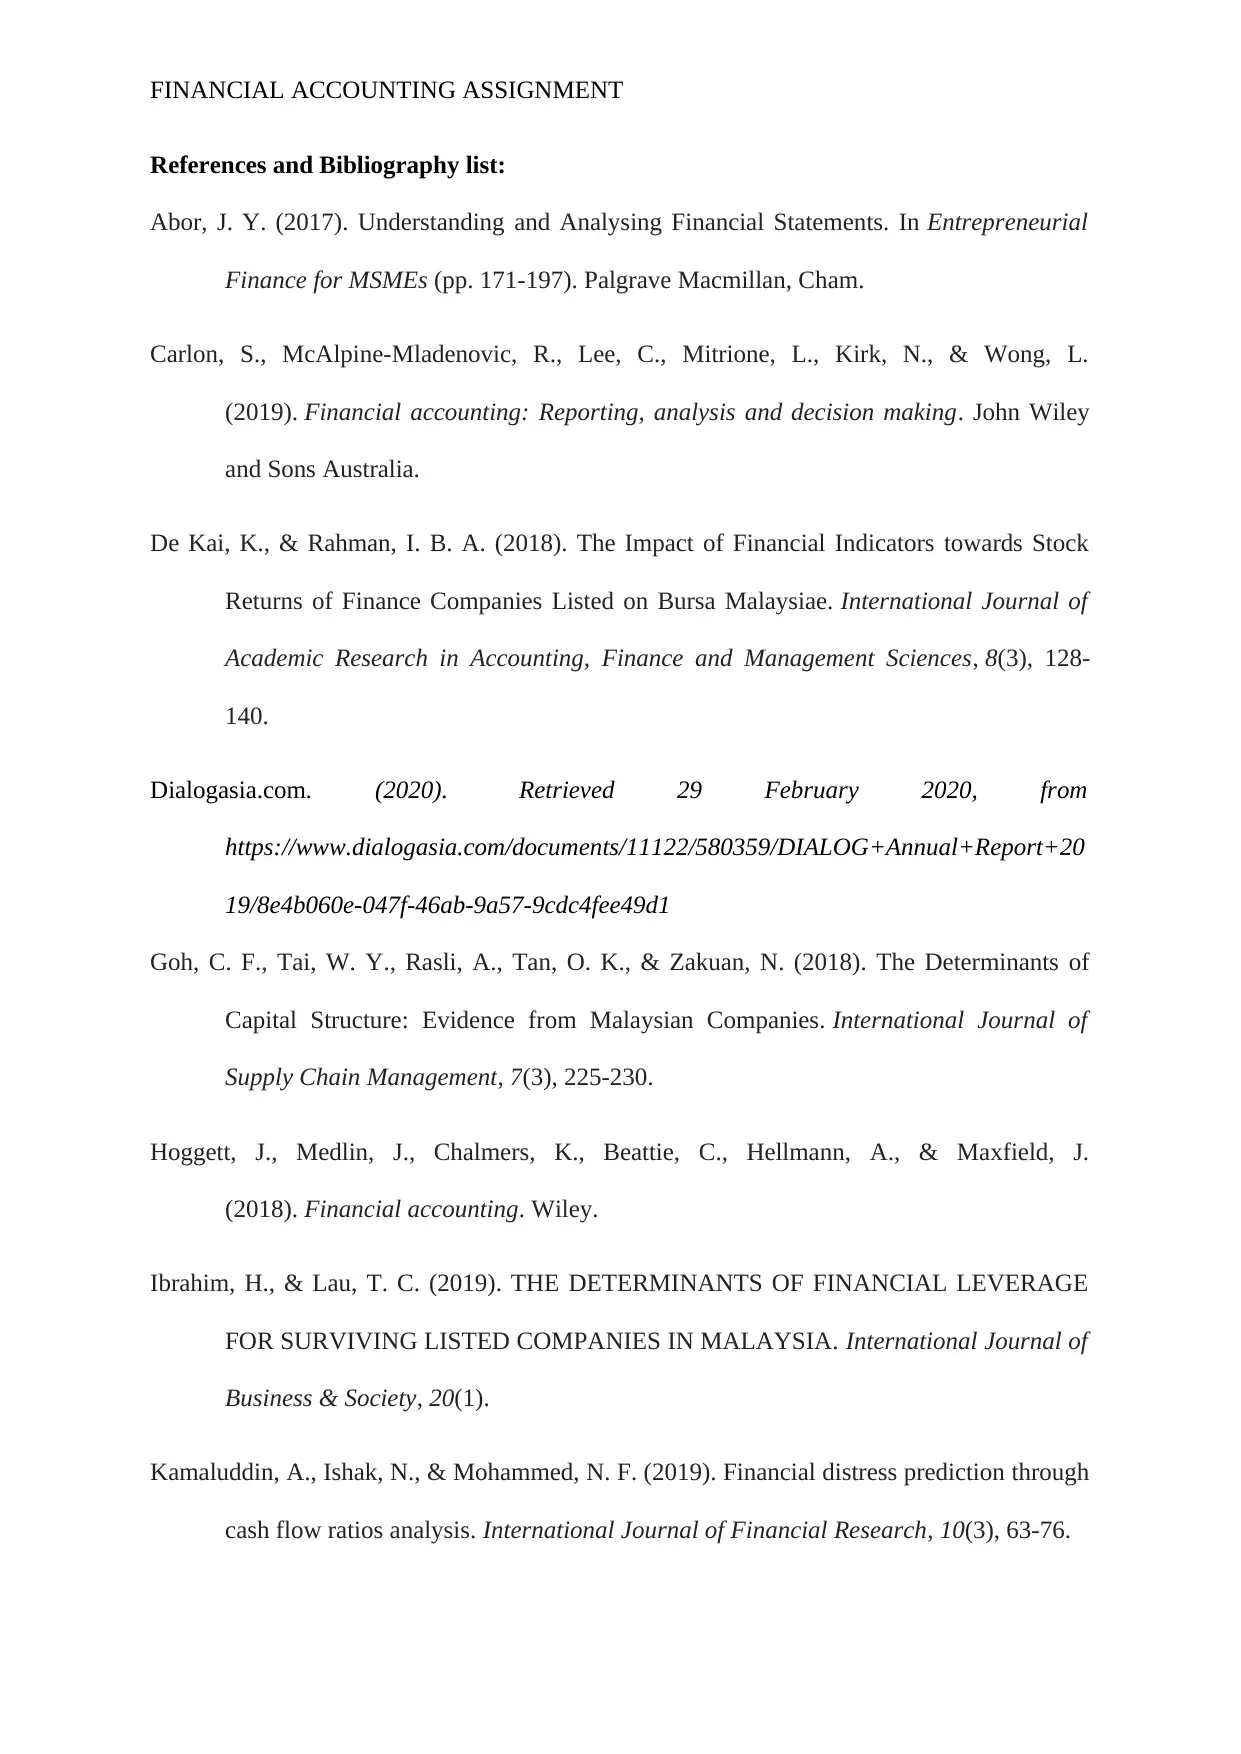
Conclusion:
The evaluation of the overall financial performance suggests that Dialog Group
Berhad has performed strongly in the current financial year. There has been a fall in the
financial leverage of the company coupled with an improved profitability position. However,
the overall efficiency of the company is utilizing its assets for generating income has declined
consistently as indicated by the debtors and accounts receivable turnover. Market based ratios
such as earnings per share and dividend payout ratio has increased. It can be therefore
concluded that the overall financial performance of the company has been strong and
investors are positive about investing their money. This strong financial performance is
mainly attributable to the better operational performance by the midstream activities of
several projects in Malaysia.
Paraphrase This Document
Need a fresh take? Get an instant paraphrase of this document with our AI Paraphraser
FINANCIAL ACCOUNTING ASSIGNMENT
References and Bibliography list:
Abor, J. Y. (2017). Understanding and Analysing Financial Statements. In Entrepreneurial
Finance for MSMEs (pp. 171-197). Palgrave Macmillan, Cham.
Carlon, S., McAlpine-Mladenovic, R., Lee, C., Mitrione, L., Kirk, N., & Wong, L.
(2019). Financial accounting: Reporting, analysis and decision making. John Wiley
and Sons Australia.
De Kai, K., & Rahman, I. B. A. (2018). The Impact of Financial Indicators towards Stock
Returns of Finance Companies Listed on Bursa Malaysiae. International Journal of
Academic Research in Accounting, Finance and Management Sciences, 8(3), 128-
140.
Dialogasia.com. (2020). Retrieved 29 February 2020, from
https://www.dialogasia.com/documents/11122/580359/DIALOG+Annual+Report+20
19/8e4b060e-047f-46ab-9a57-9cdc4fee49d1
Goh, C. F., Tai, W. Y., Rasli, A., Tan, O. K., & Zakuan, N. (2018). The Determinants of
Capital Structure: Evidence from Malaysian Companies. International Journal of
Supply Chain Management, 7(3), 225-230.
Hoggett, J., Medlin, J., Chalmers, K., Beattie, C., Hellmann, A., & Maxfield, J.
(2018). Financial accounting. Wiley.
Ibrahim, H., & Lau, T. C. (2019). THE DETERMINANTS OF FINANCIAL LEVERAGE
FOR SURVIVING LISTED COMPANIES IN MALAYSIA. International Journal of
Business & Society, 20(1).
Kamaluddin, A., Ishak, N., & Mohammed, N. F. (2019). Financial distress prediction through
cash flow ratios analysis. International Journal of Financial Research, 10(3), 63-76.
FINANCIAL ACCOUNTING ASSIGNMENT
Kimmel, P. D., Weygandt, J. J., & Kieso, D. E. (2018). Financial accounting: tools for
business decision making. John Wiley & Sons.
Raza, A., Hussin, W. N. W., & Majid, J. A. (2019). Delisting of firms in Malaysia; what the
financial conditions and auditor reports reveal?. Advances in Social Sciences
Research Journal, 6(5).
Schroeder, R. G., Clark, M. W., & Cathey, J. M. (2019). Financial accounting theory and
analysis: text and cases. John Wiley & Sons.
Sharif, O., Hasan, M., Kurniasari, F., Hermawan, A., & Gunardi, A. (2019). Productivity and
efficiency analysis using DEA: Evidence from financial companies listed in bursa
Malaysia. Management Science Letters, 9(2), 301-312.
Shin, W. K., & Thaker, H. M. T. (2017). Macroeconomic Variables, Financial Ratios and
Property Stock Prices in Malaysia. International Journal Of Business and
Innovation, 3(1).
⊘ This is a preview!⊘
Do you want full access?
Subscribe today to unlock all pages.
Trusted by 1+ million students worldwide
1 out of 12
Related Documents


Your All-in-One AI-Powered Toolkit for Academic Success.
+13062052269
info@desklib.com
Available 24*7 on WhatsApp / Email
![[object Object]](/_next/static/media/star-bottom.7253800d.svg)
Unlock your academic potential
Copyright © 2020–2026 A2Z Services. All Rights Reserved. Developed and managed by ZUCOL.