University Financial Accounting Assignment: Statements of Cash Flow
VerifiedAdded on  2022/08/15
|7
|705
|16
Homework Assignment
AI Summary
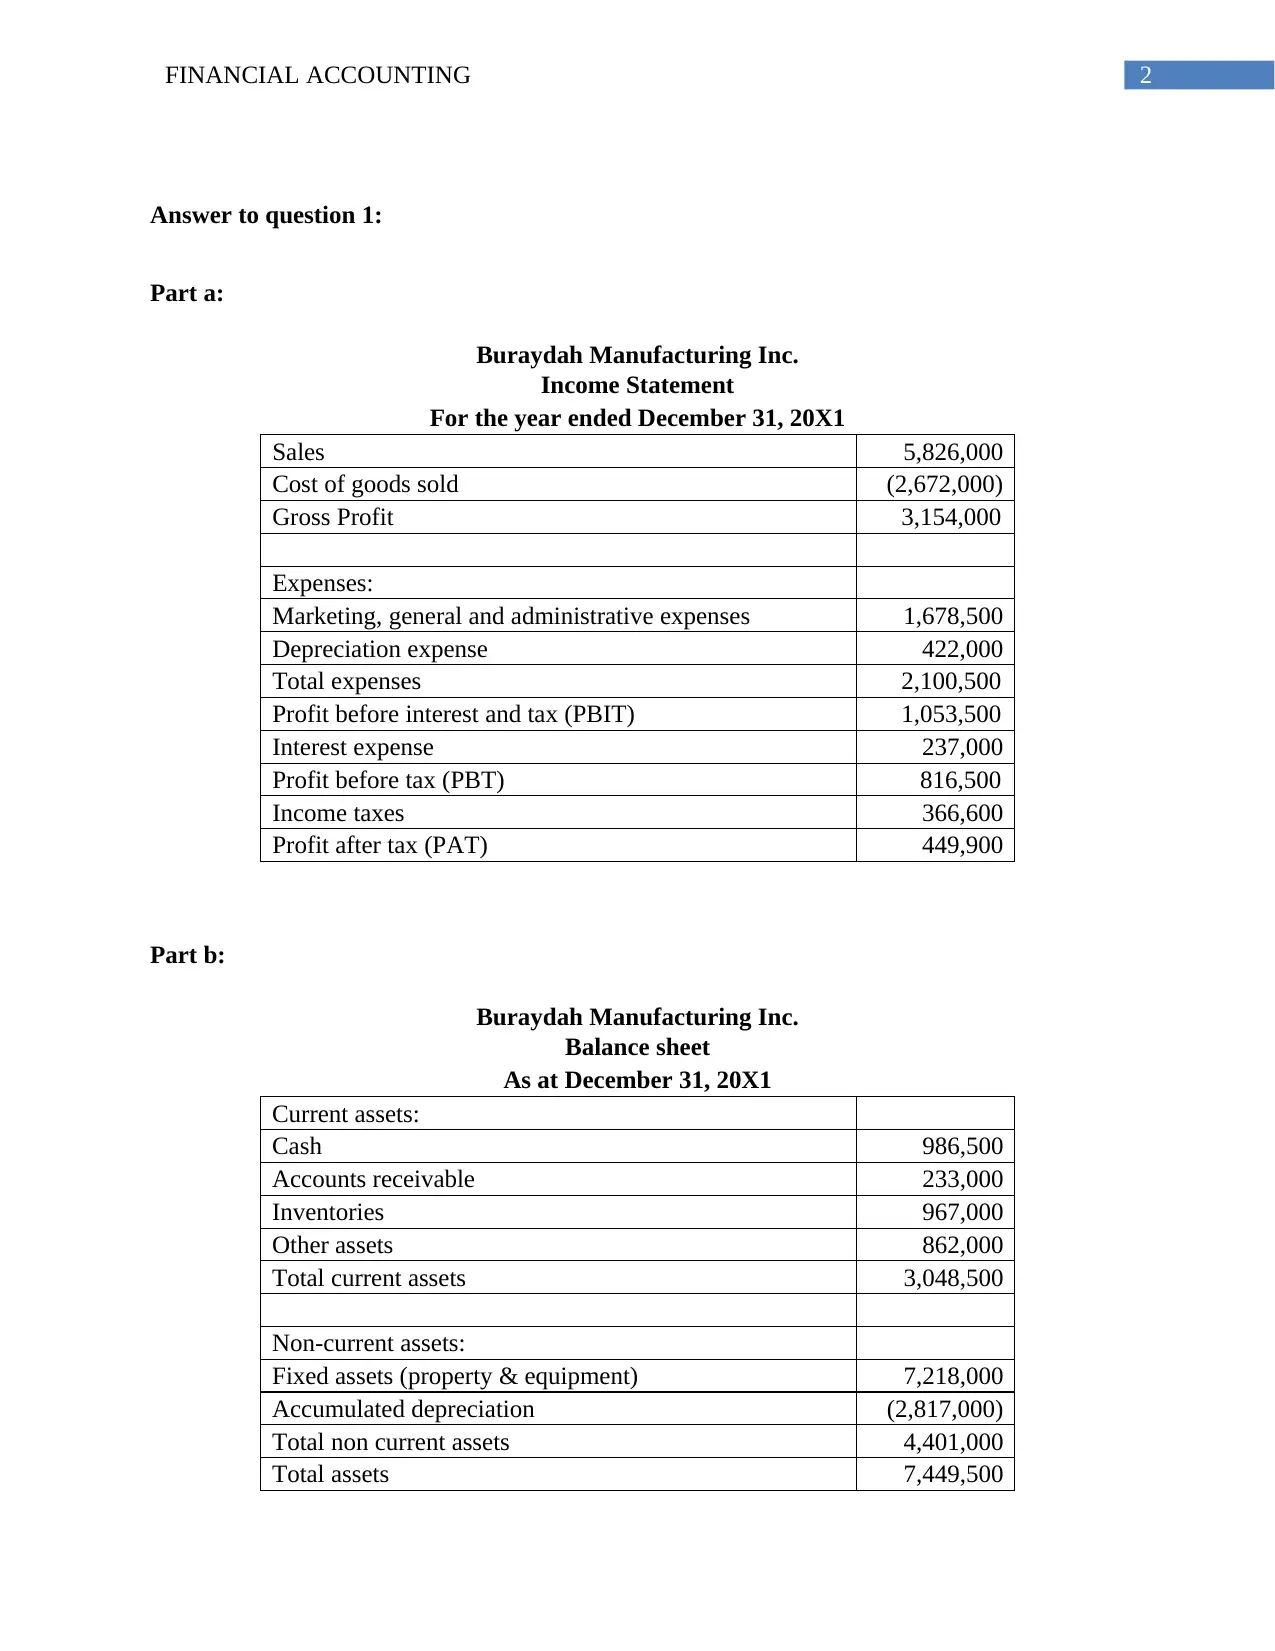
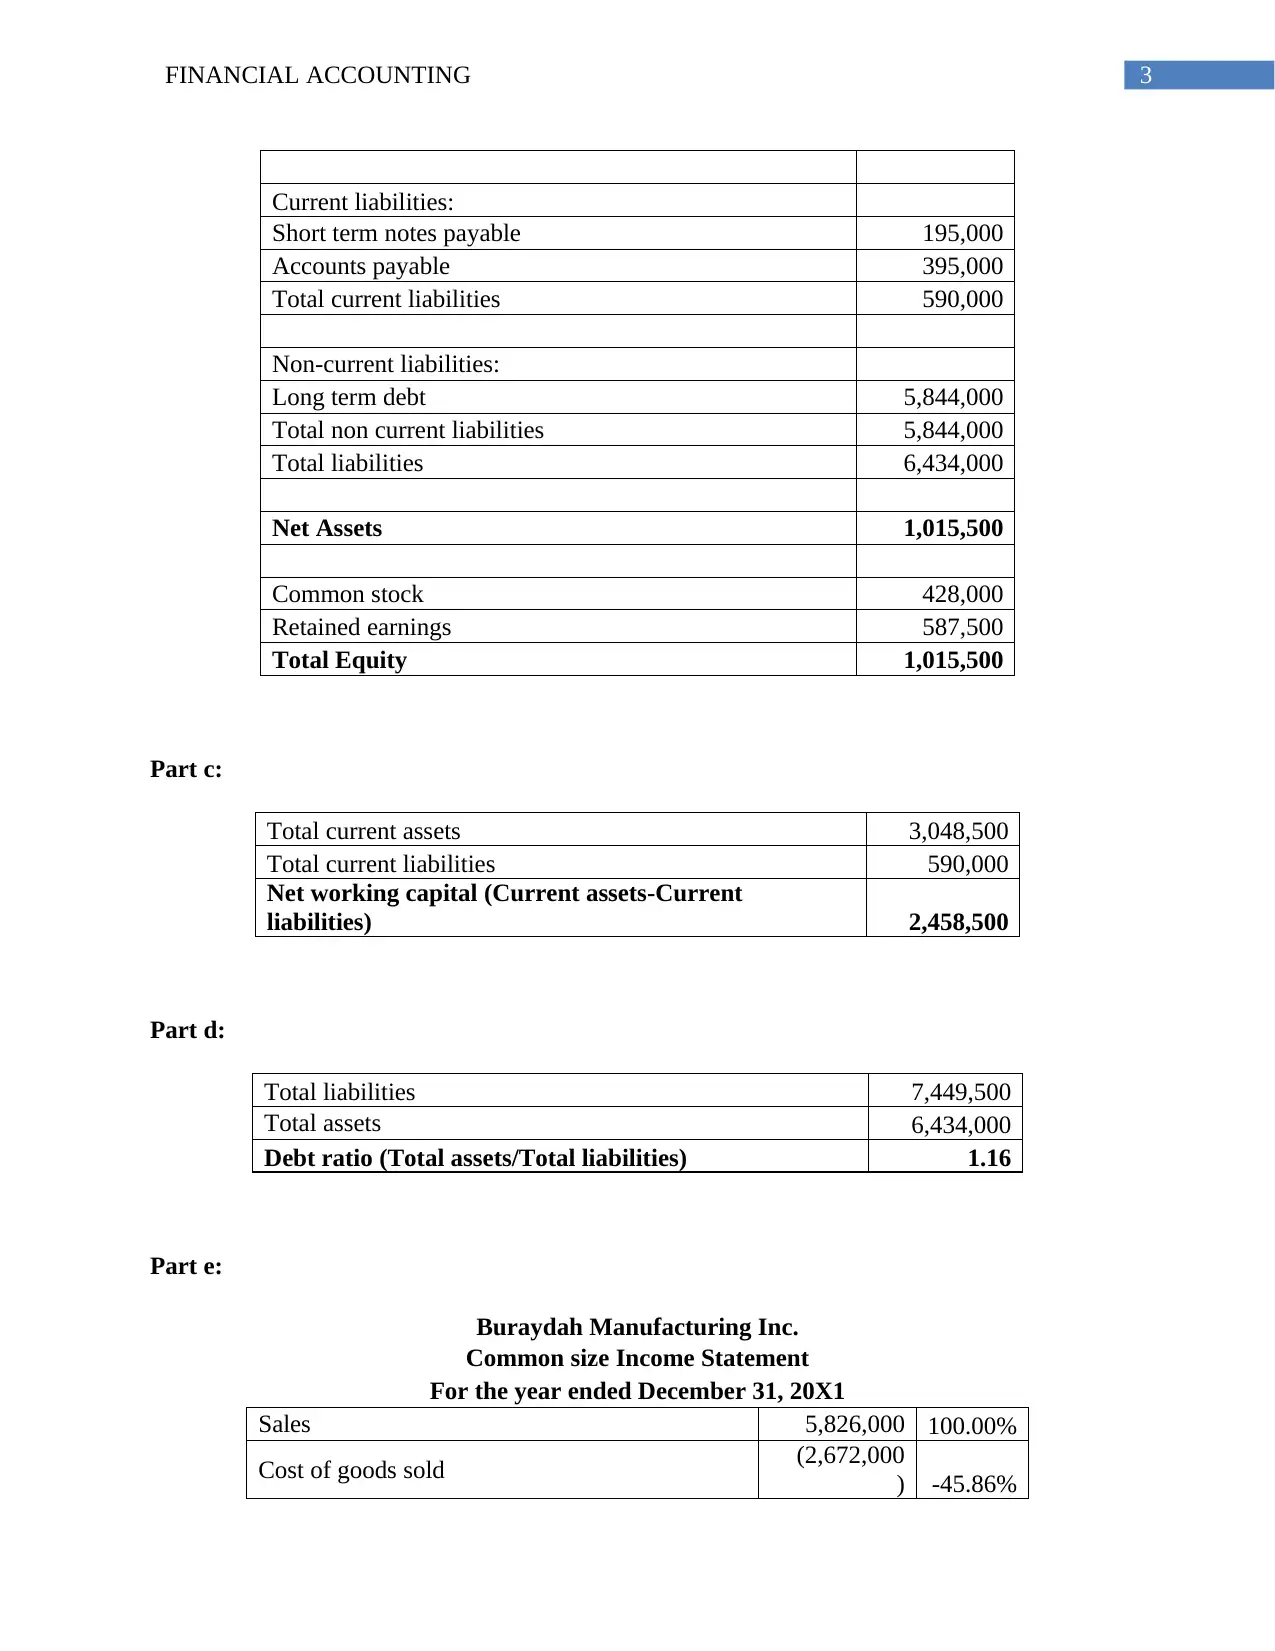
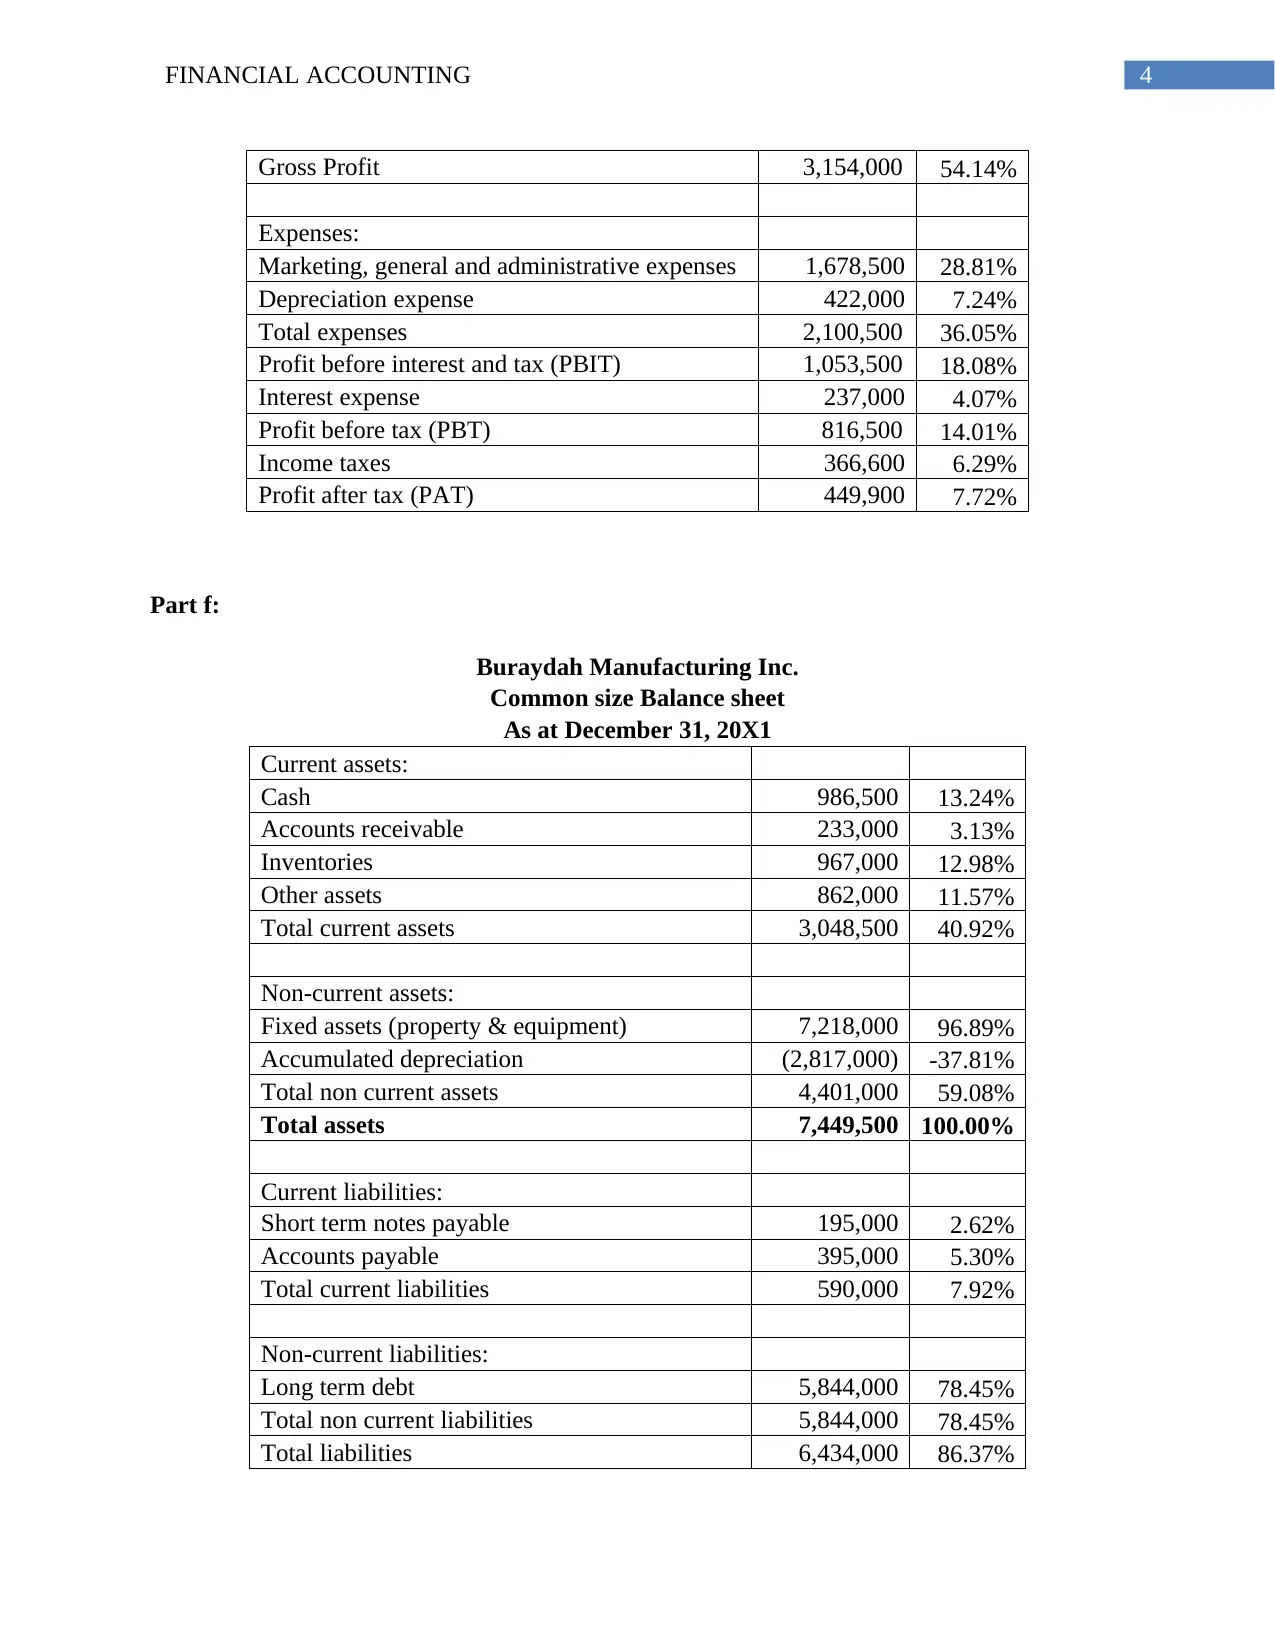
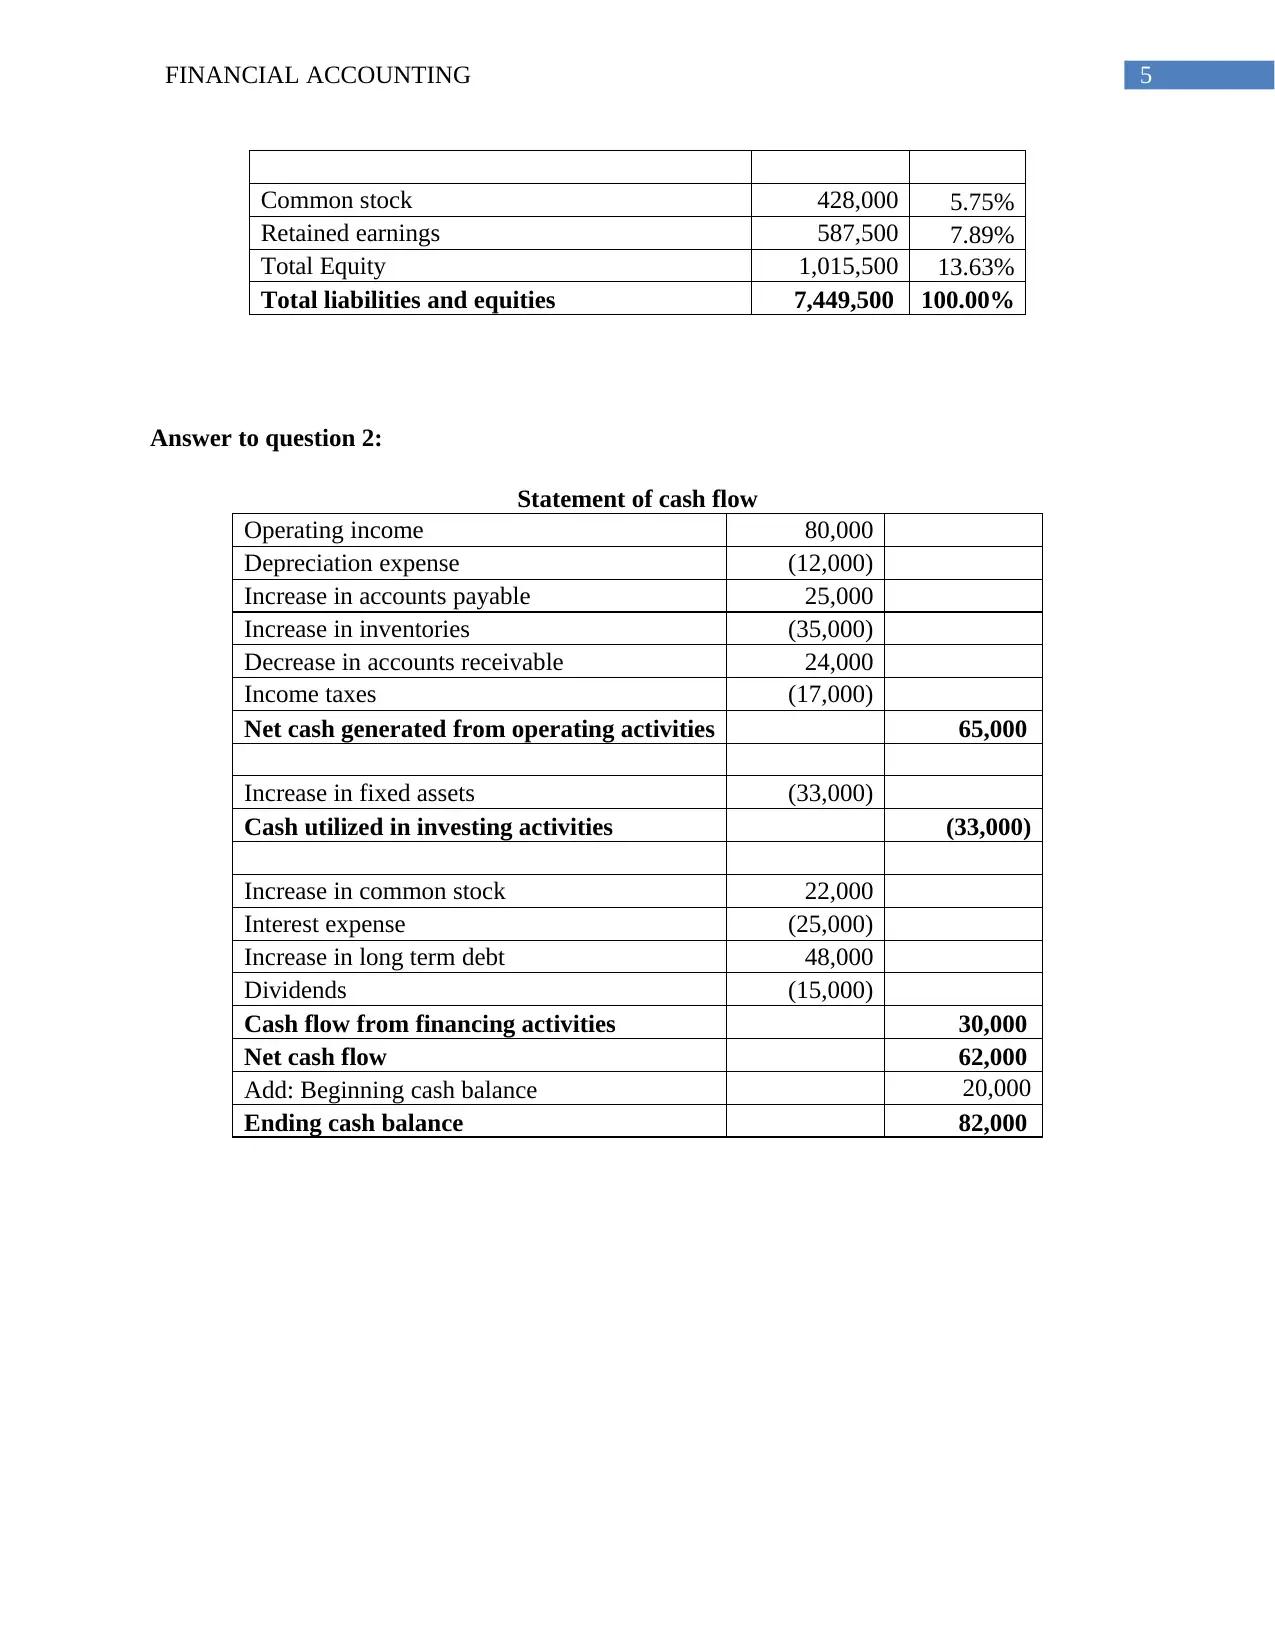
This document presents a comprehensive solution to a financial accounting assignment. It begins by constructing an income statement and balance sheet for Buraydah Manufacturing Inc., followed by the calculation of net working capital and the debt ratio. The solution further includes the preparation of common-size income statements and balance sheets to facilitate comparative financial analysis. Additionally, the assignment encompasses the creation of a statement of cash flows, detailing cash flow from operating, investing, and financing activities. The document is complete with all the required calculations and financial statements, offering a detailed and well-structured approach to financial statement analysis and cash flow management.

Running head: FINANCIAL ACCOUNTING
Financial Accounting
Name of the Student:
Name of the University:
Author’s Note:
Financial Accounting
Name of the Student:
Name of the University:
Author’s Note:
Paraphrase This Document
Need a fresh take? Get an instant paraphrase of this document with our AI Paraphraser

1FINANCIAL ACCOUNTING
Table of Contents
Answer to question 1:......................................................................................................................2
Part a:...........................................................................................................................................2
Part b:...........................................................................................................................................2
Part c:...........................................................................................................................................3
Part d:...........................................................................................................................................3
Part e:...........................................................................................................................................3
Part f:...........................................................................................................................................4
Answer to question 2:......................................................................................................................5
Bibliography:...................................................................................................................................6

2FINANCIAL ACCOUNTING
Answer to question 1:
Part a:
Buraydah Manufacturing Inc.
Income Statement
For the year ended December 31, 20X1
Sales 5,826,000
Cost of goods sold (2,672,000)
Gross Profit 3,154,000
Expenses:
Marketing, general and administrative expenses 1,678,500
Depreciation expense 422,000
Total expenses 2,100,500
Profit before interest and tax (PBIT) 1,053,500
Interest expense 237,000
Profit before tax (PBT) 816,500
Income taxes 366,600
Profit after tax (PAT) 449,900
Part b:
Buraydah Manufacturing Inc.
Balance sheet
As at December 31, 20X1
Current assets:
Cash 986,500
Accounts receivable 233,000
Inventories 967,000
Other assets 862,000
Total current assets 3,048,500
Non-current assets:
Fixed assets (property & equipment) 7,218,000
Accumulated depreciation (2,817,000)
Total non current assets 4,401,000
Total assets 7,449,500
⊘ This is a preview!⊘
Do you want full access?
Subscribe today to unlock all pages.

Trusted by 1+ million students worldwide

3FINANCIAL ACCOUNTING
Current liabilities:
Short term notes payable 195,000
Accounts payable 395,000
Total current liabilities 590,000
Non-current liabilities:
Long term debt 5,844,000
Total non current liabilities 5,844,000
Total liabilities 6,434,000
Net Assets 1,015,500
Common stock 428,000
Retained earnings 587,500
Total Equity 1,015,500
Part c:
Total current assets 3,048,500
Total current liabilities 590,000
Net working capital (Current assets-Current
liabilities) 2,458,500
Part d:
Total liabilities 7,449,500
Total assets 6,434,000
Debt ratio (Total assets/Total liabilities) 1.16
Part e:
Buraydah Manufacturing Inc.
Common size Income Statement
For the year ended December 31, 20X1
Sales 5,826,000 100.00%
Cost of goods sold (2,672,000
) -45.86%
Paraphrase This Document
Need a fresh take? Get an instant paraphrase of this document with our AI Paraphraser

4FINANCIAL ACCOUNTING
Gross Profit 3,154,000 54.14%
Expenses:
Marketing, general and administrative expenses 1,678,500 28.81%
Depreciation expense 422,000 7.24%
Total expenses 2,100,500 36.05%
Profit before interest and tax (PBIT) 1,053,500 18.08%
Interest expense 237,000 4.07%
Profit before tax (PBT) 816,500 14.01%
Income taxes 366,600 6.29%
Profit after tax (PAT) 449,900 7.72%
Part f:
Buraydah Manufacturing Inc.
Common size Balance sheet
As at December 31, 20X1
Current assets:
Cash 986,500 13.24%
Accounts receivable 233,000 3.13%
Inventories 967,000 12.98%
Other assets 862,000 11.57%
Total current assets 3,048,500 40.92%
Non-current assets:
Fixed assets (property & equipment) 7,218,000 96.89%
Accumulated depreciation (2,817,000) -37.81%
Total non current assets 4,401,000 59.08%
Total assets 7,449,500 100.00%
Current liabilities:
Short term notes payable 195,000 2.62%
Accounts payable 395,000 5.30%
Total current liabilities 590,000 7.92%
Non-current liabilities:
Long term debt 5,844,000 78.45%
Total non current liabilities 5,844,000 78.45%
Total liabilities 6,434,000 86.37%

5FINANCIAL ACCOUNTING
Common stock 428,000 5.75%
Retained earnings 587,500 7.89%
Total Equity 1,015,500 13.63%
Total liabilities and equities 7,449,500 100.00%
Answer to question 2:
Statement of cash flow
Operating income 80,000
Depreciation expense (12,000)
Increase in accounts payable 25,000
Increase in inventories (35,000)
Decrease in accounts receivable 24,000
Income taxes (17,000)
Net cash generated from operating activities 65,000
Increase in fixed assets (33,000)
Cash utilized in investing activities (33,000)
Increase in common stock 22,000
Interest expense (25,000)
Increase in long term debt 48,000
Dividends (15,000)
Cash flow from financing activities 30,000
Net cash flow 62,000
Add: Beginning cash balance 20,000
Ending cash balance 82,000
⊘ This is a preview!⊘
Do you want full access?
Subscribe today to unlock all pages.

Trusted by 1+ million students worldwide

6FINANCIAL ACCOUNTING
Bibliography:
Baker, R.E., Lembke, V.C., King, T.E., Jeffrey, C.G. and Christensen, T., 2002. Advanced
financial accounting. McGraw-Hill/Irwin.
Christensen, T., Cottrell, D. and Baker, R., 2013. Advanced financial accounting. McGraw-Hill.
Fischer, P.M., Tayler, W.J. and Cheng, R.H., 2012. Advanced accounting. Cengage Learning.
Lewis, R. and Pendrill, D., 2003. Advanced financial accounting. Pearson Education.
1 out of 7
Related Documents

Your All-in-One AI-Powered Toolkit for Academic Success.
 +13062052269
info@desklib.com
Available 24*7 on WhatsApp / Email
Unlock your academic potential
Copyright © 2020–2025 A2Z Services. All Rights Reserved. Developed and managed by ZUCOL.