Financial Accounting: Exploring Statement Users and Analysis
VerifiedAdded on 2023/04/20
|17
|4382
|311
Report
AI Summary
This report provides an overview of financial accounting, emphasizing the different user groups of financial statements, including owners, investors, management, lenders, suppliers, government, employees, and customers, and their respective needs for financial information. It also analyzes the financial performance of Ryan Air and Delta Airlines using ratio analysis based on their income statements and balance sheets from 2013 to 2015, concluding that while Ryan Air initially showed negative ratios but improved over time, Delta Airlines started strong but faced financial challenges later. The study highlights the importance of financial accounting in assessing a company's financial health and making informed decisions.

Financial accounting
1
1
Paraphrase This Document
Need a fresh take? Get an instant paraphrase of this document with our AI Paraphraser

TABLE OF CONTENTS
INTRODUCTION................................................................................................................................3
1) Explain different user groups of financial statements.................................................................3
CONCLUSION....................................................................................................................................6
REFERENCES.....................................................................................................................................8
APPENDIX 1: INCOME AND BALANCESHEET STATEMENT OF RYAN AIR.........................11
APPENDIX 1: INCOME AND BALANCESHEET STATEMENT OF DELTA AIRLINES...........15
2
INTRODUCTION
Financial accounting is one of the fields of accounting which is concerned with the
summary, analysis and reporting of financial transactions which takes place in a normal course of
business. It involves preparation of financial statements available for the public consumption
(Accounting- Need And Importance, 2016). The financial statements are used by stockholders,
suppliers, banks, employees and government agencies and the business owners. This kind of
financial accounting is governed by both local and international accounting standards. It also
follows generally accepted accounting principles which define different instructions and other
guidelines that assist in operating daily routine business. Financial report is the framework which
provides deeper insight to the business organization and its stakeholders about the monetary
aspects.
1) Explain different user groups of financial statements
A financial statement is a formal record of financial activities to determine the position of
the organization. The relevant financial information is presented in a structured and well defined
manner (Agoglia, Doupnik and Tsakumis, 2011). Following are the different user groups of
financial statements which can be further divided into two main categories such as internal as well
as external user groups:
Owners and investors- These are the basic user groups who use financial statements to find
out facts and information which can affect the financial condition of the company. It involves
shareholders of corporation who requires financial information in taking decisions regarding
finance (Bamber, Jiang and Wang, 2010). This act as a instrument which helps in taking better
decisions related to holding, selling and purchasing of new asset.Assessment of future growth and
profitability of a company is helpful for the potential investors. This instrument acts as a decision
tool to analyze the external forces implications on the current state of the business to take forward
step in life. Shareholders use financial statements to assess the risk and return on their investment in
a firm (Chen and et.al., 2010). Shareholders can use capital budgeting techniques to evaluate its
returns from the prospective returns from the potential investment. Investors may predict future
dividends based on the profits which is accurately disclosed in financial statements. Further, risk
associated with the investment may be gauged from the financial statements.
Management- The definition of management is different for every business such as owner
for small business. In large organisations, management is made up of hired professionals who are
entrusted with the responsibility of operating the activities or a part of the business. It require
financial statements to manage the affairs of the company by assessing financial performance
3
⊘ This is a preview!⊘
Do you want full access?
Subscribe today to unlock all pages.
Trusted by 1+ million students worldwide
(Colson and et.al., 2010). Management plays a significant role in the whole organization in terms of
managing the targets to complete on time with high level of accuracy. The management needs to
comply with all rules and regulations imposed on the business. It is regarded as a head of the
organisation in achieving higher efficiency and effectiveness. The relevancy of different forms of
financial statements is different for the individuals. It includes income statement, balance sheet and
cash flow statements (Henderson and et. al., 2015). These financial statements will affect the
decision of business which may pose threats for the business.
Lenders- Lenders lend their money to business on basic terms and conditions and specified
amount of interest as a token of appreciation for helping business in tough and complex situations.
Lenders of funds include banks and other financial institutions who are interested in the company's
ability to pay its liabilities and obligations on its maturity (Lovell, 2014). These lenders will lend
amount to various business by judging its current efficiency to assure that they will get their amount
back. In today's competitive and complex environment, the scope of these financial institutions has
increased in providing different services to their regular as well as potential clients (Oler, Oler and
Skousen, 2010). They use financial statements as a tool to monitor the significant changes which
may takes place in daily routine business which may affect the profitability of the company.
Lenders use the financial facts and information to determine whether they should extend credit to
the business or restrict the amount of credit which has already been extended. The main focus of the
lender is to measure the overall changes which take place in the graph of credit taken by the
company.
Trade creditors or suppliers- Suppliers need financial statements to determine the credit
worthiness of an enterprise to ascertain whether to supply goods on credit or not (Song, Thomas and
Yi, 2010). Suppliers are required know that the business is able to pay back its liability towards the
supplier or can get into liquidity trap or bankrupt. Terms of credit plays a significant role in
determining the financial health of its customers. Credit terms will form as legal evidence in case of
any default done by any party. Financial statements act as a weapon against the defaulters to the
contract. The company is required to make a separate provision for trade creditors to ensure its
correct and timely payment (Weil, Schipper and Francis, 2013).
Government- Government bodies of the state most importantly tax authorities will greatly
affect the smooth functioning of the business. Tax authorities are interested in an entity's financial
information for taxation and other regulatory purposes (Badertscher, Burks and Easton, 2011).
Government require financial statements to determine the correctness of tax declared in the tax
returns. They also keep track of economic progress by analyzing the financial statements of
businesses from different sectors of the economy. There are several government agencies that need
4
Paraphrase This Document
Need a fresh take? Get an instant paraphrase of this document with our AI Paraphraser
to know how the economy is performing to plan financial and industrial policies. The tax authorities
also consider different statements which shows financial data as a basis for assessing the amount of
tax payable by a business (Biondi and et.al., 2011).
Employee- Employees are interested in the company's financial statements to assess its
profitability and stability. These two factors play a significant role in ensuring permanent job
position of employees in the firm (Choi, 2013). Profitability is very effective for employees as it
will assure them that they will get deserving salaries and other employment benefits. These may
include incentives, perks, allowances and overtime compensation. They are also interested in
financial position and performance to assess company’s expansion possibilities. It is also beneficial
for an enterprise in providing ample of career opportunities and business development chances
which in return increases the job role of all employees (Edwards, 2013).
Customers- For every organisation, customer is regarded as a king of the market as it will
spoil or make a career of the business (Li, 2010). The implications of external users especially of
customer can be positive as well as negative which depends on the capability of a person. The long
term involvement of a person with the company is a good sign which states that company will
achieve its desired goals and the objectives in a reasonable time period. Customers are interested in
knowing minute details about the organization to continue its existence and maintain stability of
operations. This need is heightened in cases where the customers depend upon the entity (Macve,
2015).
LONDON STOCK MARKET
It is a stock exchange which is located in the city of London in United Kingdom. This
market had a market capitalisation of US$ 6.06 trillion. This stock market ranks among third largest
stock exchange in the whole nation (Rutherford, 2010). It was founded in 1801 and its current
premises are situated in Paternoster Square which is closest to St Paul's Cathedral in the same city.
The exchange is one of the subsidiaries of the London stock exchange group. It is one of the world's
oldest stock exchanges and can trace its history back more than 300 years. It is also known as Royal
exchange as it was founded by English financier Thomas Gresham on the model of the Antwerp
Bourse as a stock exchange (Uyar and Gungormus, 2016). Its performance has been affected with
several wars such as First World War and Second World War. It issues different types of securities
which are offered to general public as well as different companies. It deals in two kinds of markets
which include primary as well as secondary markets. There are several companies listed in this
stock exchange but here two companies are taken into considerations which are following:
Ryan Air- It is an Irish low cost airline which is headquartered in Swords in Dublin Ireland.
Ryan Air was the largest European airlines which are regarded as common passenger airline and
5
busiest international airline with high number of arrival count. This airline has been characterised
by its rapid expansion and as a result of the deregulation of the aviation industry. The success of its
low cost business model attracted large number of customers by providing valuable services to them
(Agoglia, Doupnik and Tsakumis, 2011).
Delta Airlines- It is a major American airline which is located at Harts field. This airline
along with its subsidiaries and regional affiliates operates more than 5400 flights. It serves an
extensive domestic as well as international network that includes 334 destinations in 64 countries.
Delta is one of the tour founding members of the Sky Team airline alliance which works as a joint
venture with other strong companies (Colson and et.al., 2010).
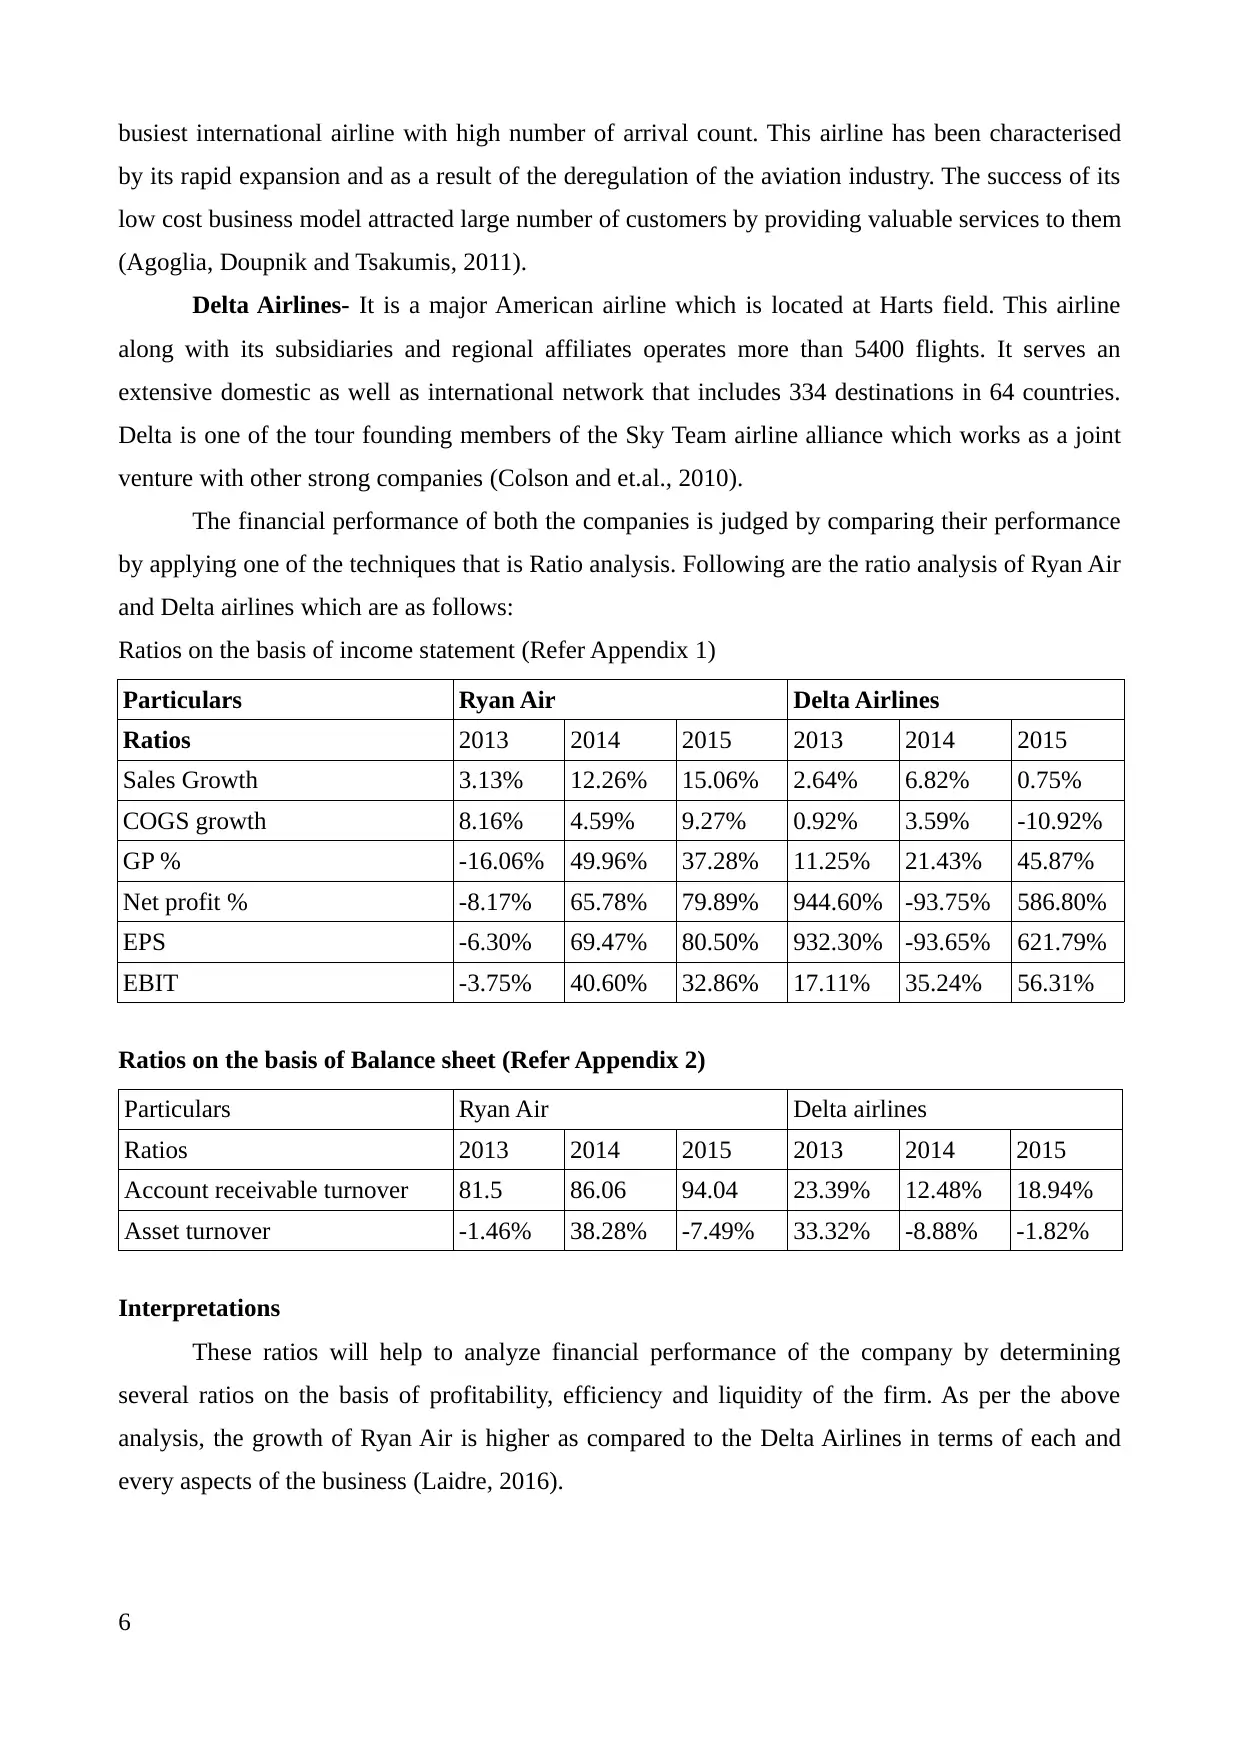
The financial performance of both the companies is judged by comparing their performance
by applying one of the techniques that is Ratio analysis. Following are the ratio analysis of Ryan Air
and Delta airlines which are as follows:
Ratios on the basis of income statement (Refer Appendix 1)
Particulars Ryan Air Delta Airlines
Ratios 2013 2014 2015 2013 2014 2015
Sales Growth 3.13% 12.26% 15.06% 2.64% 6.82% 0.75%
COGS growth 8.16% 4.59% 9.27% 0.92% 3.59% -10.92%
GP % -16.06% 49.96% 37.28% 11.25% 21.43% 45.87%
Net profit % -8.17% 65.78% 79.89% 944.60% -93.75% 586.80%
EPS -6.30% 69.47% 80.50% 932.30% -93.65% 621.79%
EBIT -3.75% 40.60% 32.86% 17.11% 35.24% 56.31%
Ratios on the basis of Balance sheet (Refer Appendix 2)
Particulars Ryan Air Delta airlines
Ratios 2013 2014 2015 2013 2014 2015
Account receivable turnover 81.5 86.06 94.04 23.39% 12.48% 18.94%
Asset turnover -1.46% 38.28% -7.49% 33.32% -8.88% -1.82%
Interpretations
These ratios will help to analyze financial performance of the company by determining
several ratios on the basis of profitability, efficiency and liquidity of the firm. As per the above
analysis, the growth of Ryan Air is higher as compared to the Delta Airlines in terms of each and
every aspects of the business (Laidre, 2016).
6
by its rapid expansion and as a result of the deregulation of the aviation industry. The success of its
low cost business model attracted large number of customers by providing valuable services to them
(Agoglia, Doupnik and Tsakumis, 2011).
Delta Airlines- It is a major American airline which is located at Harts field. This airline
along with its subsidiaries and regional affiliates operates more than 5400 flights. It serves an
extensive domestic as well as international network that includes 334 destinations in 64 countries.
Delta is one of the tour founding members of the Sky Team airline alliance which works as a joint
venture with other strong companies (Colson and et.al., 2010).
The financial performance of both the companies is judged by comparing their performance
by applying one of the techniques that is Ratio analysis. Following are the ratio analysis of Ryan Air
and Delta airlines which are as follows:
Ratios on the basis of income statement (Refer Appendix 1)
Particulars Ryan Air Delta Airlines
Ratios 2013 2014 2015 2013 2014 2015
Sales Growth 3.13% 12.26% 15.06% 2.64% 6.82% 0.75%
COGS growth 8.16% 4.59% 9.27% 0.92% 3.59% -10.92%
GP % -16.06% 49.96% 37.28% 11.25% 21.43% 45.87%
Net profit % -8.17% 65.78% 79.89% 944.60% -93.75% 586.80%
EPS -6.30% 69.47% 80.50% 932.30% -93.65% 621.79%
EBIT -3.75% 40.60% 32.86% 17.11% 35.24% 56.31%
Ratios on the basis of Balance sheet (Refer Appendix 2)
Particulars Ryan Air Delta airlines
Ratios 2013 2014 2015 2013 2014 2015
Account receivable turnover 81.5 86.06 94.04 23.39% 12.48% 18.94%
Asset turnover -1.46% 38.28% -7.49% 33.32% -8.88% -1.82%
Interpretations
These ratios will help to analyze financial performance of the company by determining
several ratios on the basis of profitability, efficiency and liquidity of the firm. As per the above
analysis, the growth of Ryan Air is higher as compared to the Delta Airlines in terms of each and
every aspects of the business (Laidre, 2016).
6
⊘ This is a preview!⊘
Do you want full access?
Subscribe today to unlock all pages.
Trusted by 1+ million students worldwide

CONCLUSION
From the above study it can be concluded that financial accounting have a major role in
determining the financial performance of the company. The different users of the financial
statements use different forms of financial statements to achieve their desired goals and the
objectives. The performance of the two companies Ryan Air and Delta Airlines will clearly reflect
the actual conditions of a firm. It states that Ryan Air starts with negative ratios but slowly moved
on the path of success. On the contrary, delta Airlines will be on stable position in beginning and
slowly goes into debt trap by showing negative ratios.
7
Paraphrase This Document
Need a fresh take? Get an instant paraphrase of this document with our AI Paraphraser
REFERENCES
Books and Journals
Agoglia, C.P., Doupnik, T.S. and Tsakumis, G.T., 2011. Principles-based versus rules-based
accounting standards: The influence of standard precision and audit committee strength on
financial reporting decisions. The Accounting Review. 86(3). pp. 747-767.
Badertscher, B.A., Burks, J.J. and Easton, P.D., 2011. A convenient scapegoat: Fair value
accounting by commercial banks during the financial crisis. The Accounting Review. 87(1).
pp. 59-90.
Bamber, L.S., Jiang, J. and Wang, I.Y., 2010. What's my style? The influence of top managers on
voluntary corporate financial disclosure. The accounting review. 85(4). pp. 1131-1162.
Biondi, Y. and et.al., 2011. A Perspective on the Joint IASB/FASB Exposure Draft on Accounting
for Leases: American Accounting Association's Financial Accounting Standards Committee
(AAA FASC).Accounting Horizons. 25(4). pp. 861-871.
Chen, H. and et.al., 2010. The role of international financial reporting standards in accounting
quality: Evidence from the European Union. Journal of International Financial
Management & Accounting. 21(3). pp. 220-278.
Choi, S., 2013. The Linkage Strategies Between Productivity Metrics and Financial Accounting
Metrics in TPM and PAC Activities. Journal of the Korea Safety Management and Science.
15(3). pp. 151-161.
Colson, R.H. and et.al., 2010. Response to the Financial Accounting Standards Board's and the
International Accounting Standards Board's Joint Discussion Paper Entitled Preliminary
Views on Revenue Recognition in Contracts with Customers. Accounting horizons. 24(4).
pp. 689-702.
Edwards, J.R., 2013. A History of Financial Accounting (RLE Accounting)(Vol. 29). Routledge.
Gassen, J., 2014. Causal inference in empirical archival financial accounting research. Accounting,
Organizations and Society. 39(7). pp. 535-544.
Henderson, S. and et. al., 2015. Issues in financial accounting. Pearson Higher Education AU.
Kimmel, P.D., Weygandt, J.J. and Kieso, D.E., 2010. Financial accounting: tools for business
decision making. John Wiley & Sons.
Li, S., 2010. Does mandatory adoption of International Financial Reporting Standards in the
European Union reduce the cost of equity capital?. The accounting review. 85(2). pp. 607-
636.
Lovell, H., 2014. Climate change, markets and standards: the case of financial accounting. Economy
and Society. 43(2). pp. 260-284.
Macve, R., 2015. A Conceptual Framework for Financial Accounting and Reporting: Vision, Tool,
Or Threat?. Routledge.
8
Oler, D.K., Oler, M.J. and Skousen, C.J., 2010. Characterizing accounting research. Accounting
Horizons. 24(4). pp. 635-670.
Rutherford, B.A., 2010. The social scientific turn in UK financial accounting research: a
philosophical and sociological analysis. Accounting and Business Research. 40(2). pp. 149-
171.
Song, C.J., Thomas, W.B. and Yi, H., 2010. Value relevance of FAS No. 157 fair value hierarchy
information and the impact of corporate governance mechanisms. The Accounting Review.
85(4). pp. 1375-1410.
Uyar, A. and Gungormus, A.H., 2016. Factors associated with student performance in financial
accounting course. European Journal of Economic and Political Studies. 4(2). pp. 141-156.
Weil, R.L., Schipper, K. and Francis, J., 2013. Financial accounting: an introduction to concepts,
methods and uses. Cengage Learning.
Online
Accounting- Need And Importance. 2016. [Online]. Available through:
<http://fareedsiddiqui.expertscolumn.com/article/accounting-need-and-importance>.
[Accessed on 6th August, 2016].
Laidre, A., 2016. The Importance of Financial Ratios. [Online]. Available through:
<http://www.iplanner.net/business-financial/online/how-to-articles.aspx?
article_id=financial-ratios >. [Accessed on 6th August, 2016].
APPENDIX 1: INCOME AND BALANCESHEET STATEMENT OF RYAN
AIR
Income statement of Ryan Air
9
⊘ This is a preview!⊘
Do you want full access?
Subscribe today to unlock all pages.
Trusted by 1+ million students worldwide
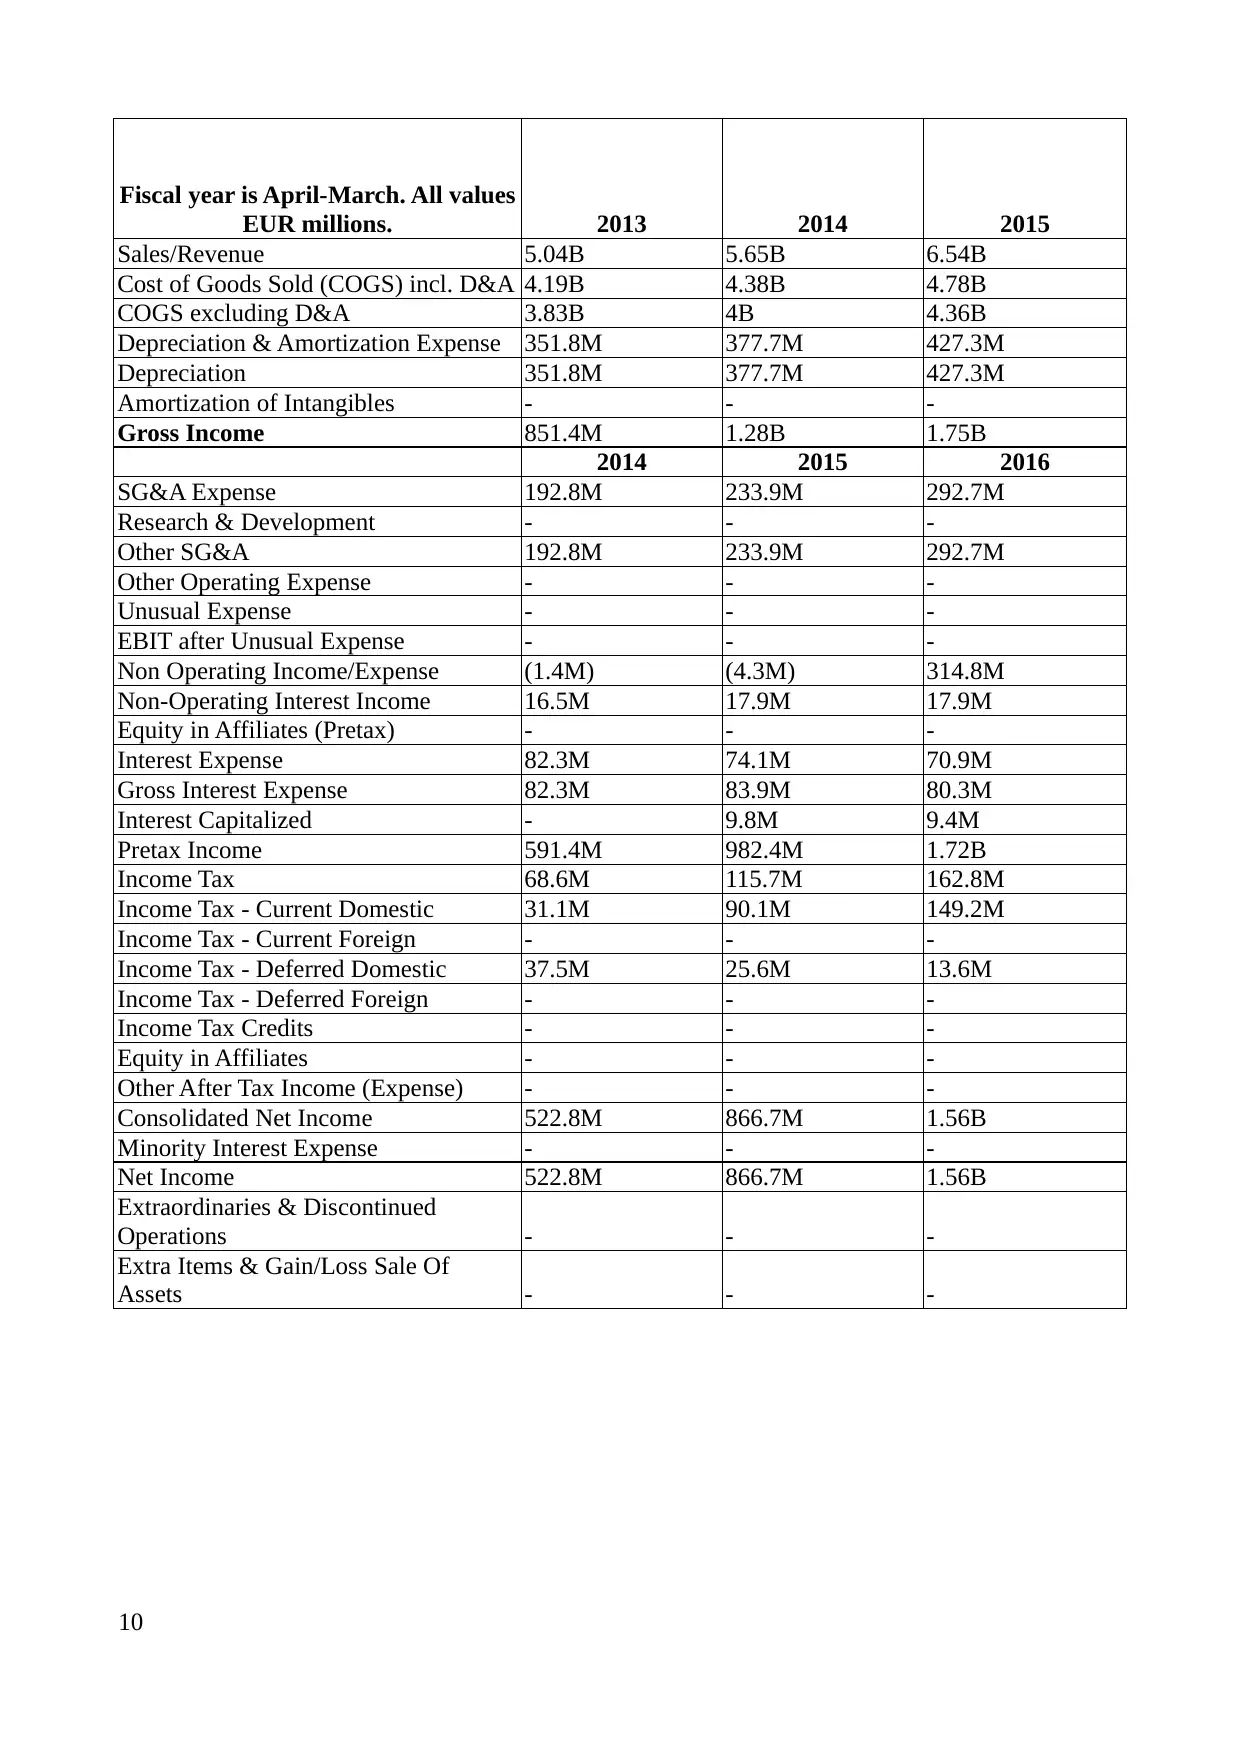
Fiscal year is April-March. All values
EUR millions. 2013 2014 2015
Sales/Revenue 5.04B 5.65B 6.54B
Cost of Goods Sold (COGS) incl. D&A 4.19B 4.38B 4.78B
COGS excluding D&A 3.83B 4B 4.36B
Depreciation & Amortization Expense 351.8M 377.7M 427.3M
Depreciation 351.8M 377.7M 427.3M
Amortization of Intangibles - - -
Gross Income 851.4M 1.28B 1.75B
2014 2015 2016
SG&A Expense 192.8M 233.9M 292.7M
Research & Development - - -
Other SG&A 192.8M 233.9M 292.7M
Other Operating Expense - - -
Unusual Expense - - -
EBIT after Unusual Expense - - -
Non Operating Income/Expense (1.4M) (4.3M) 314.8M
Non-Operating Interest Income 16.5M 17.9M 17.9M
Equity in Affiliates (Pretax) - - -
Interest Expense 82.3M 74.1M 70.9M
Gross Interest Expense 82.3M 83.9M 80.3M
Interest Capitalized - 9.8M 9.4M
Pretax Income 591.4M 982.4M 1.72B
Income Tax 68.6M 115.7M 162.8M
Income Tax - Current Domestic 31.1M 90.1M 149.2M
Income Tax - Current Foreign - - -
Income Tax - Deferred Domestic 37.5M 25.6M 13.6M
Income Tax - Deferred Foreign - - -
Income Tax Credits - - -
Equity in Affiliates - - -
Other After Tax Income (Expense) - - -
Consolidated Net Income 522.8M 866.7M 1.56B
Minority Interest Expense - - -
Net Income 522.8M 866.7M 1.56B
Extraordinaries & Discontinued
Operations - - -
Extra Items & Gain/Loss Sale Of
Assets - - -
10
Paraphrase This Document
Need a fresh take? Get an instant paraphrase of this document with our AI Paraphraser
Cumulative Effect - Accounting Chg - - -
Discontinued Operations - - -
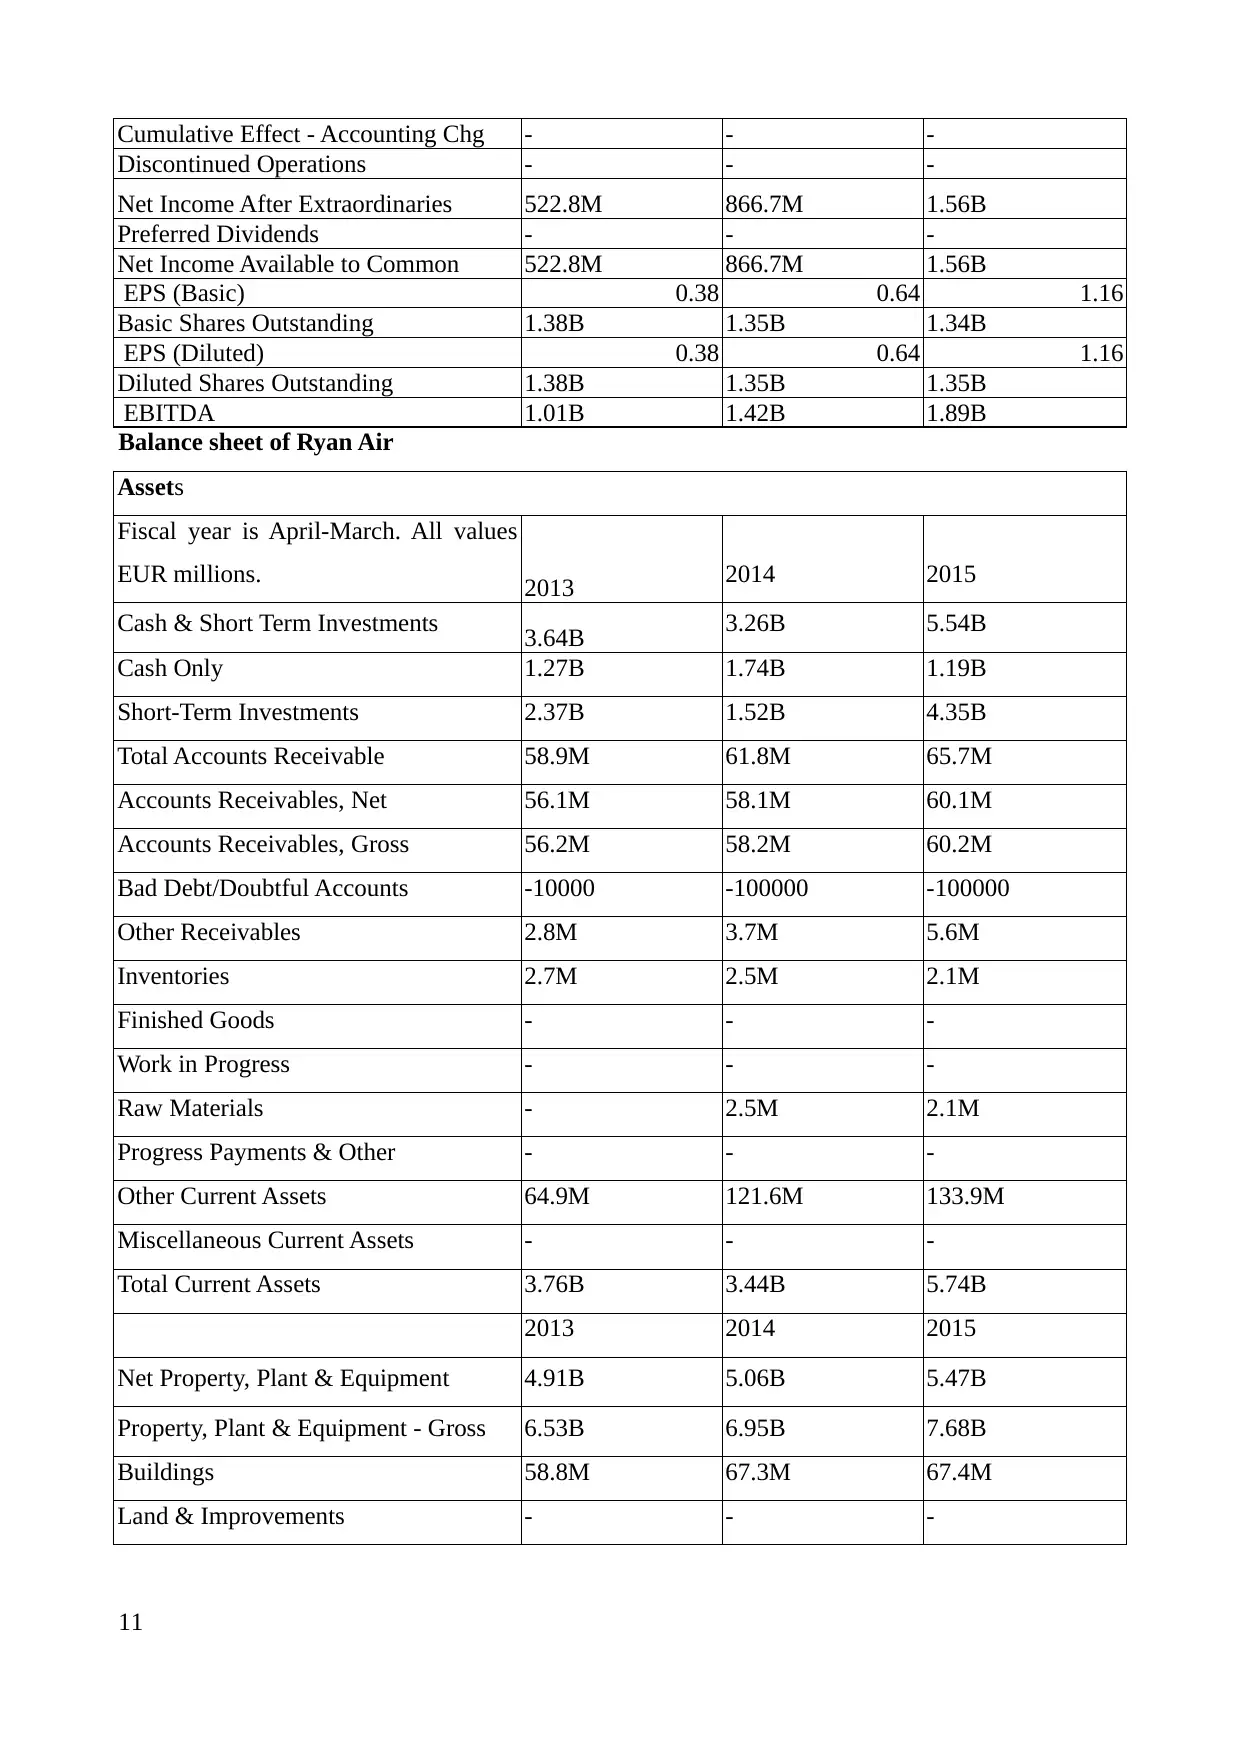
Net Income After Extraordinaries 522.8M 866.7M 1.56B
Preferred Dividends - - -
Net Income Available to Common 522.8M 866.7M 1.56B
EPS (Basic) 0.38 0.64 1.16
Basic Shares Outstanding 1.38B 1.35B 1.34B
EPS (Diluted) 0.38 0.64 1.16
Diluted Shares Outstanding 1.38B 1.35B 1.35B
EBITDA 1.01B 1.42B 1.89B
Balance sheet of Ryan Air
Assets
Fiscal year is April-March. All values
EUR millions. 2013 2014 2015
Cash & Short Term Investments 3.64B 3.26B 5.54B
Cash Only 1.27B 1.74B 1.19B
Short-Term Investments 2.37B 1.52B 4.35B
Total Accounts Receivable 58.9M 61.8M 65.7M
Accounts Receivables, Net 56.1M 58.1M 60.1M
Accounts Receivables, Gross 56.2M 58.2M 60.2M
Bad Debt/Doubtful Accounts -10000 -100000 -100000
Other Receivables 2.8M 3.7M 5.6M
Inventories 2.7M 2.5M 2.1M
Finished Goods - - -
Work in Progress - - -
Raw Materials - 2.5M 2.1M
Progress Payments & Other - - -
Other Current Assets 64.9M 121.6M 133.9M
Miscellaneous Current Assets - - -
Total Current Assets 3.76B 3.44B 5.74B
2013 2014 2015
Net Property, Plant & Equipment 4.91B 5.06B 5.47B
Property, Plant & Equipment - Gross 6.53B 6.95B 7.68B
Buildings 58.8M 67.3M 67.4M
Land & Improvements - - -
11
Discontinued Operations - - -
Net Income After Extraordinaries 522.8M 866.7M 1.56B
Preferred Dividends - - -
Net Income Available to Common 522.8M 866.7M 1.56B
EPS (Basic) 0.38 0.64 1.16
Basic Shares Outstanding 1.38B 1.35B 1.34B
EPS (Diluted) 0.38 0.64 1.16
Diluted Shares Outstanding 1.38B 1.35B 1.35B
EBITDA 1.01B 1.42B 1.89B
Balance sheet of Ryan Air
Assets
Fiscal year is April-March. All values
EUR millions. 2013 2014 2015
Cash & Short Term Investments 3.64B 3.26B 5.54B
Cash Only 1.27B 1.74B 1.19B
Short-Term Investments 2.37B 1.52B 4.35B
Total Accounts Receivable 58.9M 61.8M 65.7M
Accounts Receivables, Net 56.1M 58.1M 60.1M
Accounts Receivables, Gross 56.2M 58.2M 60.2M
Bad Debt/Doubtful Accounts -10000 -100000 -100000
Other Receivables 2.8M 3.7M 5.6M
Inventories 2.7M 2.5M 2.1M
Finished Goods - - -
Work in Progress - - -
Raw Materials - 2.5M 2.1M
Progress Payments & Other - - -
Other Current Assets 64.9M 121.6M 133.9M
Miscellaneous Current Assets - - -
Total Current Assets 3.76B 3.44B 5.74B
2013 2014 2015
Net Property, Plant & Equipment 4.91B 5.06B 5.47B
Property, Plant & Equipment - Gross 6.53B 6.95B 7.68B
Buildings 58.8M 67.3M 67.4M
Land & Improvements - - -
11
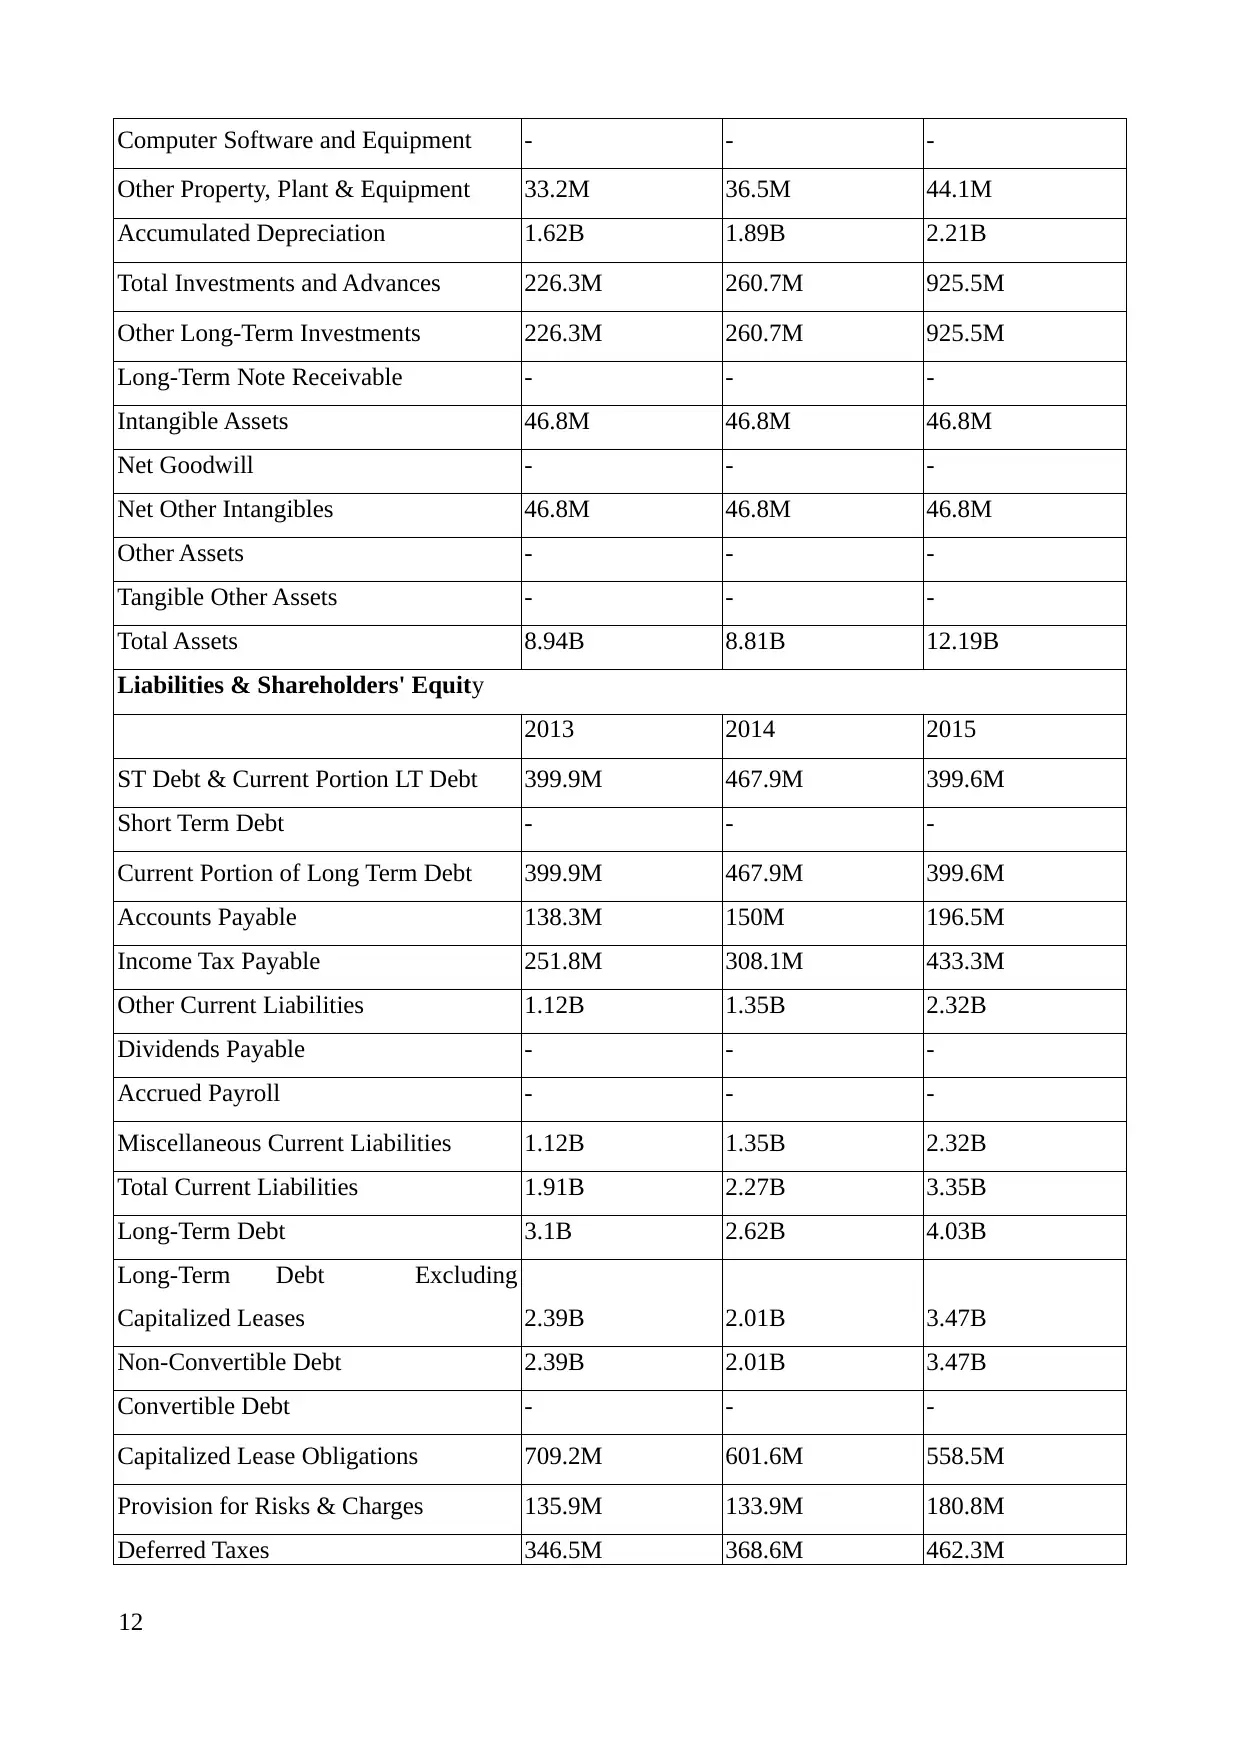
Computer Software and Equipment - - -
Other Property, Plant & Equipment 33.2M 36.5M 44.1M
Accumulated Depreciation 1.62B 1.89B 2.21B
Total Investments and Advances 226.3M 260.7M 925.5M
Other Long-Term Investments 226.3M 260.7M 925.5M
Long-Term Note Receivable - - -
Intangible Assets 46.8M 46.8M 46.8M
Net Goodwill - - -
Net Other Intangibles 46.8M 46.8M 46.8M
Other Assets - - -
Tangible Other Assets - - -
Total Assets 8.94B 8.81B 12.19B
Liabilities & Shareholders' Equity
2013 2014 2015
ST Debt & Current Portion LT Debt 399.9M 467.9M 399.6M
Short Term Debt - - -
Current Portion of Long Term Debt 399.9M 467.9M 399.6M
Accounts Payable 138.3M 150M 196.5M
Income Tax Payable 251.8M 308.1M 433.3M
Other Current Liabilities 1.12B 1.35B 2.32B
Dividends Payable - - -
Accrued Payroll - - -
Miscellaneous Current Liabilities 1.12B 1.35B 2.32B
Total Current Liabilities 1.91B 2.27B 3.35B
Long-Term Debt 3.1B 2.62B 4.03B
Long-Term Debt Excluding
Capitalized Leases 2.39B 2.01B 3.47B
Non-Convertible Debt 2.39B 2.01B 3.47B
Convertible Debt - - -
Capitalized Lease Obligations 709.2M 601.6M 558.5M
Provision for Risks & Charges 135.9M 133.9M 180.8M
Deferred Taxes 346.5M 368.6M 462.3M
12
⊘ This is a preview!⊘
Do you want full access?
Subscribe today to unlock all pages.
Trusted by 1+ million students worldwide
1 out of 17
Related Documents


Your All-in-One AI-Powered Toolkit for Academic Success.
+13062052269
info@desklib.com
Available 24*7 on WhatsApp / Email
![[object Object]](/_next/static/media/star-bottom.7253800d.svg)
Unlock your academic potential
Copyright © 2020–2026 A2Z Services. All Rights Reserved. Developed and managed by ZUCOL.