Analysis of Liquidity and Capital Structure for AGL Energy Limited
VerifiedAdded on 2022/08/19
|10
|2521
|6
Report
AI Summary
This report conducts a financial analysis of AGL Energy Limited, an Australian integrated energy company. It examines the company's financial performance through ratio analysis, focusing on liquidity and capital structure. The analysis includes the computation of working capital, revealing a deterioration in 2019 compared to 2018, potentially indicating increased risk. The cost of equity is calculated using the Gordon Growth Model, suggesting the company's shares may be overvalued. Liquidity ratios such as current, quick, and cash ratios are assessed, showing a shift in the company's cash management strategy. Gearing ratios, including debt-to-equity, equity ratio, and cash debt coverage, are also evaluated, providing insights into the company's financing decisions and financial stability. The report concludes that while financial figures are essential, their evaluation and comparison are crucial for meaningful insights, supporting stakeholder decision-making.

BUSINESS FINANCE
Paraphrase This Document
Need a fresh take? Get an instant paraphrase of this document with our AI Paraphraser
Contents
Introduction................................................................................................................................2
Description of the company and the business............................................................................2
Financial analysis.......................................................................................................................2
Analysis of the Net Working Capital position.......................................................................2
Analysis of the cost of capital of the company......................................................................3
Ratio analysis for the liquidity and the capital structure of the company..............................3
Conclusion..................................................................................................................................6
References..................................................................................................................................8
Introduction
The company AGL Energy Limited is a renowned Australian organisation engaged in the
integrated energy business. The business includes the various kinds of energy generation such
as thermal energy, natural gas, renewable energy sources like water and solar energy as well
as the storage of the same. In the complex business world of today, it is significant for the
managers to be aware of the various aspects of the business, and financial analysis is one
such means to evaluate the performance of a business. The following work is aimed at
evaluating the financial parameters of liquidity and capital structure of the company AGL
Energy Limited. The various techniques that would be employed for the said financial
evaluation is that of the ratio analysis, and the computations of the working capital and the
cost of equity.
Description of the company and the business
The company AGL Energy Limited was founded in the year 2006. The company is operating
in the Australia since 180 years and is known to be one of the first limited companies of the
country (AGL Energy Limited, 2020). The registered head office of the company is located at
Sydney, NSW. The organisation is popularly known as the only energy provider that
comprised of full suite of renewable energy production, and is engaged in the provision of the
energy to millions of Australians. In addition, the company has an active participation in the
wholesale markets of gas and electrical wholesale markets and is recognised to serve
numerous customer accounts to the tune of 3.7 million. The company was officially listed on
the Australian Stock Exchange on 12/10/2006 and the trading symbol of the company is
“AGK (Australian Stock Exchange, 2020).”
Financial analysis
The decision making of various stakeholders is dependent on the varied qualitative and
quantitative factors. The financial analysis of a business of a company aids in the
simplification of the financial data and enables easy comparison from the past year
performances as well as the industry benchmarks (Williams and Dobelman, 2017). The
financial analysis of the various key aspects of the business of the AGL Energy Limited is
conducted as follows.
⊘ This is a preview!⊘
Do you want full access?
Subscribe today to unlock all pages.
Trusted by 1+ million students worldwide
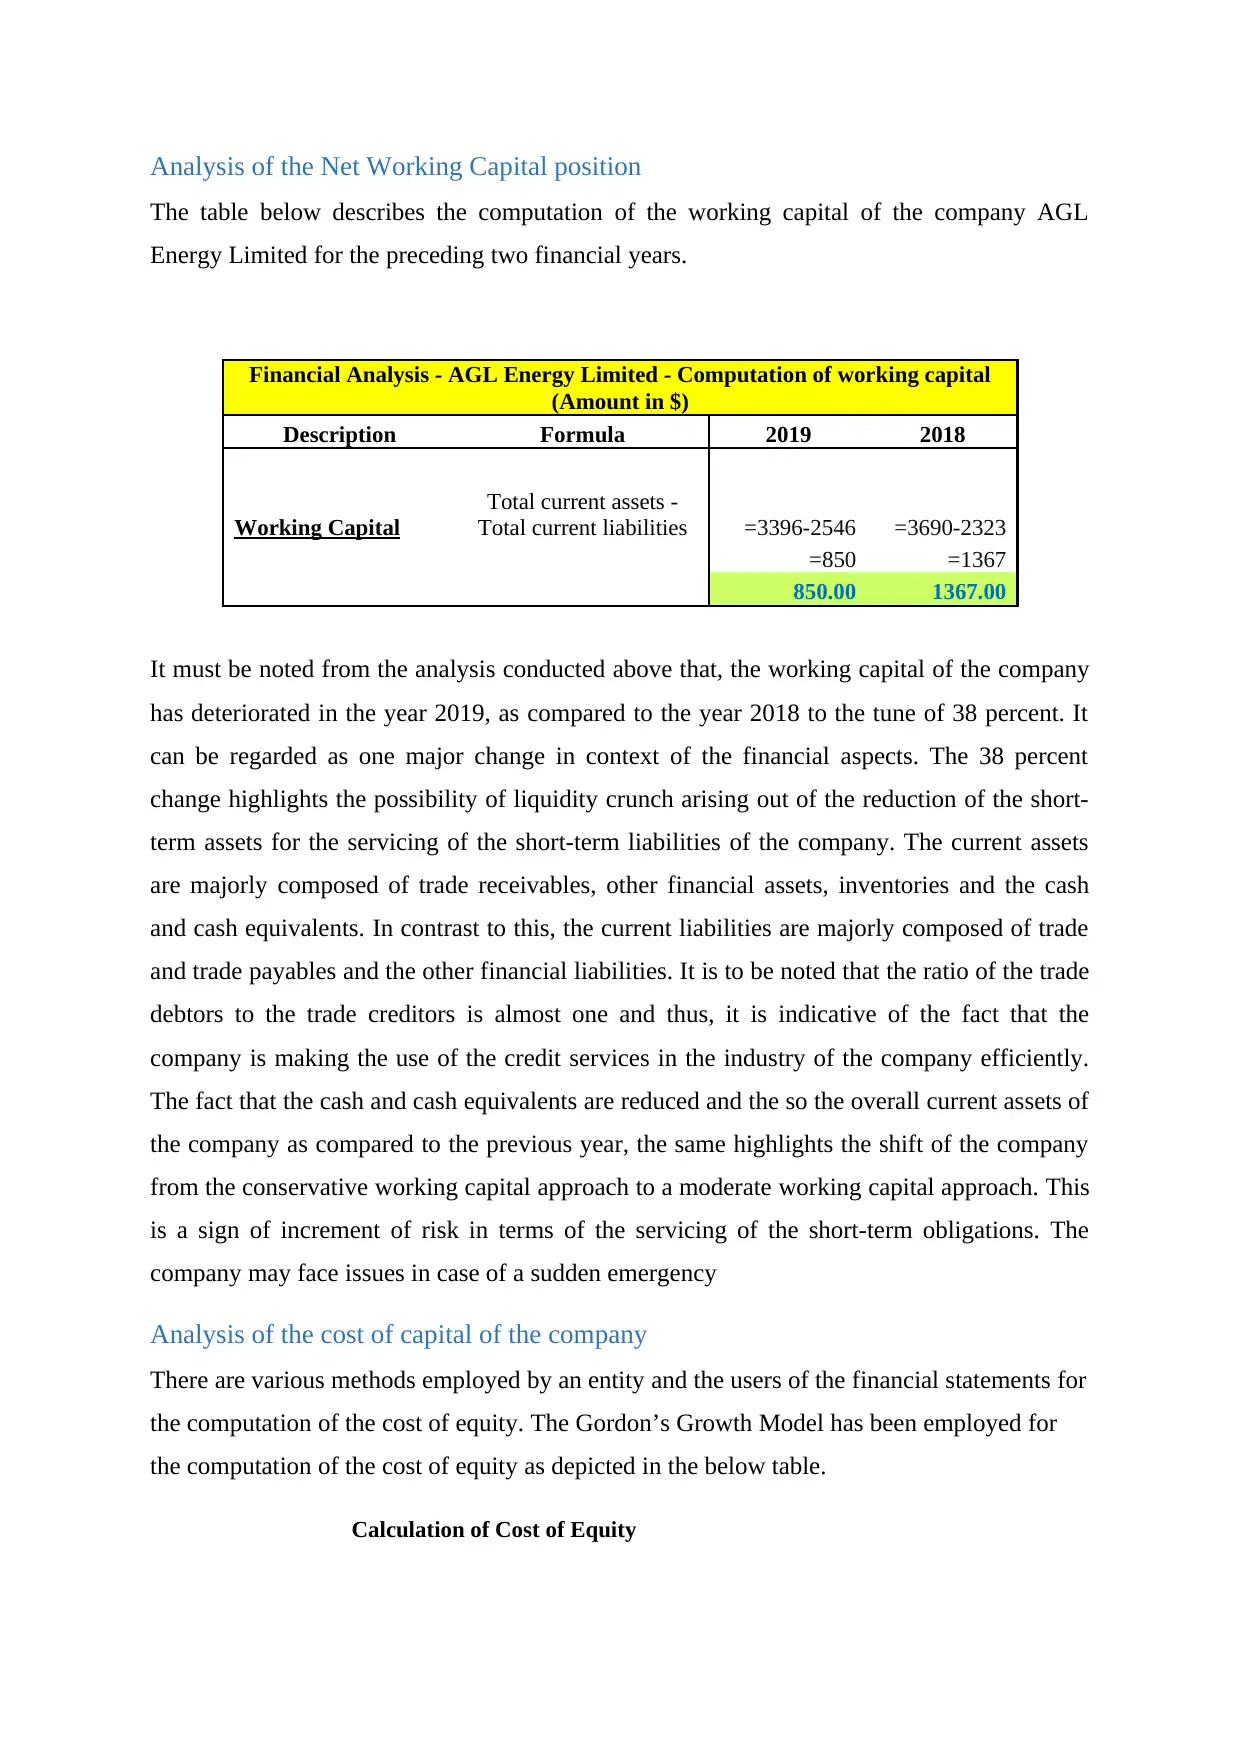
Analysis of the Net Working Capital position
The table below describes the computation of the working capital of the company AGL
Energy Limited for the preceding two financial years.
Financial Analysis - AGL Energy Limited - Computation of working capital
(Amount in $)
Description Formula 2019 2018
Working Capital
Total current assets -
Total current liabilities =3396-2546 =3690-2323
=850 =1367
850.00 1367.00
It must be noted from the analysis conducted above that, the working capital of the company
has deteriorated in the year 2019, as compared to the year 2018 to the tune of 38 percent. It
can be regarded as one major change in context of the financial aspects. The 38 percent
change highlights the possibility of liquidity crunch arising out of the reduction of the short-
term assets for the servicing of the short-term liabilities of the company. The current assets
are majorly composed of trade receivables, other financial assets, inventories and the cash
and cash equivalents. In contrast to this, the current liabilities are majorly composed of trade
and trade payables and the other financial liabilities. It is to be noted that the ratio of the trade
debtors to the trade creditors is almost one and thus, it is indicative of the fact that the
company is making the use of the credit services in the industry of the company efficiently.
The fact that the cash and cash equivalents are reduced and the so the overall current assets of
the company as compared to the previous year, the same highlights the shift of the company
from the conservative working capital approach to a moderate working capital approach. This
is a sign of increment of risk in terms of the servicing of the short-term obligations. The
company may face issues in case of a sudden emergency
Analysis of the cost of capital of the company
There are various methods employed by an entity and the users of the financial statements for
the computation of the cost of equity. The Gordon’s Growth Model has been employed for
the computation of the cost of equity as depicted in the below table.
Calculation of Cost of Equity
Paraphrase This Document
Need a fresh take? Get an instant paraphrase of this document with our AI Paraphraser
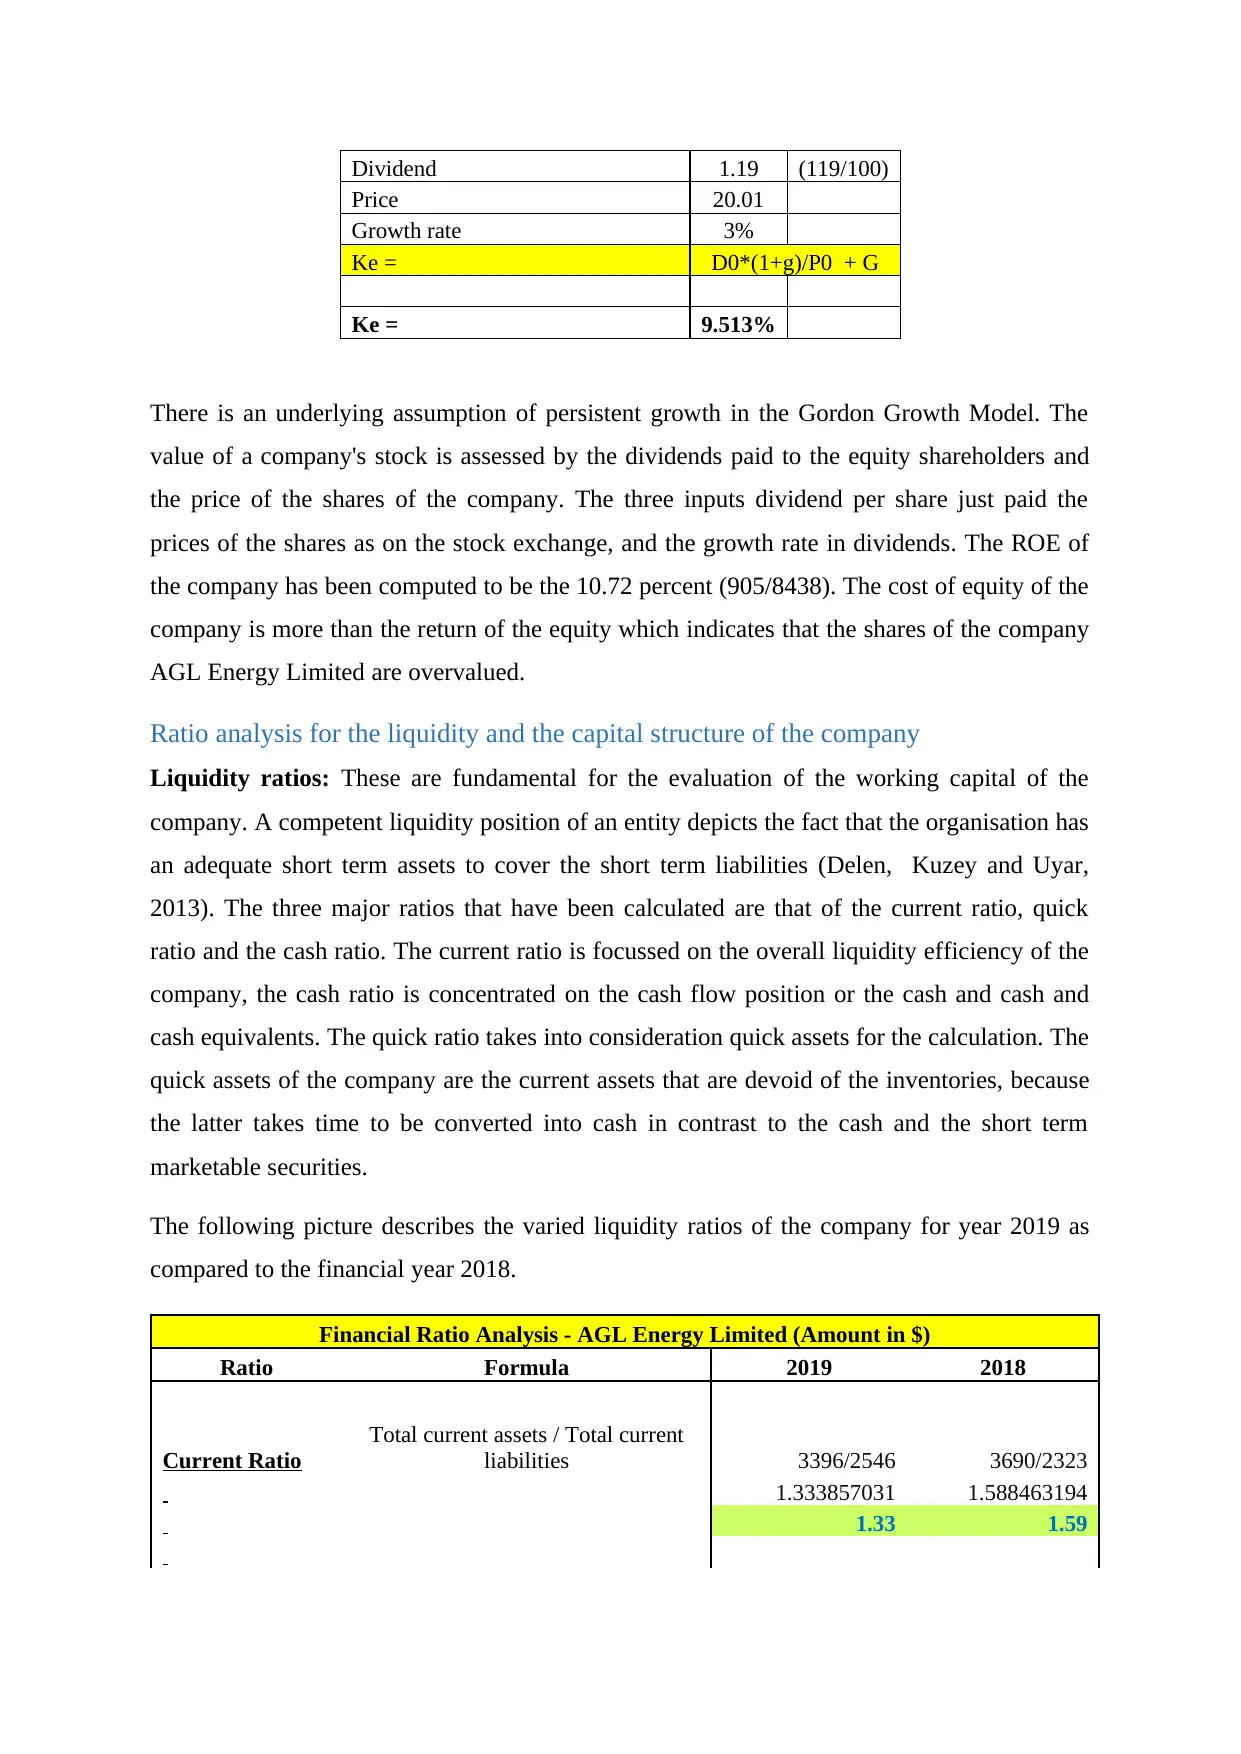
Dividend 1.19 (119/100)
Price 20.01
Growth rate 3%
Ke = D0*(1+g)/P0 + G
Ke = 9.513%
There is an underlying assumption of persistent growth in the Gordon Growth Model. The
value of a company's stock is assessed by the dividends paid to the equity shareholders and
the price of the shares of the company. The three inputs dividend per share just paid the
prices of the shares as on the stock exchange, and the growth rate in dividends. The ROE of
the company has been computed to be the 10.72 percent (905/8438). The cost of equity of the
company is more than the return of the equity which indicates that the shares of the company
AGL Energy Limited are overvalued.
Ratio analysis for the liquidity and the capital structure of the company
Liquidity ratios: These are fundamental for the evaluation of the working capital of the
company. A competent liquidity position of an entity depicts the fact that the organisation has
an adequate short term assets to cover the short term liabilities (Delen, Kuzey and Uyar,
2013). The three major ratios that have been calculated are that of the current ratio, quick
ratio and the cash ratio. The current ratio is focussed on the overall liquidity efficiency of the
company, the cash ratio is concentrated on the cash flow position or the cash and cash and
cash equivalents. The quick ratio takes into consideration quick assets for the calculation. The
quick assets of the company are the current assets that are devoid of the inventories, because
the latter takes time to be converted into cash in contrast to the cash and the short term
marketable securities.
The following picture describes the varied liquidity ratios of the company for year 2019 as
compared to the financial year 2018.
Financial Ratio Analysis - AGL Energy Limited (Amount in $)
Ratio Formula 2019 2018
Current Ratio
Total current assets / Total current
liabilities 3396/2546 3690/2323
1.333857031 1.588463194
1.33 1.59
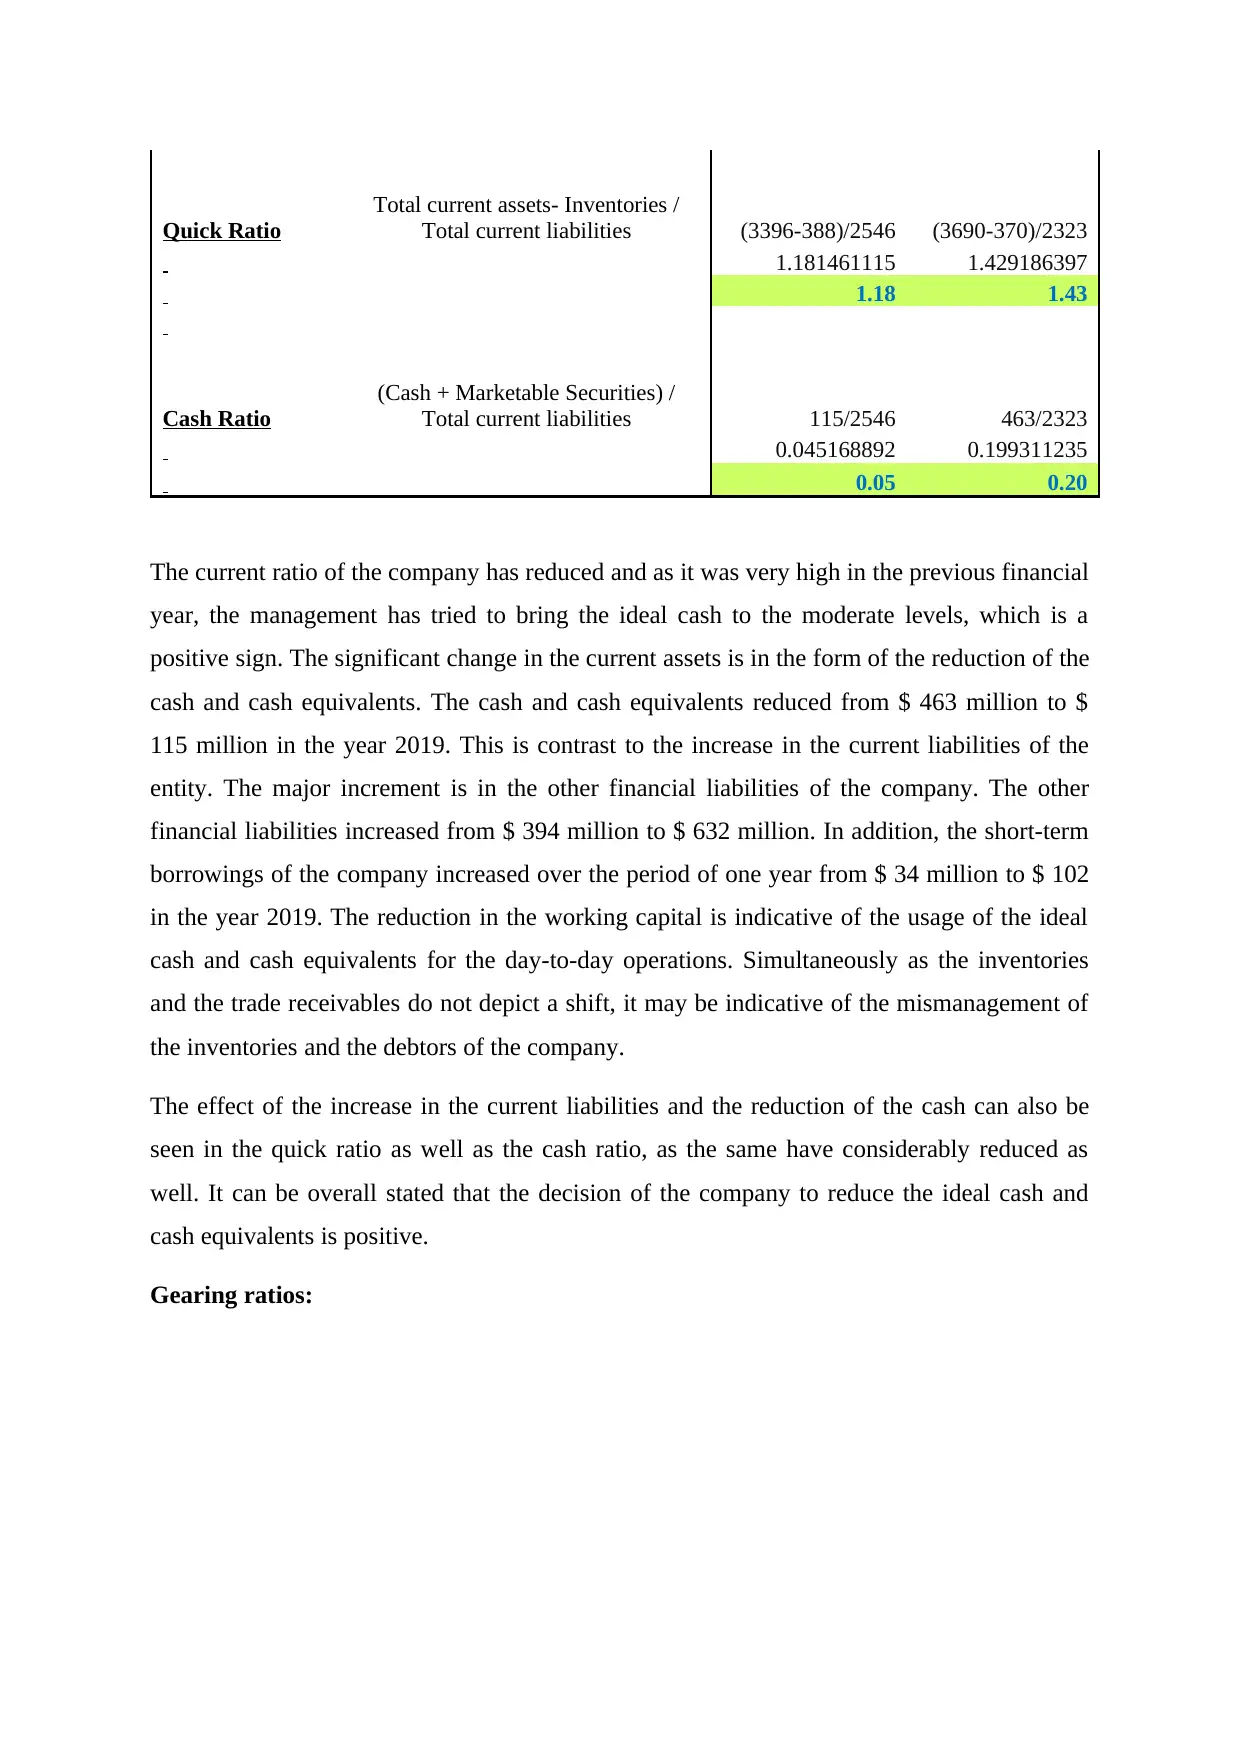
Quick Ratio
Total current assets- Inventories /
Total current liabilities (3396-388)/2546 (3690-370)/2323
1.181461115 1.429186397
1.18 1.43
Cash Ratio
(Cash + Marketable Securities) /
Total current liabilities 115/2546 463/2323
0.045168892 0.199311235
0.05 0.20
The current ratio of the company has reduced and as it was very high in the previous financial
year, the management has tried to bring the ideal cash to the moderate levels, which is a
positive sign. The significant change in the current assets is in the form of the reduction of the
cash and cash equivalents. The cash and cash equivalents reduced from $ 463 million to $
115 million in the year 2019. This is contrast to the increase in the current liabilities of the
entity. The major increment is in the other financial liabilities of the company. The other
financial liabilities increased from $ 394 million to $ 632 million. In addition, the short-term
borrowings of the company increased over the period of one year from $ 34 million to $ 102
in the year 2019. The reduction in the working capital is indicative of the usage of the ideal
cash and cash equivalents for the day-to-day operations. Simultaneously as the inventories
and the trade receivables do not depict a shift, it may be indicative of the mismanagement of
the inventories and the debtors of the company.
The effect of the increase in the current liabilities and the reduction of the cash can also be
seen in the quick ratio as well as the cash ratio, as the same have considerably reduced as
well. It can be overall stated that the decision of the company to reduce the ideal cash and
cash equivalents is positive.
Gearing ratios:
⊘ This is a preview!⊘
Do you want full access?
Subscribe today to unlock all pages.
Trusted by 1+ million students worldwide
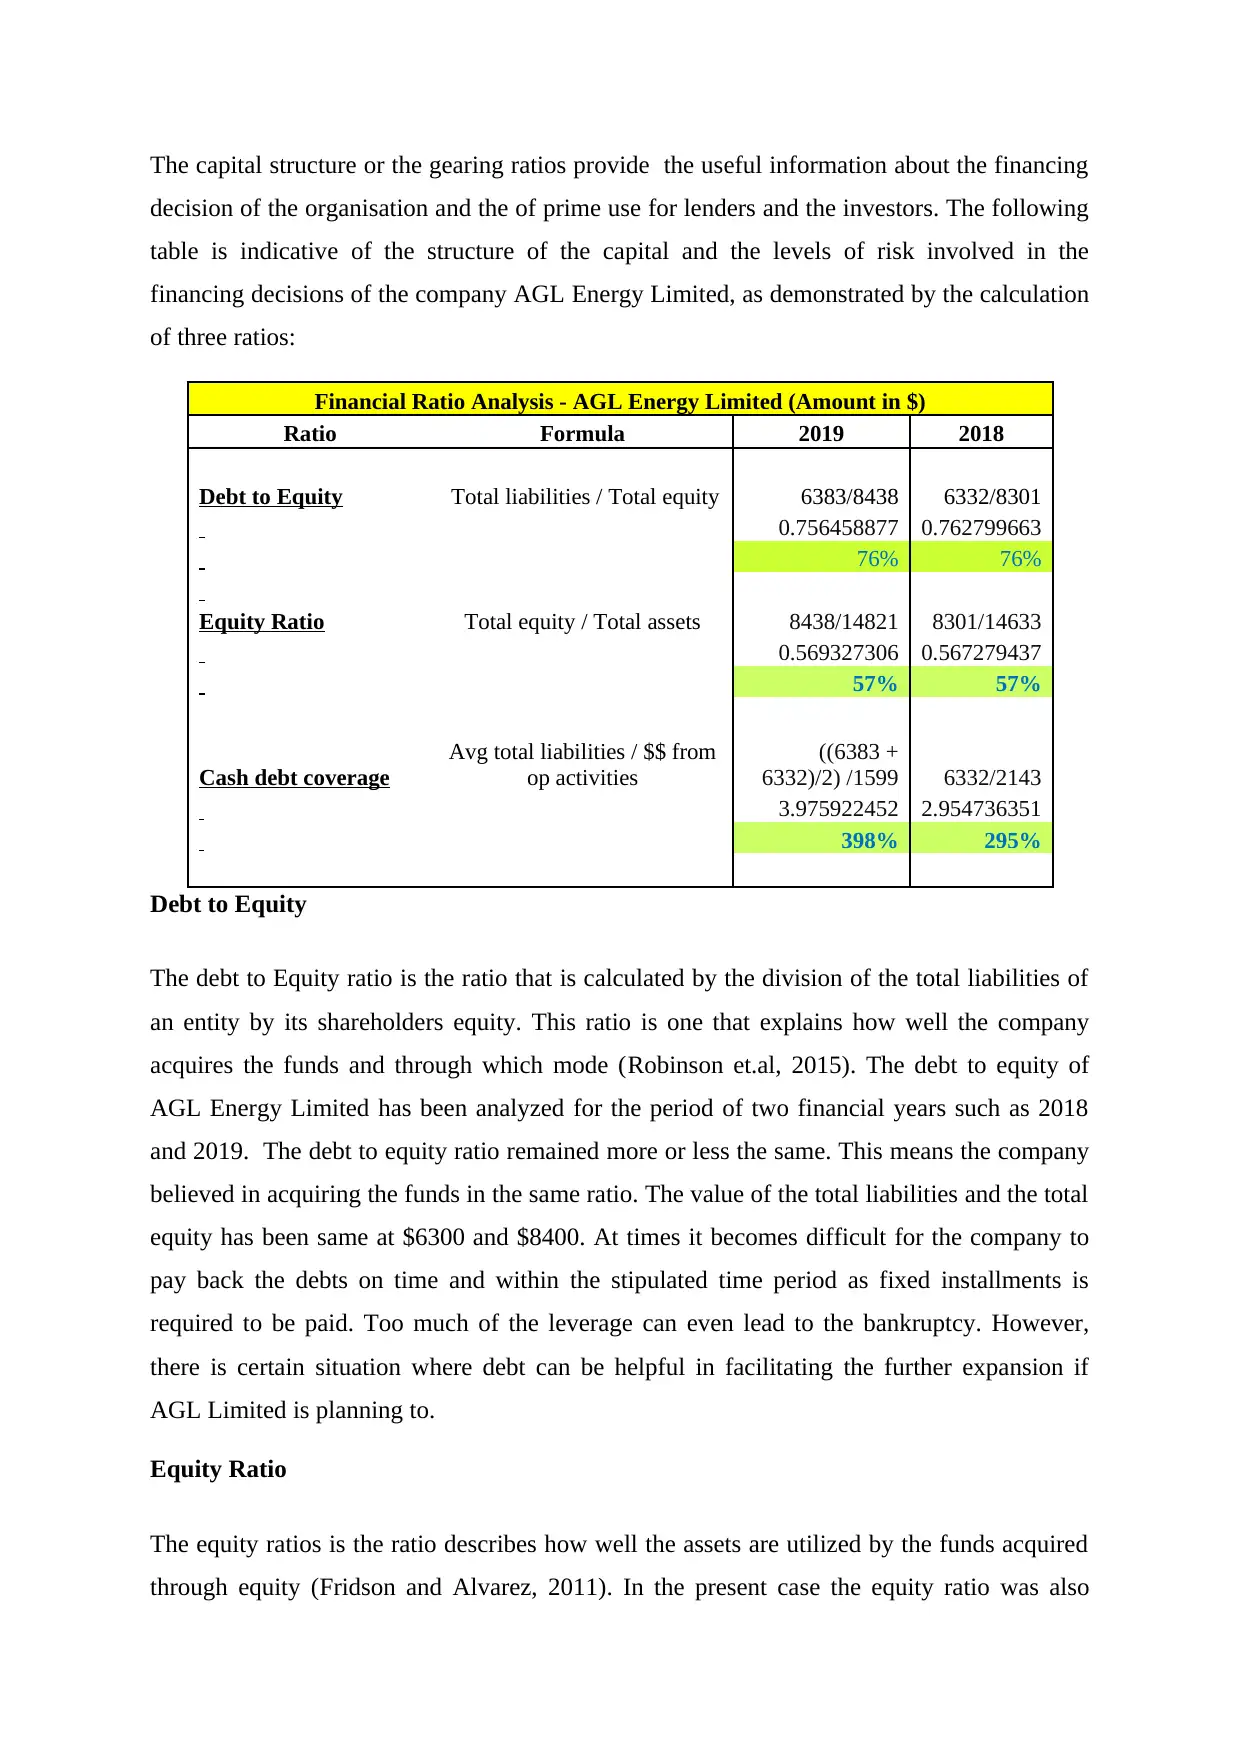
The capital structure or the gearing ratios provide the useful information about the financing
decision of the organisation and the of prime use for lenders and the investors. The following
table is indicative of the structure of the capital and the levels of risk involved in the
financing decisions of the company AGL Energy Limited, as demonstrated by the calculation
of three ratios:
Debt to Equity
The debt to Equity ratio is the ratio that is calculated by the division of the total liabilities of
an entity by its shareholders equity. This ratio is one that explains how well the company
acquires the funds and through which mode (Robinson et.al, 2015). The debt to equity of
AGL Energy Limited has been analyzed for the period of two financial years such as 2018
and 2019. The debt to equity ratio remained more or less the same. This means the company
believed in acquiring the funds in the same ratio. The value of the total liabilities and the total
equity has been same at $6300 and $8400. At times it becomes difficult for the company to
pay back the debts on time and within the stipulated time period as fixed installments is
required to be paid. Too much of the leverage can even lead to the bankruptcy. However,
there is certain situation where debt can be helpful in facilitating the further expansion if
AGL Limited is planning to.
Equity Ratio
The equity ratios is the ratio describes how well the assets are utilized by the funds acquired
through equity (Fridson and Alvarez, 2011). In the present case the equity ratio was also
Financial Ratio Analysis - AGL Energy Limited (Amount in $)
Ratio Formula 2019 2018
Debt to Equity Total liabilities / Total equity 6383/8438 6332/8301
0.756458877 0.762799663
76% 76%
Equity Ratio Total equity / Total assets 8438/14821 8301/14633
0.569327306 0.567279437
57% 57%
Cash debt coverage
Avg total liabilities / $$ from
op activities
((6383 +
6332)/2) /1599 6332/2143
3.975922452 2.954736351
398% 295%
Paraphrase This Document
Need a fresh take? Get an instant paraphrase of this document with our AI Paraphraser
consistent at 57%. This implies that the lower the ratio is in terms of the result the more the
debt is used to pay for purchasing the assets. Around 57% of the assets are being acquired
through equity mode and this indicates that if in future the business liquidates all the
properties will be given to the shareholders. When the company’s ratios are found below 50%
it is termed as the leveraged firm and since AGL limited is having 57%, the firm is strong
enough to carry out the operations of the firm.
Cash debt Coverage Ratio
This ratio is one of the most important ratios as it describes how much liabilities are covered
by the cash. The cash debt coverage ratio of 1 is generally considered to be good indicator of
the stability of the company. A company’s overall financial strength is additionally reflected
by the said ratio. Additionally the soundness of the capital structure is assessed. From the
point of view of the creditors, suppliers and the investors the higher the ratio, the more
feasible it is. As per the current scenario, the AGL limited, the ratio increased from 295% to
395% hence, this implies that the ratio is good as the company is focusing on settling more
liabilities and at a faster pace. Since there is no problem with regards to the stability of the
financial problem and hence, the cash debt coverage ratio is smooth and sound.
Conclusion
The conclusions that is reached as per the discussions conducted in the above segments that
the financial figures are the chief source of information about the working of a company,
however the same need to evaluated and compared to get the useful insights out of the same .
The decision making of the stakeholders is aided by the evaluation of the ratios and the
examination of the elements therein.
The various liquidity and the gearing ratios are computed of the company AGL Energy
Limited. It has been assessed that the company’s management has strategized to optimise the
use of the cash and cash equivalents. The overall liquidity position has been assessed to be
moderate and the huge cash balances have been reduced. In contrast to this, the gearing ratios
are demonstrative of stability except those impacted by the cash. Further, the cost of equity of
the company has been computed for the company using the Gordon’s Growth Model. Thus,
an overall glimpse of the financial analysis indicate an overall stable business operations of
the company.

⊘ This is a preview!⊘
Do you want full access?
Subscribe today to unlock all pages.
Trusted by 1+ million students worldwide
References
AGL Energy Limited (2020) Who we are [online] Available from:
https://www.agl.com.au/about-agl/who-we-are [Accessed on: 01 February 2020].
Australian Stock Exchange (2020) AGL ENERGY LIMITED. Details [online] Available from:
https://www.asx.com.au/asx/share-price-research/company/AGL/details [Accessed on: 01
February 2020].
Delen, D., Kuzey, C., and Uyar, A. (2013) Measuring firm performance using financial
ratios: A decision tree approach. Expert Systems with Applications, 40(10), pp. 3970-3983.
Edmonds, T. P. (2013) Fundamental financial accounting concepts. UK: McGraw-Hill.
Fridson, M. S., and Alvarez, F. (2011) Financial statement analysis: a practitioner's guide
Vol. 597. UK: John Wiley & Sons.
Robinson, T. R., Henry, E., Pirie, W. L., and Broihahn, M. A. (2015) International financial
statement analysis. UK: John Wiley & Sons.
Williams, E. E., and Dobelman, J. A. (2017) Financial statement analysis. World Scientific
Book Chapters, pp. 109-169.
1 out of 10
Related Documents


Your All-in-One AI-Powered Toolkit for Academic Success.
+13062052269
info@desklib.com
Available 24*7 on WhatsApp / Email
![[object Object]](/_next/static/media/star-bottom.7253800d.svg)
Unlock your academic potential
Copyright © 2020–2026 A2Z Services. All Rights Reserved. Developed and managed by ZUCOL.