Financial Performance Comparison: Wyndham Hotel vs Hilton Hotel Report
VerifiedAdded on 2022/10/18
|14
|3544
|5
Report
AI Summary
This report provides a comprehensive financial analysis of Wyndham and Hilton Hotels, comparing their performance across various financial metrics. The analysis begins with an introduction to financial performance evaluation techniques and provides background information on both hotel chains. Ratio analysis is the core of the report, examining profitability (operating margin, net margin, return on assets), liquidity (current ratio, quick ratio), solvency (debt-to-equity ratio, times interest coverage ratio), and efficiency (accounts payable turnover, accounts receivable turnover). The report compares the financial health of the two companies based on these ratios, highlighting strengths and weaknesses. The report concludes with recommendations regarding investment potential based on the financial data and performance comparisons. The findings indicate Hilton's stronger profitability and solvency, while Wyndham shows strengths in liquidity. The report provides detailed insights into the financial management practices of the two major players in the hospitality industry.
Running Head: Financial management in Tourism 1
Financial management in Tourism
Financial management in Tourism
Paraphrase This Document
Need a fresh take? Get an instant paraphrase of this document with our AI Paraphraser
Financial management in Tourism 2
Table of Contents
Introduction...........................................................................................................................................3
Hotel Background..................................................................................................................................3
Ratio Analysis.......................................................................................................................................3
Profitability........................................................................................................................................4
Liquidity............................................................................................................................................5
Solvency............................................................................................................................................6
Efficiency..........................................................................................................................................7
Market Value Ratios..........................................................................................................................8
Recommendation on buying and selling................................................................................................9
Conclusion...........................................................................................................................................10
References...........................................................................................................................................11
Appendix 1...........................................................................................................................................13
Financial management in Tourism 3
Introduction
Financial performance of an enterprise can be calculated with the help of the different
techniques. The overall comparison is also necessary to find out the position of the company
with respect to the previous year and at the same time against the performance of the
competitor. In this report a detailed analysis of the Wyndham Hotel as well as the Hilton
Hotel is carried out. The financial analysis of this hotel includes the ratio analysis and the
interpretation, the relevance of the future cash flows which have been forecasted and the
overall recommendation on which hotel is performing better from the point of the view of the
investors (Revelli & Viviani, 2015).
Hotel Background
Hilton Worldwide Holdings Inc which was formerly known as the Hilton Hotel
Corporations is an American based Multinational Hospitality Company which is engaged in
the business of the hotel and the resorts. The name was found in the year 1919 by the Conrad
Hilton, as the hotel runs on his name. The headquarters of the hotel are situated in Virginia.
From the record of the September 2018, the portfolio of the hotel in inclusive of 5500
properties and over 894000 rooms which accumulates to total 109 countries and territories.
Hiltons are bifurcated according to the needs such as full operating service hotel, Focused
service providers, All suites, Lifestyle, Timeshare and much more (Hilton Holdings, 2018).
On the other hand the Wyndham Group is also one of the chain which is based in the
United States engaged in the same business of the hotel and the resorts chain. It is located
over 9000 locations with 4800 properties in the portfolio, thereby covering the 75 countries at
present. The founder of the Wyndham Group was Trammell Crow and this hotel came long
after the Hilton in the year 1981, a roundabout 38 years ago. This hotel promotes the lodging,
franchising, rental vacation facilities, vacation ownership and exchange (Wyndham Group,
2018).
Ratio Analysis
Ratio analysis is one of the measurements that is used by the tourism and the
hospitality sector to find out the range at which the hotels are currently operating in terms of
the competitors against the different parameters. These parameters can be bifurcated on the
basis of the profitability, solvency, liquidity, investment opportunities and the overall
⊘ This is a preview!⊘
Do you want full access?
Subscribe today to unlock all pages.
Trusted by 1+ million students worldwide
Financial management in Tourism 4
efficiency of the organizations. In this section the neck to neck analysis of the Hilton as well
and Wyndham group have been undertaken in order to understand which project is more
beneficial from the point of view of the investment considering the other factors as well.
Further the discussion has also been carried with regards to each ratio individual to have an
in-depth knowledge of each area (Amendola, Restaino & Sensini, 2015).
Profitability
Profitability is one of the major metrics that can be used to gauge the presentation of
the business. The five noteworthy proportions of that can portray the productivity of the
business is Return on absolute resources, Return on Equity, Operating Profit Margin, Net
Profit Margin and Gross Profit margin. The purpose of the calculation of the profitability
ratios is to understand the numbers and how much beneficial thy can be for the investors as
profitability is one of the major concerns of theirs. These categories have been analysed for
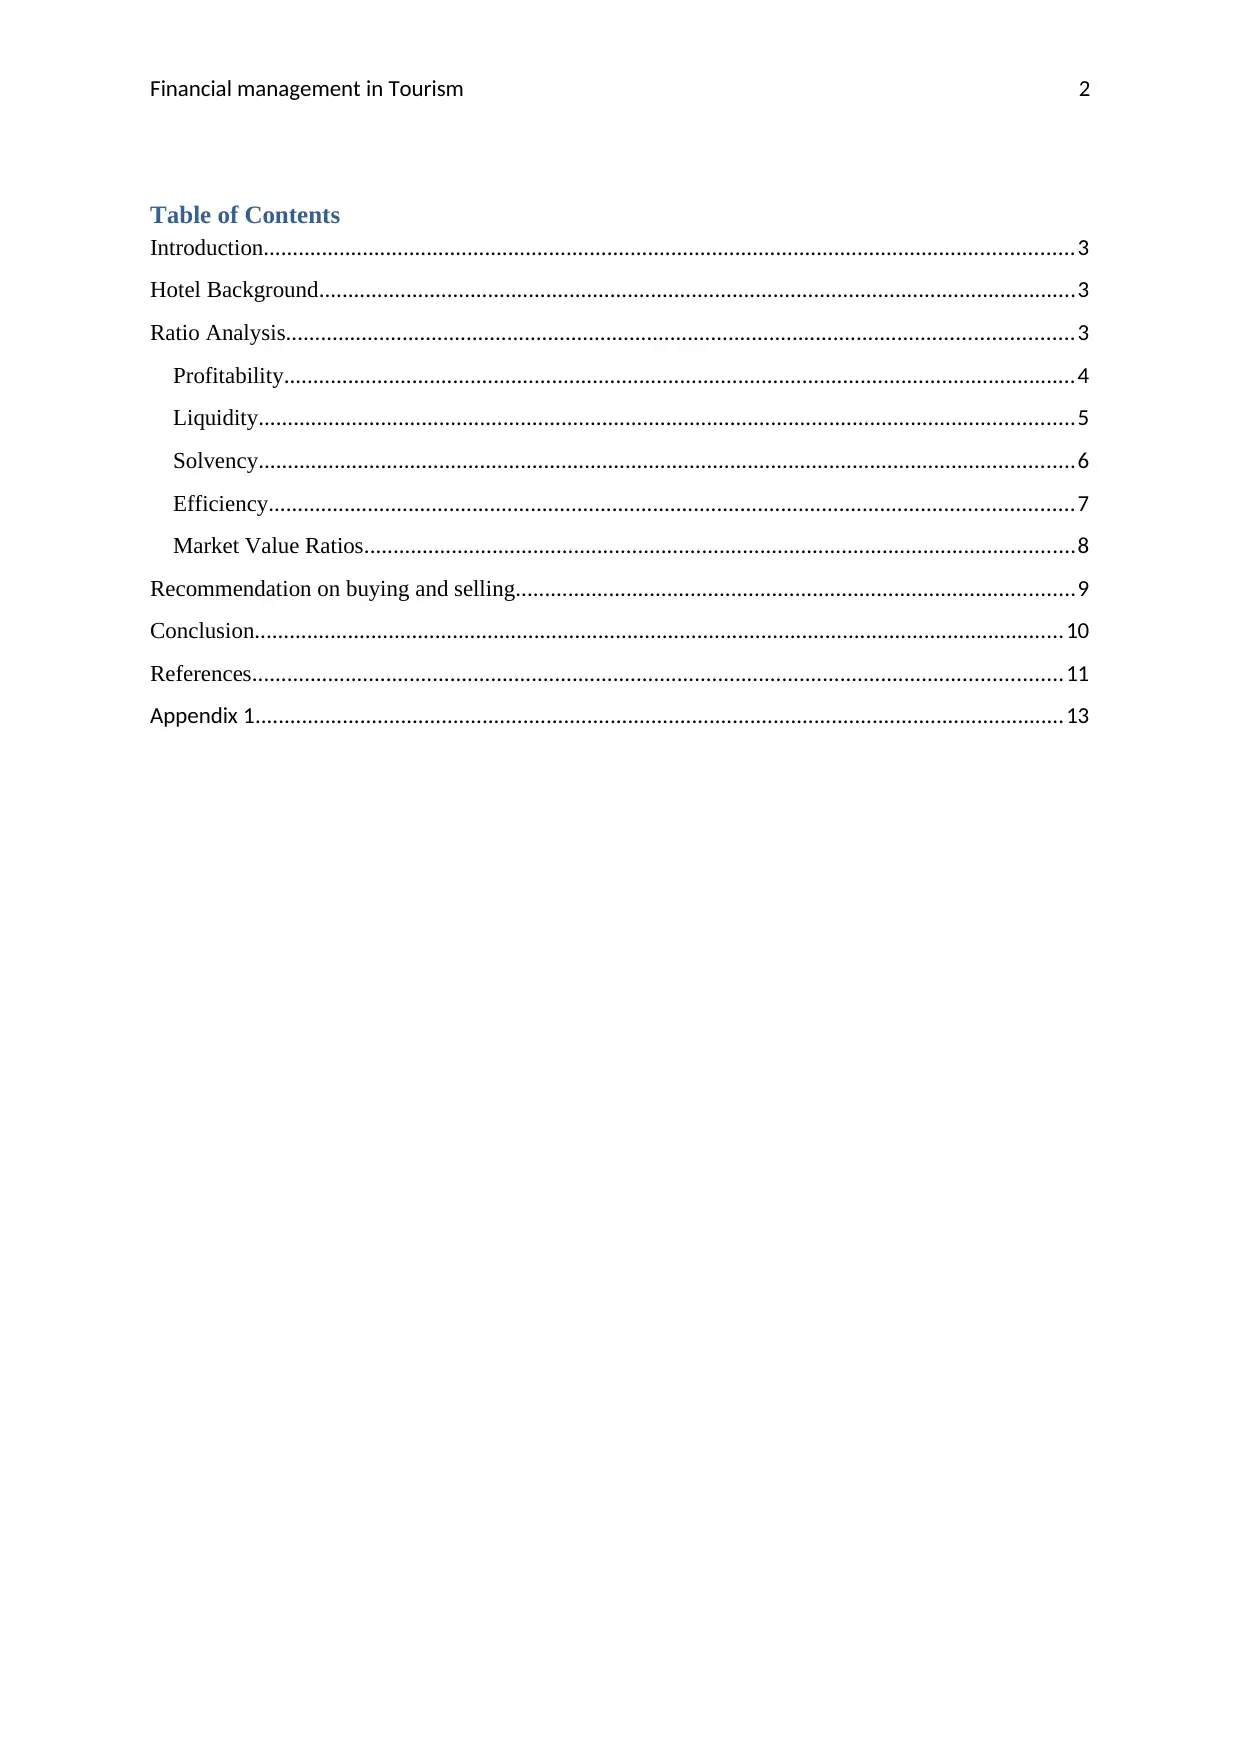
the Hilton and Wyndham group below (Arif, Noor-E-Jannat & Anwar, 2016).
Profitability Hilton
Wyndha
m
operating margin
operating
income 1441000 396000 39.3% 30.9%
total revenue 3668000 1282000
Net margin Net income 769000 162000 21.0% 12.6%
total revenue 3668000 1282000
return on net asset Net income 769000 162000 45.7% 39.0%
(fixed asset +net
working
capital ) 1682000 415000
From the table above the net profit margin of the Hilton is 21% and that of the
Wyndham is 12.6%. The net profit margin indicates the proportion with respect to the sales
and this is due to the increase in the sales from the previous year. Moreover the other
operating expenses have also decreased from $228000 to $136000; this gave a jump in the
net margin of the Hilton hotel (Hilton Holdings, 2018). In case of the Wyndham the net profit
efficiency of the organizations. In this section the neck to neck analysis of the Hilton as well
and Wyndham group have been undertaken in order to understand which project is more
beneficial from the point of view of the investment considering the other factors as well.
Further the discussion has also been carried with regards to each ratio individual to have an
in-depth knowledge of each area (Amendola, Restaino & Sensini, 2015).
Profitability
Profitability is one of the major metrics that can be used to gauge the presentation of
the business. The five noteworthy proportions of that can portray the productivity of the
business is Return on absolute resources, Return on Equity, Operating Profit Margin, Net
Profit Margin and Gross Profit margin. The purpose of the calculation of the profitability
ratios is to understand the numbers and how much beneficial thy can be for the investors as
profitability is one of the major concerns of theirs. These categories have been analysed for
the Hilton and Wyndham group below (Arif, Noor-E-Jannat & Anwar, 2016).
Profitability Hilton
Wyndha
m
operating margin
operating
income 1441000 396000 39.3% 30.9%
total revenue 3668000 1282000
Net margin Net income 769000 162000 21.0% 12.6%
total revenue 3668000 1282000
return on net asset Net income 769000 162000 45.7% 39.0%
(fixed asset +net
working
capital ) 1682000 415000
From the table above the net profit margin of the Hilton is 21% and that of the
Wyndham is 12.6%. The net profit margin indicates the proportion with respect to the sales
and this is due to the increase in the sales from the previous year. Moreover the other
operating expenses have also decreased from $228000 to $136000; this gave a jump in the
net margin of the Hilton hotel (Hilton Holdings, 2018). In case of the Wyndham the net profit
Paraphrase This Document
Need a fresh take? Get an instant paraphrase of this document with our AI Paraphraser
Financial management in Tourism 5
margin has been lowered as the sales are increasing at the lower pace and the operating
expense are accelerating form $719000 to $886000. The situation for the company is trouble
some and needs immediate action from the side of the management (Wyndham Group, 2018).
The operating margin will indicate the raw profits and this being one of the most
crucial as it determines the profit which are not inclusive of the tax or the interest expense.
The results show that the operating margin is higher in case of the Hilton at 39.3% and that of
the Wyndham Group is 30.9%. The WG group can improve the ratio by reducing the cost of
the sales and the creating more opportunities through diversification of the services
(Wyndham Group, 2018).
The return on asset will determine how well the company is able to earn with the help
of the assets. These assets help grow the business and therefore from the results it can be
interpreted that the position of the Hilton has been strong due to the stupendous combination
of the current assets as well as the liabilities. The strong working capital of $1315000 is what
keeps the return on assets ratio at 45.7% in case of the Hilton and the Wyndham on the other
hand are still struggling at 39%. The WG group can improve by getting rid of the obsolete
assets and renewing the working capital. From the overall analysis it can be concluded that
the profitability position of the Hilton is smooth and sound and that of the Wyndham still
needs some improvement (Gémar, Moniche & Morales, 2016).
Liquidity
The liquidity proportions of the organization decide the capacity of the organization to
satisfy the commitments with the assistance of the benefits of the organization. The liquidity
proportion incorporates the present proportion, brisk proportion, obligation to resources and
intrigue inclusion proportion. The liquidity ratios of the company are such kind of the metrics
that are required to judge the capacity of how well the company is able to realize the cash
from the debtors or by selling up of the inventory as this would result in the settling of the
liabilities as soon as possible. The faster settlement of the liability is the key to the future
growth of the business and which hotel has the better capacity can be analysed from the
current as well as the quick ratio (Grant, 2016).
The current ratio of the Hilton is 2.97 which are beyond the ideal target and the
current ratio of the Wyndham is 2.82. This clearly indicates that the company needs to bring
up the current ratio as the capacity to deal with the liability is clearly justified from the view
of the Hilton. In order to be in the competition the Wyndham group must focus on the long
Financial management in Tourism 6
term liabilities rather than the short term liabilities (Lado-Sestayo, Vivel-Búa & Otero-
González, 2016). It can be observed form the balance sheet that the Hilton hotel has reduced
the current short term liabilities from $46000 to $16000 which is quite commendable whereas
in case of the Wyndham, they also decreased the current liabilities from $103000 to $21000,
but the situation could have been turned into best scenario when the company has started
purchasing less from the trade payables. The quick ratio which is also known as the acid test
ratio is the ratio which will determine how well the company is able to realize the cash
quickly so that the cash keeps on rotating in the organization itself for the better areas. The
quick ratio of the Hilton is 0.84 and that of the Wyndham is 1.85. In order to beat Wyndham,
Hilton must potentially increase the assets that have been useful and can realize the cash on
the immediate basis. The ideal ratio tends to be 1:1 and both the organizations need to
improve to reach the standard. Therefore from the overall analysis it can be stated that the
Hilton hotel is lagging behind of the Wyndham Hotel in case of the overall liquidity of the
organization (Khan & Ali, 2016).
Solvency
The solvency position of the company is necessary to be determined to get an idea of
the proportion of the debt and the equity, with which the company has financed itself as the
proportion is important to understand the thinking prospective and the ability of the balance it
can make. The solvency ratio is the metric that is comprised of the several ratios such as debt
to equity, time’s interest coverage ratio and the long term debt to capital ratio. The position of
the Hilton and the Wyndham can be analysed using the valuation of the debt and equity
(Wyndham Group, 2018).
The below graph determines the debt to equity ratio of the Hilton hotel is at 13.19
whereas that of the Wyndham is at 1.50. the reason for the huge variance is can be observed
from the balance sheet of the Hilton hotel which states that the treasury stock has been in the
negative state in case of the Hilton hotel at $3407000, this resulted in the overall down fall of
the share capital from $1688000 to $551000 only. On the other hand at this stage the
Wyndham group is having upper hand in terms of the debt to equity ratio as it has more
balanced ratio. Here the Hilton hotel needs to improve the position with regards to the loss in
the treasury stock by incorporating more share may it be at discount. Too much financing
from the debt component at one side gives the tax advantage but on the other side it also
results in the high financial burden (Mule, Mukras & Nzioka, 2015).
term liabilities rather than the short term liabilities (Lado-Sestayo, Vivel-Búa & Otero-
González, 2016). It can be observed form the balance sheet that the Hilton hotel has reduced
the current short term liabilities from $46000 to $16000 which is quite commendable whereas
in case of the Wyndham, they also decreased the current liabilities from $103000 to $21000,
but the situation could have been turned into best scenario when the company has started
purchasing less from the trade payables. The quick ratio which is also known as the acid test
ratio is the ratio which will determine how well the company is able to realize the cash
quickly so that the cash keeps on rotating in the organization itself for the better areas. The
quick ratio of the Hilton is 0.84 and that of the Wyndham is 1.85. In order to beat Wyndham,
Hilton must potentially increase the assets that have been useful and can realize the cash on
the immediate basis. The ideal ratio tends to be 1:1 and both the organizations need to
improve to reach the standard. Therefore from the overall analysis it can be stated that the
Hilton hotel is lagging behind of the Wyndham Hotel in case of the overall liquidity of the
organization (Khan & Ali, 2016).
Solvency
The solvency position of the company is necessary to be determined to get an idea of
the proportion of the debt and the equity, with which the company has financed itself as the
proportion is important to understand the thinking prospective and the ability of the balance it
can make. The solvency ratio is the metric that is comprised of the several ratios such as debt
to equity, time’s interest coverage ratio and the long term debt to capital ratio. The position of
the Hilton and the Wyndham can be analysed using the valuation of the debt and equity
(Wyndham Group, 2018).
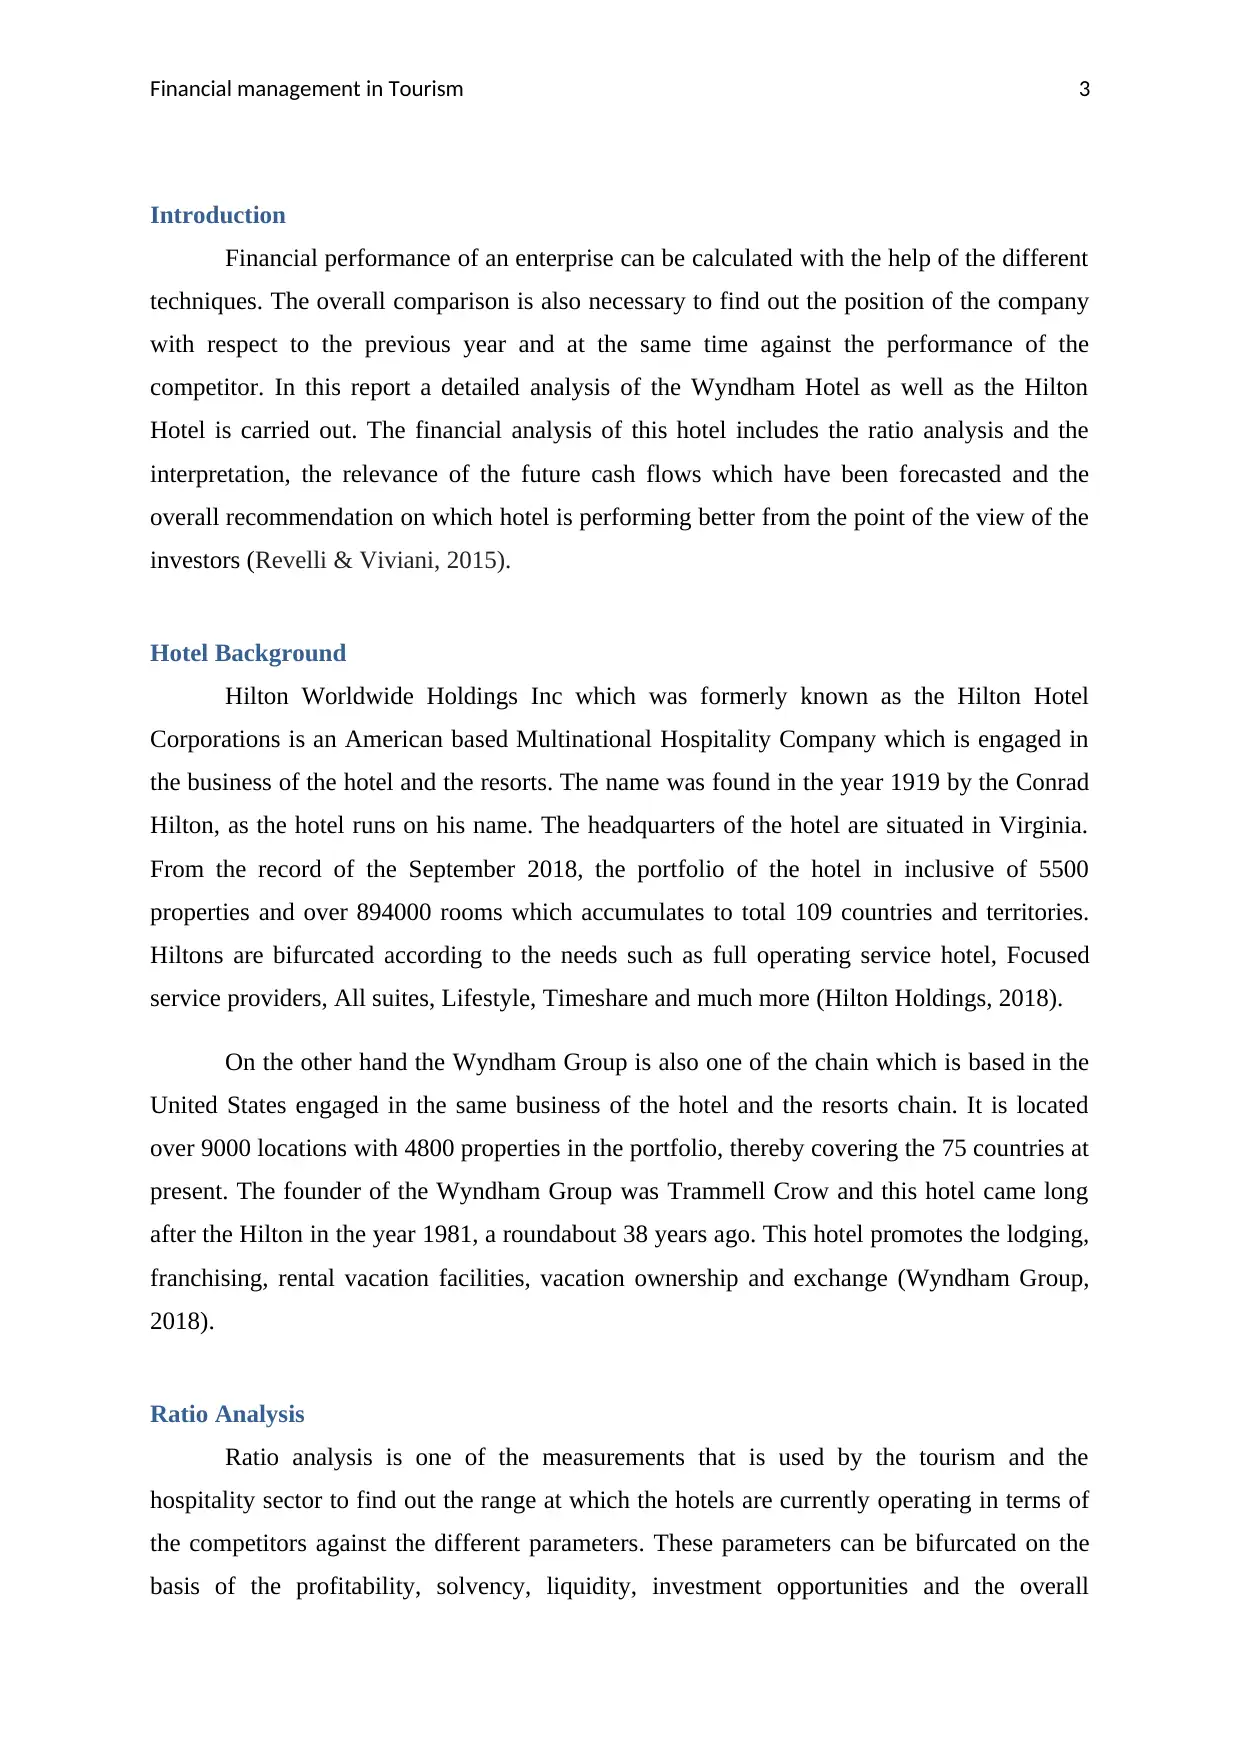
The below graph determines the debt to equity ratio of the Hilton hotel is at 13.19
whereas that of the Wyndham is at 1.50. the reason for the huge variance is can be observed
from the balance sheet of the Hilton hotel which states that the treasury stock has been in the
negative state in case of the Hilton hotel at $3407000, this resulted in the overall down fall of
the share capital from $1688000 to $551000 only. On the other hand at this stage the
Wyndham group is having upper hand in terms of the debt to equity ratio as it has more
balanced ratio. Here the Hilton hotel needs to improve the position with regards to the loss in
the treasury stock by incorporating more share may it be at discount. Too much financing
from the debt component at one side gives the tax advantage but on the other side it also
results in the high financial burden (Mule, Mukras & Nzioka, 2015).
⊘ This is a preview!⊘
Do you want full access?
Subscribe today to unlock all pages.
Trusted by 1+ million students worldwide
Financial management in Tourism 7
Hilton Whydhnam
0.00
2.00
4.00
6.00
8.00
10.00
12.00
14.00
16.00
18.00
20.00
Capital Structure
Net Asset Financing
Times interest coverage
ratio
Long tern debt to capotal
RatioAxis Title
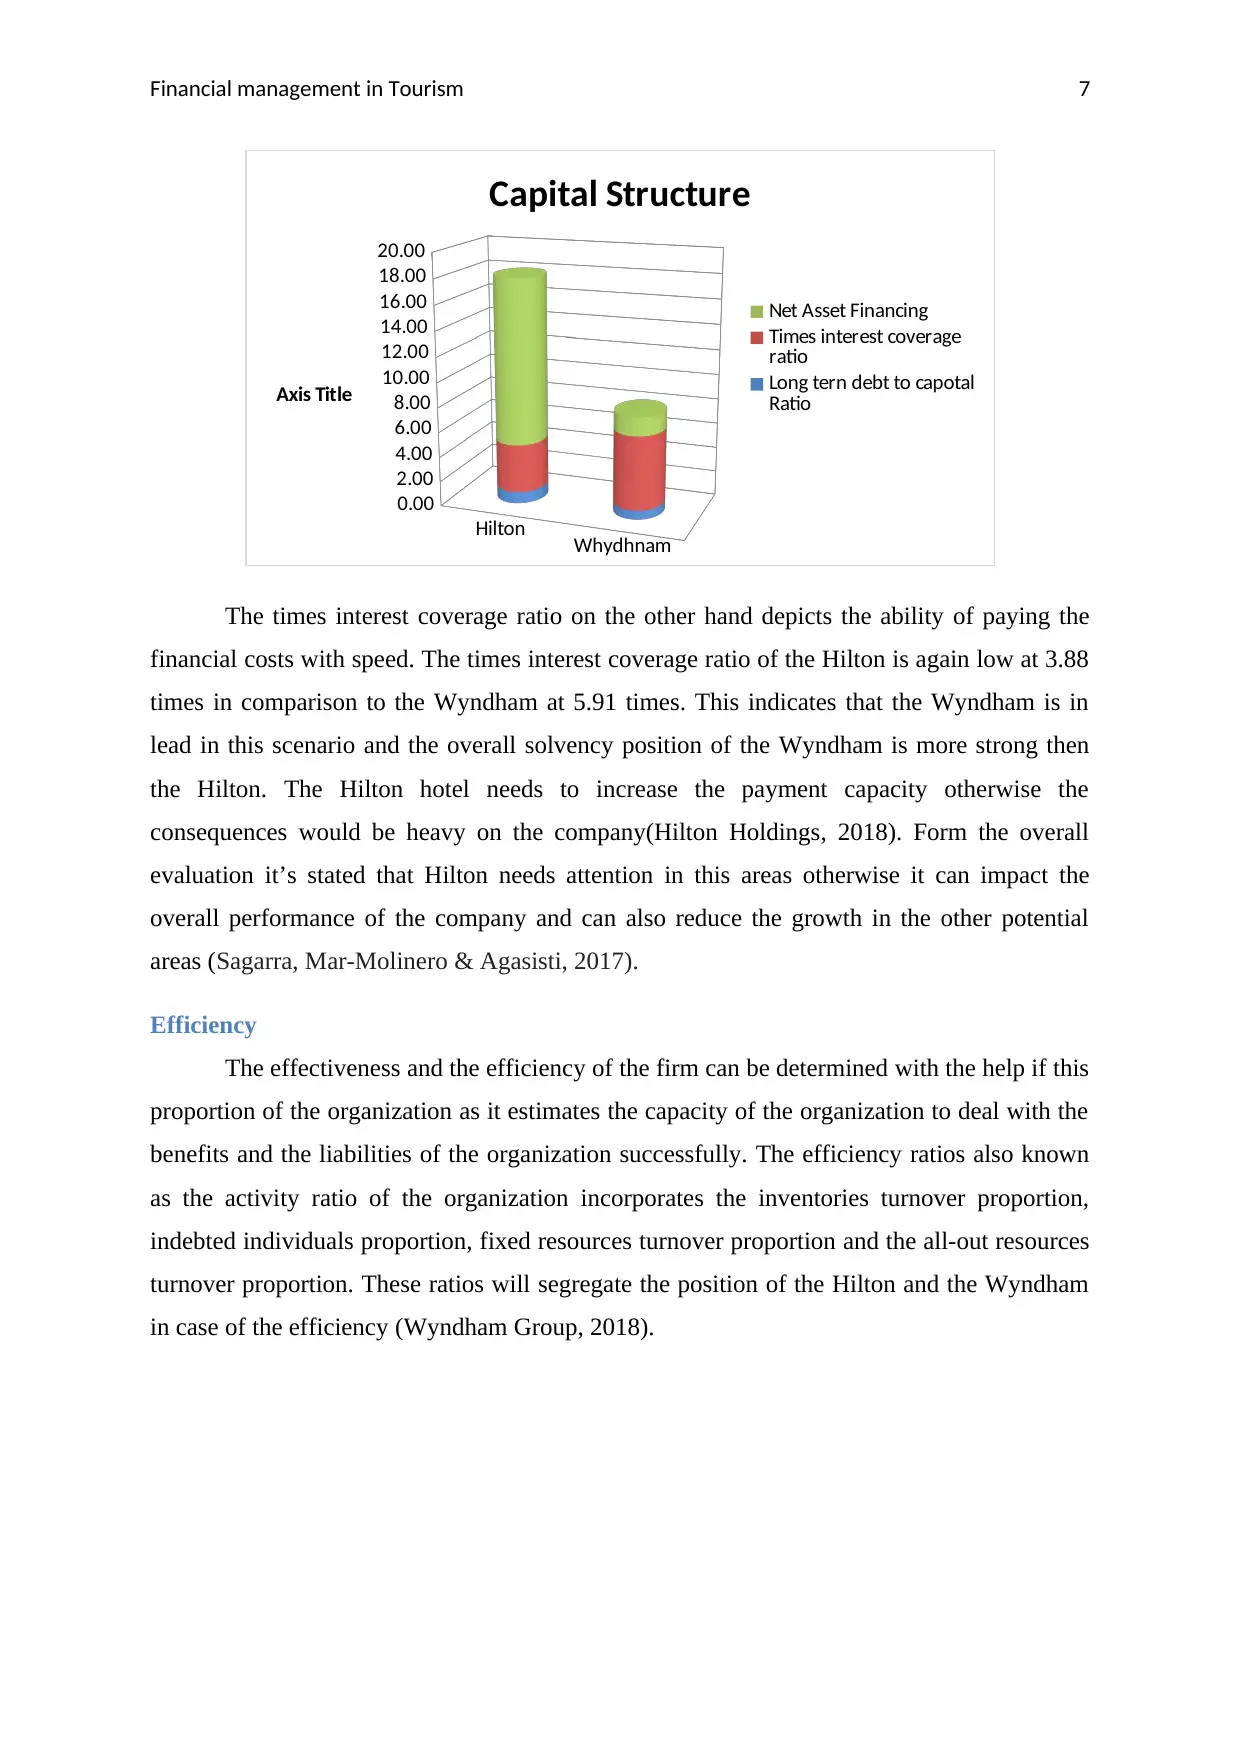
The times interest coverage ratio on the other hand depicts the ability of paying the
financial costs with speed. The times interest coverage ratio of the Hilton is again low at 3.88
times in comparison to the Wyndham at 5.91 times. This indicates that the Wyndham is in
lead in this scenario and the overall solvency position of the Wyndham is more strong then
the Hilton. The Hilton hotel needs to increase the payment capacity otherwise the
consequences would be heavy on the company(Hilton Holdings, 2018). Form the overall
evaluation it’s stated that Hilton needs attention in this areas otherwise it can impact the
overall performance of the company and can also reduce the growth in the other potential
areas (Sagarra, Mar-Molinero & Agasisti, 2017).
Efficiency
The effectiveness and the efficiency of the firm can be determined with the help if this
proportion of the organization as it estimates the capacity of the organization to deal with the
benefits and the liabilities of the organization successfully. The efficiency ratios also known
as the activity ratio of the organization incorporates the inventories turnover proportion,
indebted individuals proportion, fixed resources turnover proportion and the all-out resources
turnover proportion. These ratios will segregate the position of the Hilton and the Wyndham
in case of the efficiency (Wyndham Group, 2018).
Hilton Whydhnam
0.00
2.00
4.00
6.00
8.00
10.00
12.00
14.00
16.00
18.00
20.00
Capital Structure
Net Asset Financing
Times interest coverage
ratio
Long tern debt to capotal
RatioAxis Title
The times interest coverage ratio on the other hand depicts the ability of paying the
financial costs with speed. The times interest coverage ratio of the Hilton is again low at 3.88
times in comparison to the Wyndham at 5.91 times. This indicates that the Wyndham is in
lead in this scenario and the overall solvency position of the Wyndham is more strong then
the Hilton. The Hilton hotel needs to increase the payment capacity otherwise the
consequences would be heavy on the company(Hilton Holdings, 2018). Form the overall
evaluation it’s stated that Hilton needs attention in this areas otherwise it can impact the
overall performance of the company and can also reduce the growth in the other potential
areas (Sagarra, Mar-Molinero & Agasisti, 2017).
Efficiency
The effectiveness and the efficiency of the firm can be determined with the help if this
proportion of the organization as it estimates the capacity of the organization to deal with the
benefits and the liabilities of the organization successfully. The efficiency ratios also known
as the activity ratio of the organization incorporates the inventories turnover proportion,
indebted individuals proportion, fixed resources turnover proportion and the all-out resources
turnover proportion. These ratios will segregate the position of the Hilton and the Wyndham
in case of the efficiency (Wyndham Group, 2018).
Paraphrase This Document
Need a fresh take? Get an instant paraphrase of this document with our AI Paraphraser
Financial management in Tourism 8
Hilton
Whydhnam
0.00
20.00
40.00
60.00
80.00
100.00
120.00
Activity Ratios
Accounts Receivable
Accounts payable turnover
Fixed Asset Turnover
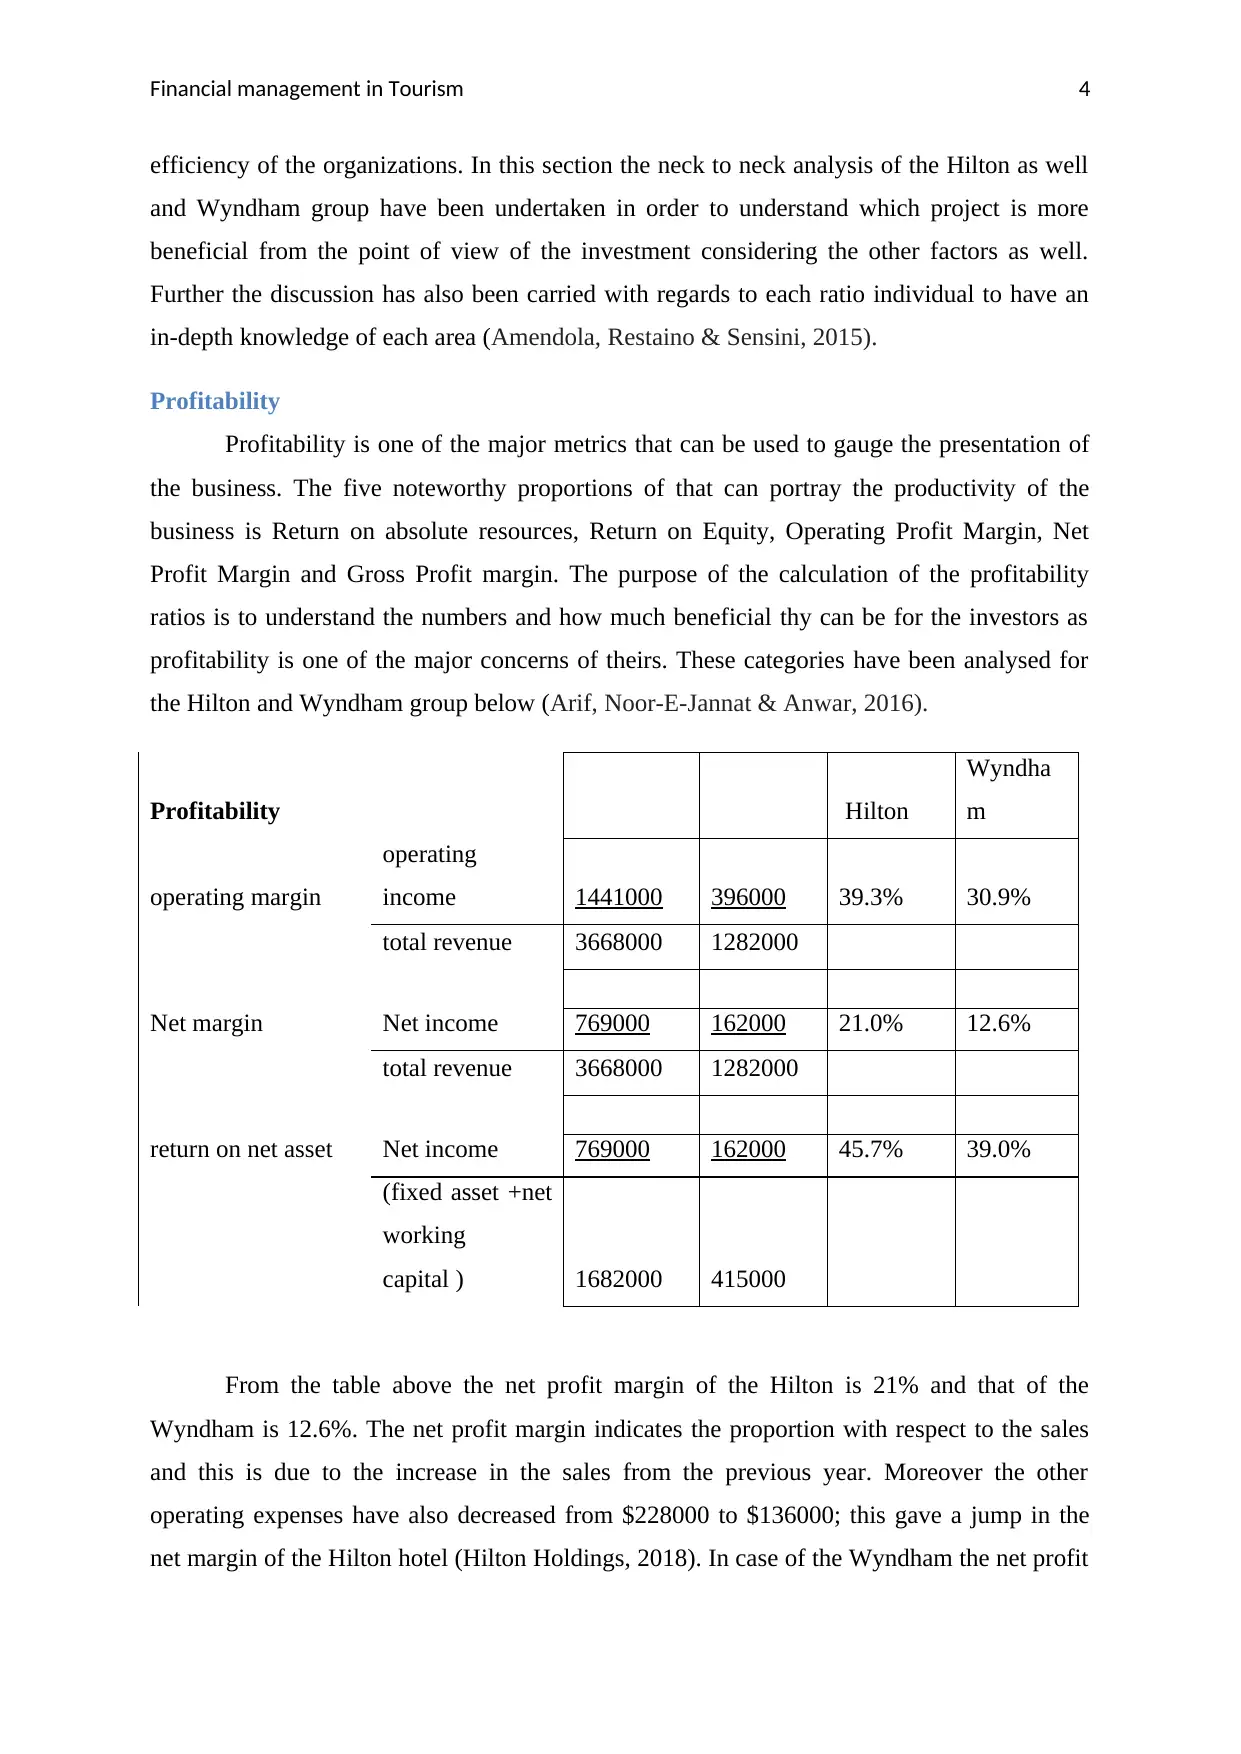
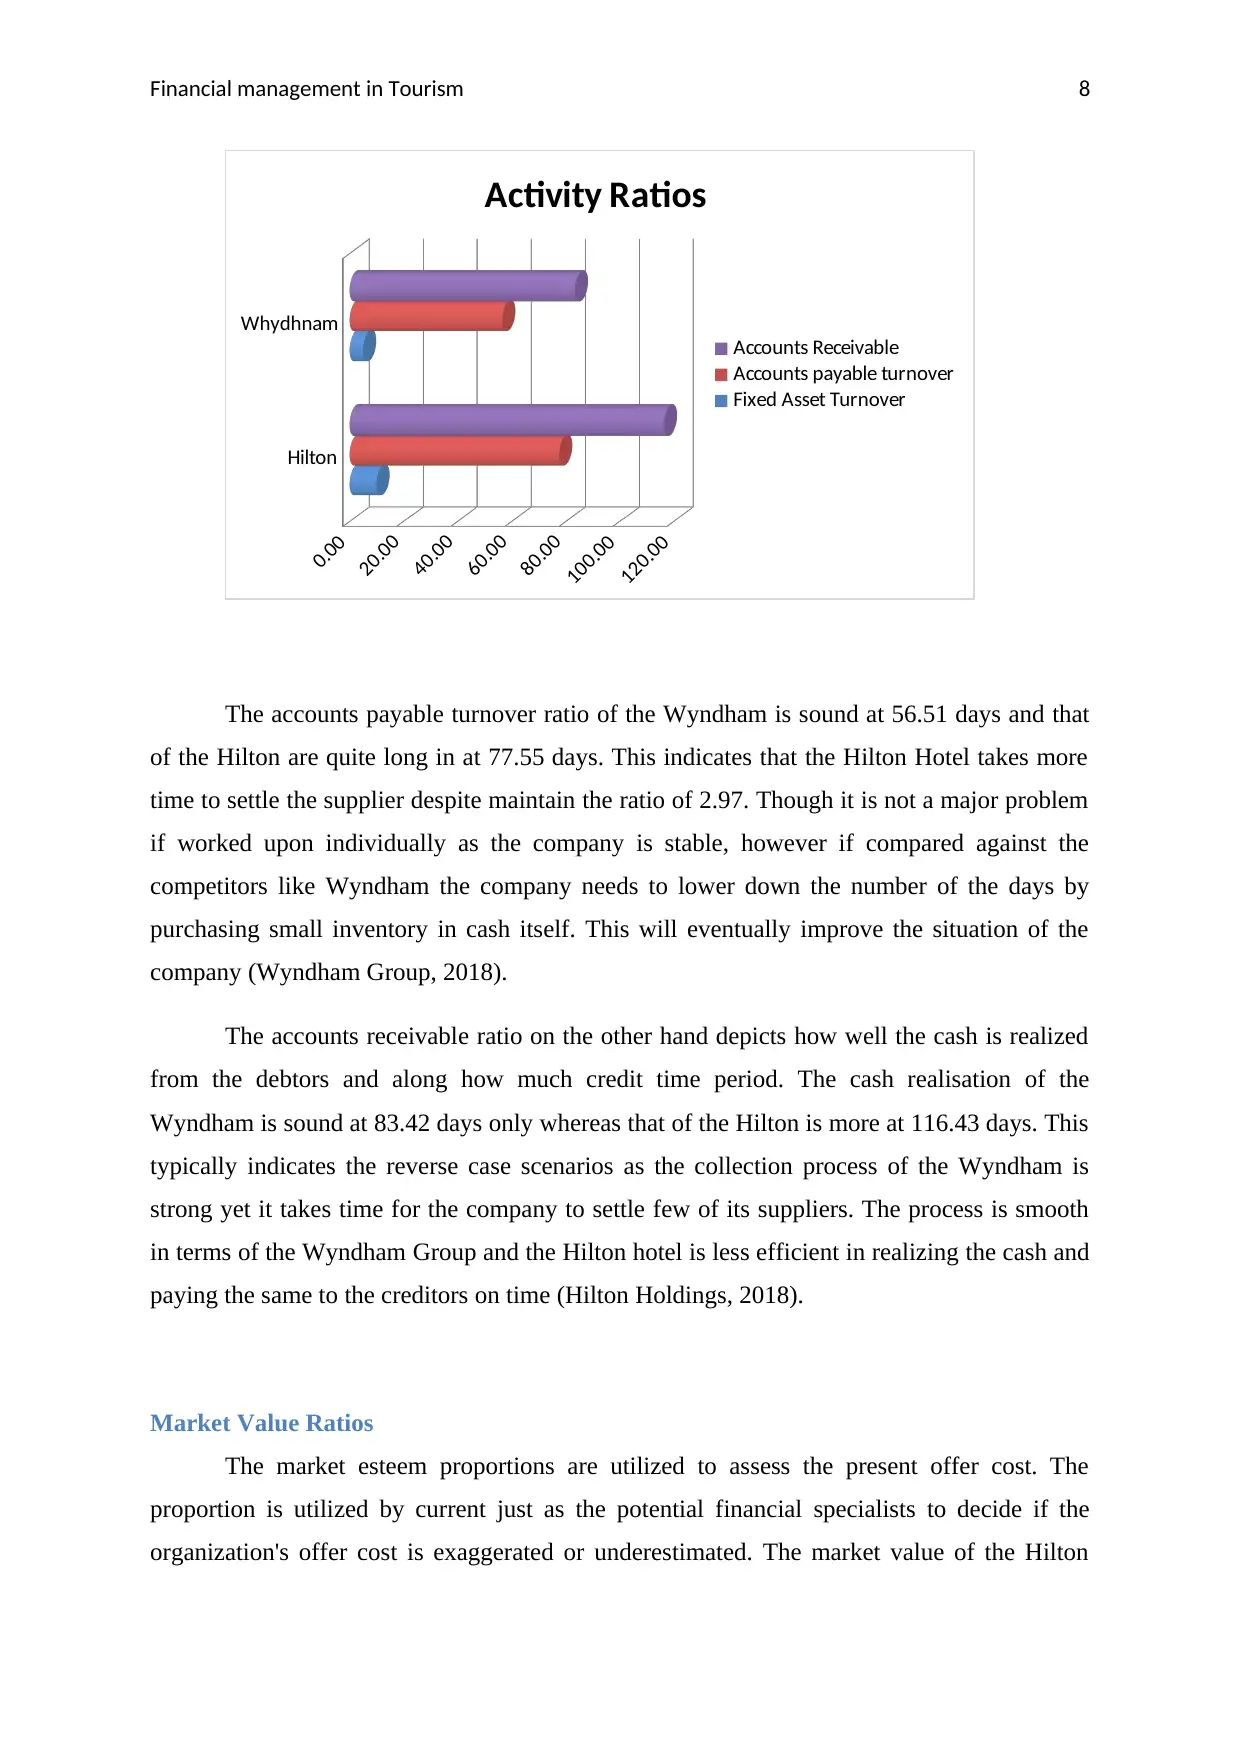
The accounts payable turnover ratio of the Wyndham is sound at 56.51 days and that
of the Hilton are quite long in at 77.55 days. This indicates that the Hilton Hotel takes more
time to settle the supplier despite maintain the ratio of 2.97. Though it is not a major problem
if worked upon individually as the company is stable, however if compared against the
competitors like Wyndham the company needs to lower down the number of the days by
purchasing small inventory in cash itself. This will eventually improve the situation of the
company (Wyndham Group, 2018).
The accounts receivable ratio on the other hand depicts how well the cash is realized
from the debtors and along how much credit time period. The cash realisation of the
Wyndham is sound at 83.42 days only whereas that of the Hilton is more at 116.43 days. This
typically indicates the reverse case scenarios as the collection process of the Wyndham is
strong yet it takes time for the company to settle few of its suppliers. The process is smooth
in terms of the Wyndham Group and the Hilton hotel is less efficient in realizing the cash and
paying the same to the creditors on time (Hilton Holdings, 2018).
Market Value Ratios
The market esteem proportions are utilized to assess the present offer cost. The
proportion is utilized by current just as the potential financial specialists to decide if the
organization's offer cost is exaggerated or underestimated. The market value of the Hilton
Hilton
Whydhnam
0.00
20.00
40.00
60.00
80.00
100.00
120.00
Activity Ratios
Accounts Receivable
Accounts payable turnover
Fixed Asset Turnover
The accounts payable turnover ratio of the Wyndham is sound at 56.51 days and that
of the Hilton are quite long in at 77.55 days. This indicates that the Hilton Hotel takes more
time to settle the supplier despite maintain the ratio of 2.97. Though it is not a major problem
if worked upon individually as the company is stable, however if compared against the
competitors like Wyndham the company needs to lower down the number of the days by
purchasing small inventory in cash itself. This will eventually improve the situation of the
company (Wyndham Group, 2018).
The accounts receivable ratio on the other hand depicts how well the cash is realized
from the debtors and along how much credit time period. The cash realisation of the
Wyndham is sound at 83.42 days only whereas that of the Hilton is more at 116.43 days. This
typically indicates the reverse case scenarios as the collection process of the Wyndham is
strong yet it takes time for the company to settle few of its suppliers. The process is smooth
in terms of the Wyndham Group and the Hilton hotel is less efficient in realizing the cash and
paying the same to the creditors on time (Hilton Holdings, 2018).
Market Value Ratios
The market esteem proportions are utilized to assess the present offer cost. The
proportion is utilized by current just as the potential financial specialists to decide if the
organization's offer cost is exaggerated or underestimated. The market value of the Hilton
Financial management in Tourism 9
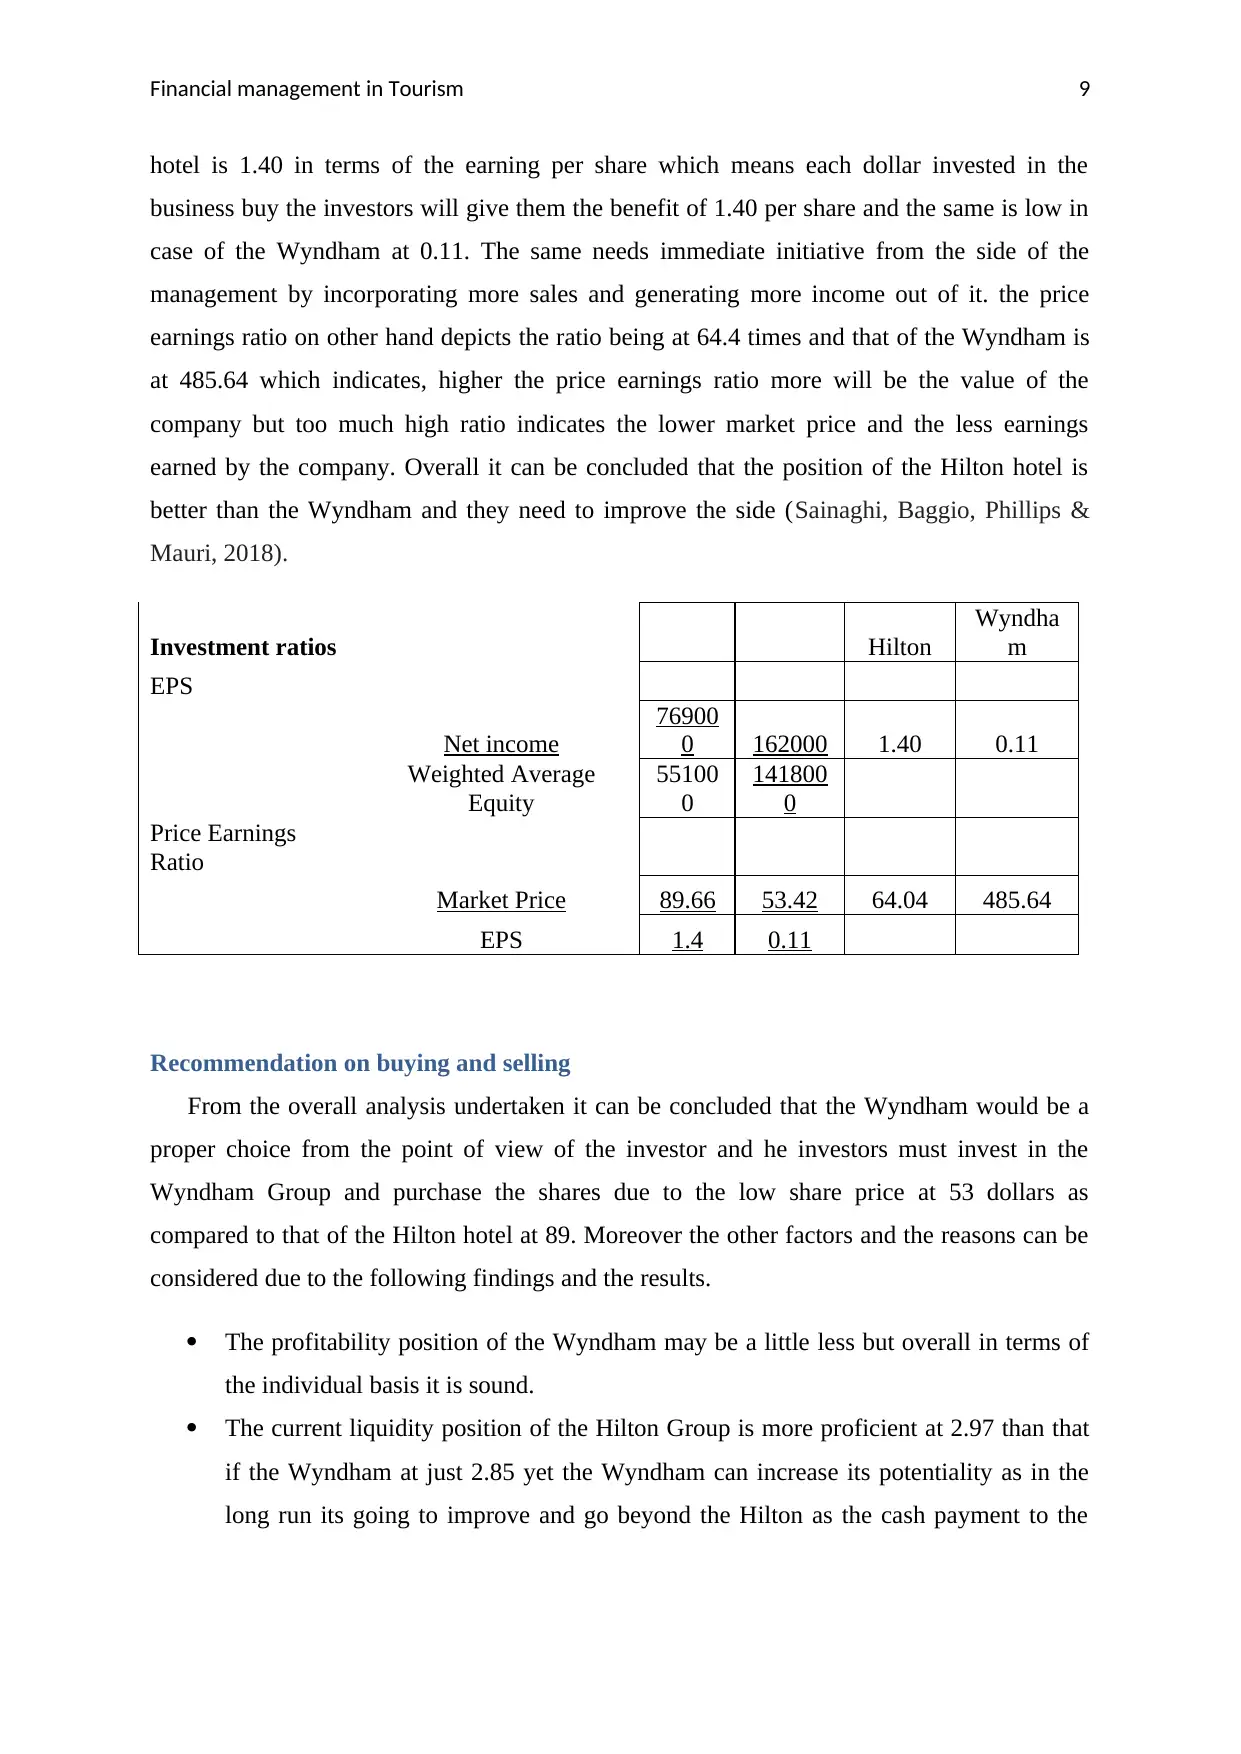
hotel is 1.40 in terms of the earning per share which means each dollar invested in the
business buy the investors will give them the benefit of 1.40 per share and the same is low in
case of the Wyndham at 0.11. The same needs immediate initiative from the side of the
management by incorporating more sales and generating more income out of it. the price
earnings ratio on other hand depicts the ratio being at 64.4 times and that of the Wyndham is
at 485.64 which indicates, higher the price earnings ratio more will be the value of the
company but too much high ratio indicates the lower market price and the less earnings
earned by the company. Overall it can be concluded that the position of the Hilton hotel is
better than the Wyndham and they need to improve the side (Sainaghi, Baggio, Phillips &
Mauri, 2018).
Investment ratios Hilton
Wyndha
m
EPS
Net income
76900
0 162000 1.40 0.11
Weighted Average
Equity
55100
0
141800
0
Price Earnings
Ratio
Market Price 89.66 53.42 64.04 485.64
EPS 1.4 0.11
Recommendation on buying and selling
From the overall analysis undertaken it can be concluded that the Wyndham would be a
proper choice from the point of view of the investor and he investors must invest in the
Wyndham Group and purchase the shares due to the low share price at 53 dollars as
compared to that of the Hilton hotel at 89. Moreover the other factors and the reasons can be
considered due to the following findings and the results.
The profitability position of the Wyndham may be a little less but overall in terms of
the individual basis it is sound.
The current liquidity position of the Hilton Group is more proficient at 2.97 than that
if the Wyndham at just 2.85 yet the Wyndham can increase its potentiality as in the
long run its going to improve and go beyond the Hilton as the cash payment to the
⊘ This is a preview!⊘
Do you want full access?
Subscribe today to unlock all pages.
Trusted by 1+ million students worldwide
Financial management in Tourism 10
accounts payable have already been sound in case of the Wyndham (Wyndham
Group, 2018).
The overall solvency position of the Wyndham is again ahead of the Hilton Group as
this would clearly be observed from the graph above which stated the strong ability of
the company to handle the finance cost and at the same time the blend of the debt and
the equity is wonderful in case of the Wyndham.
The overall efficiency is also more than the Hilton Hotel (Hilton Holdings, 2018).
Conclusion
From the overall analysis it can be learned that the techniques like ratio analysis can
really help an investor judge which company shall he/she invest in. of course the ideologies
and the interpretation may vary from investor to investor yet the evaluation on the ground
performance to achieve the realistic results can be done. The overall analysis answers that the
Wyndham Group is ahead in all sense and it would be beneficial from the point of view of the
investor to invest as it would give the future growth and the stability to the business.
Paraphrase This Document
Need a fresh take? Get an instant paraphrase of this document with our AI Paraphraser
Financial management in Tourism 11
References
Amendola, A., Restaino, M., & Sensini, L. (2015). An analysis of the determinants of
financial distress in Italy: A competing risks approach. International Review of
Economics & Finance, 37, 33-41.
Arif, T. M. H., Noor-E-Jannat, K., & Anwar, S. R. (2016). Financial Statement and
Competitiveness Analysis: A Study on Tourism & Hospitality Industry in
Bangladesh. International Journal of Financial Research, 7(4), 180-189.
Gémar, G., Moniche, L., & Morales, A. J. (2016). Survival analysis of the Spanish hotel
industry. Tourism Management, 54, 428-438.
Grant, R. M. (2016). Contemporary strategy analysis: Text and cases edition. John Wiley &
Sons.
Hilton Holdings, (2018). Balance sheet. Retrieved from
https://finance.yahoo.com/quote/HLT/balance-sheet?p=HLT
Hilton Holdings, (2018). Income Statement. Retrieved from
https://finance.yahoo.com/quote/HLT/financials?p=HLT
Khan, R. A., & Ali, M. (2016). Impact of liquidity on profitability of commercial banks in
Pakistan: An analysis on banking sector in Pakistan. Global Journal of Management
And Business Research.
Lado-Sestayo, R., Vivel-Búa, M., & Otero-González, L. (2016). Survival in the lodging
sector: An analysis at the firm and location levels. International Journal of
Hospitality Management, 59, 19-30.
Mule, R. K., Mukras, M. S., & Nzioka, O. M. (2015). Corporate size, profitability and market
value: An econometric panel analysis of listed firms in Kenya. European Scientific Journal,
ESJ, 11(13).
Revelli, C., & Viviani, J. L. (2015). Financial performance of socially responsible investing
(SRI): what have we learned? A meta‐analysis. Business Ethics: A European
Review, 24(2), 158-185.
Financial management in Tourism 12
Sagarra, M., Mar-Molinero, C., & Agasisti, T. (2017). Exploring the efficiency of Mexican
universities: integrating data envelopment analysis and multidimensional scaling. Omega, 67,
123-133.
Sainaghi, R., Baggio, R., Phillips, P., & Mauri, A. G. (2018). Hotel performance and research
streams: a network cluster analysis. International Journal of Contemporary
Hospitality Management.
Wyndham Group, (2018). Balance Sheet. Retrieved from
https://finance.yahoo.com/quote/WH/balance-sheet?p=WH
Wyndham Group, (2018). Income Statement. Retrieved from
https://finance.yahoo.com/quote/WH/financials?p=WH
⊘ This is a preview!⊘
Do you want full access?
Subscribe today to unlock all pages.
Trusted by 1+ million students worldwide
1 out of 14
Related Documents


Your All-in-One AI-Powered Toolkit for Academic Success.
+13062052269
info@desklib.com
Available 24*7 on WhatsApp / Email
![[object Object]](/_next/static/media/star-bottom.7253800d.svg)
Unlock your academic potential
Copyright © 2020–2026 A2Z Services. All Rights Reserved. Developed and managed by ZUCOL.