Financial Analysis and Comparison: Telecom Companies' Performance
VerifiedAdded on 2020/06/06
|17
|3455
|294
Report
AI Summary
This report presents a comprehensive financial analysis of two prominent telecom companies, Celcom and TM Telecom. It begins with an overview of each company, including their annual reports, vision, and operational strategies. The core of the report involves the calculation and interpretation of key financial ratios, categorized into liquidity, activity, profitability, market, and debt ratios. These ratios, derived from the companies' financial statements, are used to assess their financial health and performance. A comparative analysis of the two companies is then conducted, highlighting their strengths and weaknesses based on the calculated ratios. The report concludes with valuable recommendations for improving the companies' financial positions. Tables containing income statements and balance sheets are included to support the analysis.

Introduction of Financial
Management
Management
Paraphrase This Document
Need a fresh take? Get an instant paraphrase of this document with our AI Paraphraser
Table of Contents
INTRODUCTION...........................................................................................................................3
1. Overview of company and its annual reports.....................................................................3
2. Calculation of financial ratio's to evaluate firm's performance..........................................5
3: Compare and financial performance among two companies............................................7
4: Review and valuable recommendation...............................................................................8
CONCLUSION................................................................................................................................9
REFERENCES..............................................................................................................................10
APPENDIX : 1...............................................................................................................................11
Table 1: Incomes statements of TM telecom ......................................................................11
Table: 2: Balance sheet: .......................................................................................................12
Table 3: Incomes statements of Celcom Telecom ...............................................................14
Table 4: Balance sheet..........................................................................................................15
INTRODUCTION
Financial management is an utmost crucial aspect of an organisation. This will be helpful
in managing and controlling various financial transactions that are done during a specific period
of time. The primary motive of an organisation is to make proper analysis of financial position
and performance of a company so that better decisions can be made accordingly. This particular
report provides valuable information about two companies which are dealing in telecom sector.
Managers need to make use of financial statements from annual reports to determine the
key financial ratios. This is done to determine the current year’s performance of company as
compared to another one. Understanding of key financial analysis to examine difference between
their financial position. The overall evaluation is done in order to deliver effective suggestions to
make improvement in their present financial position (Brigham and Houston, 2012).
1. Overview of company and its annual reports
In order to make proper analysis of financial condition, it is vital for the managers to
understand various aspects that are helpful in examining their current position. For this purpose,
they need to analyse two best companies that are dealing in the same sector which are operating
in Bursa Malaysia. These two are discussed underneath:
Celcom Telecommunication:
Celcom Axiata Berhad was established in the year 1998 as the oldest mobile
telecommunication provider in Malaysia. It is a type of private company which is related with
telecommunication broadcasting whose headquarter is located in Kuala Lumpur. It is one
originally obtain a cellular phone license in formulating Extended total access communication
system. With the mobile numbering portability by Malaysian communications and multimedia
commission, they are also engaged in virtual mobile operator services. Celcom is also associated
with providing rural communication services by using CDMA technology and satellite mobiles.
In the initial stages, Celcom has experienced an enormous increase in subscriber base and
network coverage of the country. They have expanded in the segment of system integration from
mid and small sized enterprises. It involves design, deployment and maintenance of LAN
solution through deploying Ethernet networking technology. Their business operations were
changed to digital network technology and related services. They are planning to developed
Malaysia's first carrier class metro Ethernet fibre optic to one border to another spanning
3
⊘ This is a preview!⊘
Do you want full access?
Subscribe today to unlock all pages.
Trusted by 1+ million students worldwide
peninsular Malaysia. It serves enterprise as well as wholesale customers such as hospitality,
healthcare and financial services. Celcom telecom services are more higher costs and are more
valuable for the company in accordance with delivery superior services to respective client.
Annual report analysis:
It is one of the leading telecommunication groups in Asia with 320 million subscribers in
almost 10 nations. They wants to pieces together as one of the best in the region in accordance
with innovation, connectivity and talent. Through its diverse portfolios in networking sectors and
digital services, they want to offer a wide range of innovative products to their respective
customers (Chandra, 2011).
Vision:
They are seeing them as new generation digital champion till 2020.
Telekom Malaysia:
It is known as one of the leading telecommunication companies with a perfect digital
networking services. Initially, as the national telco for fixed line, radio and television
broadcasting services to connect every point. It has evolved to become one of the widest
broadband services delivery company. It is a type of public traded government operated
company. It is situated at Telekom Tower, Kuala Lumper. This company is working with total of
28047 to generate health revenues of 11.24 billion. As per the current trend seen in TM venture
into the long term evaluation space with the opening of 4G offerings. The rate at which
Malaysians company would adopt digital techniques is the one which is operating as wide
government can linked business companies in the nations. Along with the increase in trade and
formulation of townships, the total number of telephone subscribers in Malaysia is enhancing
every day with their significances (Higgins, 2012).
Annual report of TM:
Digital solutions are changing the ways of all our clients that are living and work for
betterment of an organisation. Businesses stand to create more benefits from operational and cost
efficiencies as well as to increase customer experiences. With the high grade connectivity, data
centres and cloud services enable their business customers in their own digital guidance. TM has
long recognised terms that create value of sustainable operations of developing strong
relationship that is based on trust with stakeholders. Their primary aim is to focus on delivering
superior customer experiences. As a market leader, they are driven by stakeholder interest
4
Paraphrase This Document
Need a fresh take? Get an instant paraphrase of this document with our AI Paraphraser
creation in a wide competitive market. The group places make more emphasis on increasing
customer experiences through contributing better services quality in their telecommunication
sectors.
Vision:
Their primary vision is to make life and business easier for a better Malaysia.
2. Calculation of financial ratio's to evaluate firm's performance
Financial ratio is generally taken from the balance sheet, income statement as well as
from change statement in equity. It is categorised on the basis of financial aspect that measures
ratio of business. Some ratios are discussed as below:
Liquidity ratio: This ratio measures cash availability in order to pay debt obligations. It is
normally used in the comparative form which may be formed internally or externally. Its margin
of safety can be calculated by metrics which include ratio of current, quick and operating cash
flow. Liquidity ratios are used to evaluate the going concern issues by bankruptcy analysts and
mortgage originators. It includes some vital components such as:
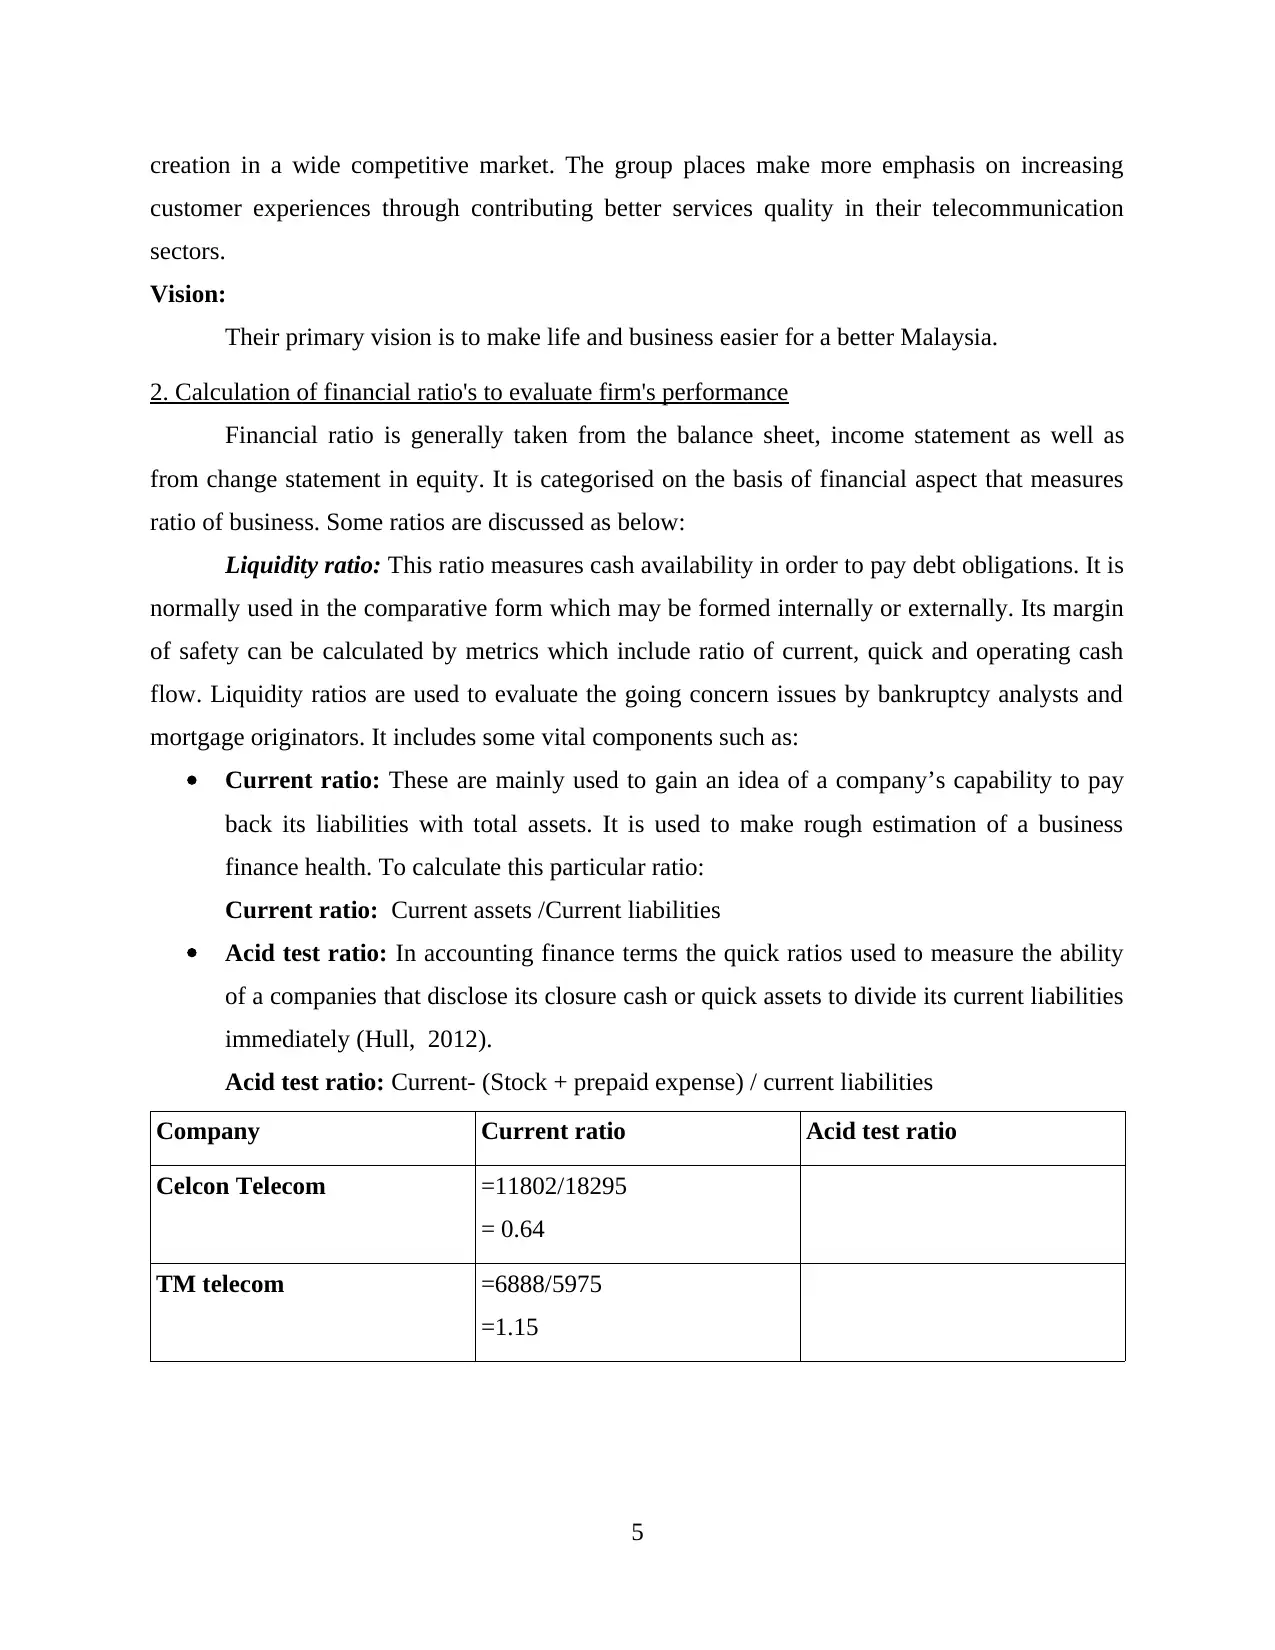
Current ratio: These are mainly used to gain an idea of a company’s capability to pay
back its liabilities with total assets. It is used to make rough estimation of a business
finance health. To calculate this particular ratio:
Current ratio: Current assets /Current liabilities
Acid test ratio: In accounting finance terms the quick ratios used to measure the ability
of a companies that disclose its closure cash or quick assets to divide its current liabilities
immediately (Hull, 2012).
Acid test ratio: Current- (Stock + prepaid expense) / current liabilities
Company Current ratio Acid test ratio
Celcon Telecom =11802/18295
= 0.64
TM telecom =6888/5975
=1.15
5
customer experiences through contributing better services quality in their telecommunication
sectors.
Vision:
Their primary vision is to make life and business easier for a better Malaysia.
2. Calculation of financial ratio's to evaluate firm's performance
Financial ratio is generally taken from the balance sheet, income statement as well as
from change statement in equity. It is categorised on the basis of financial aspect that measures
ratio of business. Some ratios are discussed as below:
Liquidity ratio: This ratio measures cash availability in order to pay debt obligations. It is
normally used in the comparative form which may be formed internally or externally. Its margin
of safety can be calculated by metrics which include ratio of current, quick and operating cash
flow. Liquidity ratios are used to evaluate the going concern issues by bankruptcy analysts and
mortgage originators. It includes some vital components such as:
Current ratio: These are mainly used to gain an idea of a company’s capability to pay
back its liabilities with total assets. It is used to make rough estimation of a business
finance health. To calculate this particular ratio:
Current ratio: Current assets /Current liabilities
Acid test ratio: In accounting finance terms the quick ratios used to measure the ability
of a companies that disclose its closure cash or quick assets to divide its current liabilities
immediately (Hull, 2012).
Acid test ratio: Current- (Stock + prepaid expense) / current liabilities
Company Current ratio Acid test ratio
Celcon Telecom =11802/18295
= 0.64
TM telecom =6888/5975
=1.15
5
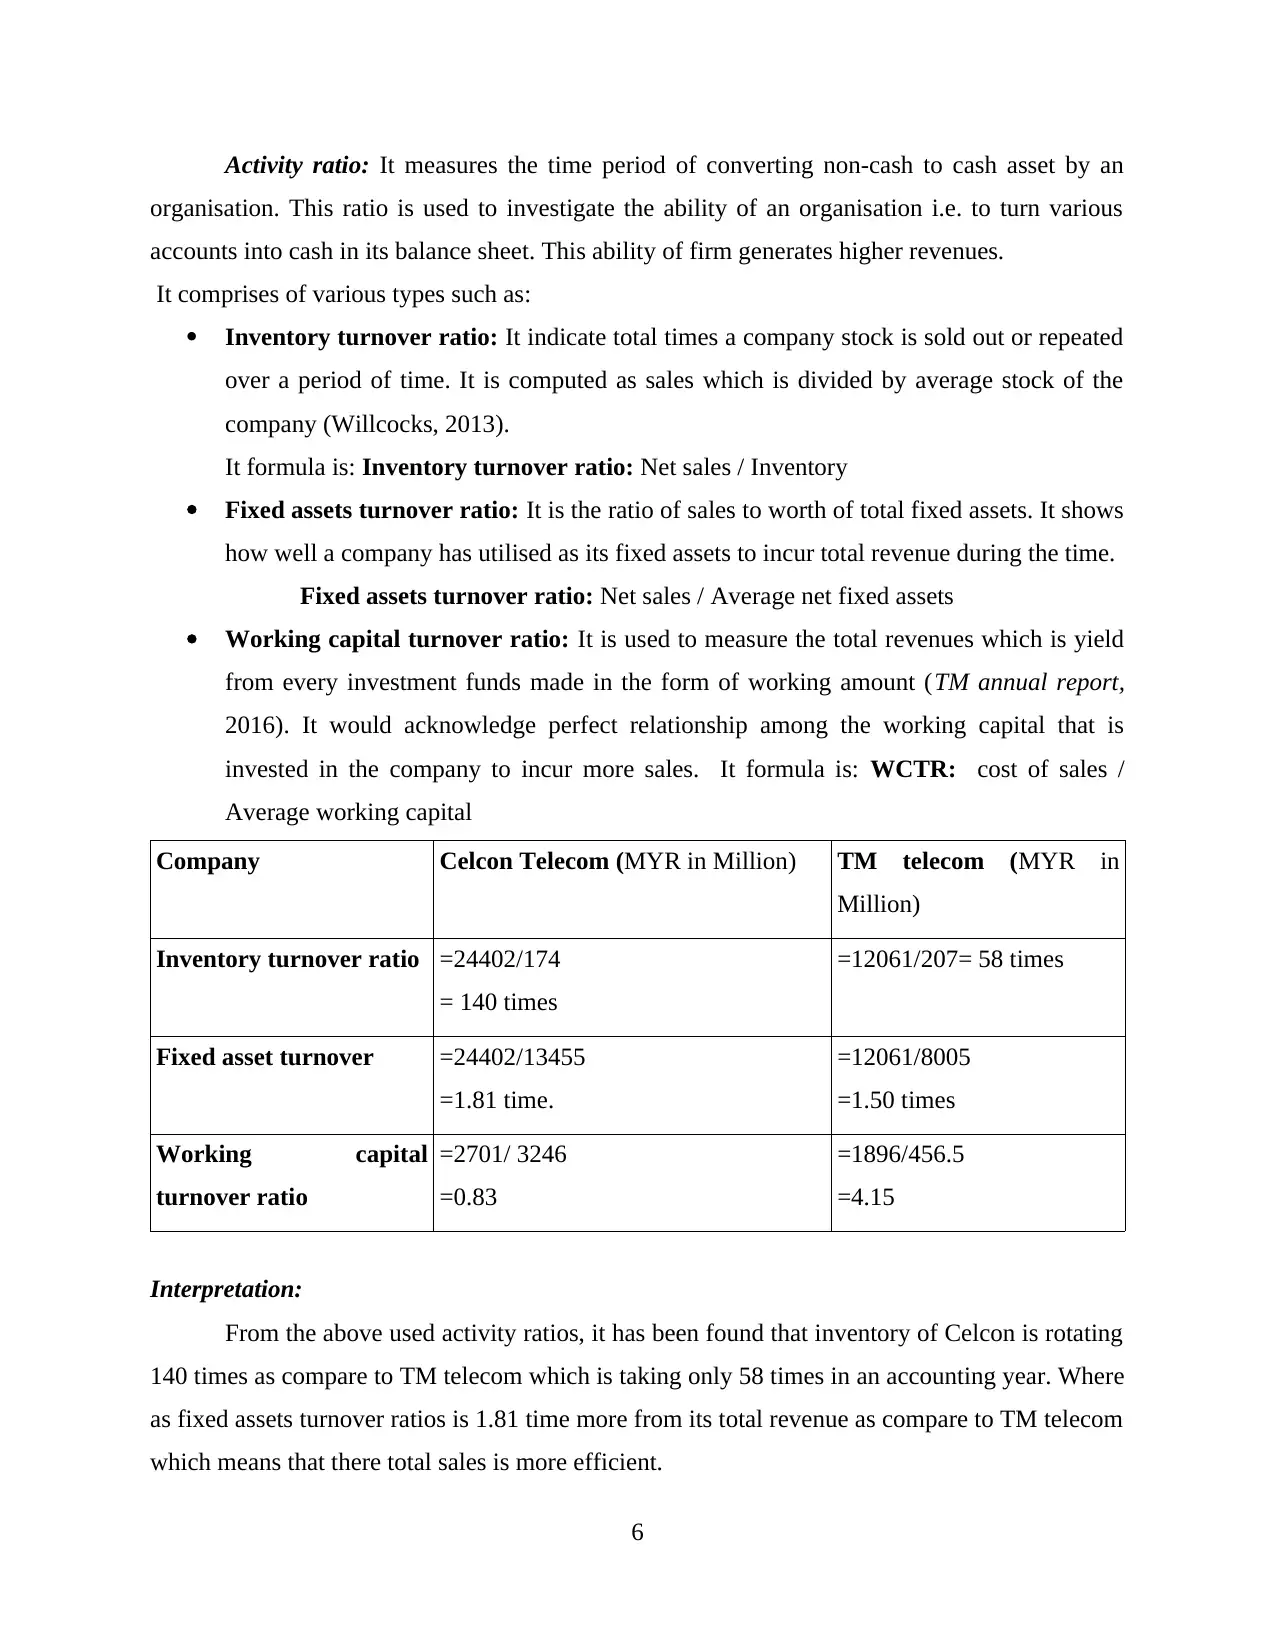
Activity ratio: It measures the time period of converting non-cash to cash asset by an
organisation. This ratio is used to investigate the ability of an organisation i.e. to turn various
accounts into cash in its balance sheet. This ability of firm generates higher revenues.
It comprises of various types such as:
Inventory turnover ratio: It indicate total times a company stock is sold out or repeated
over a period of time. It is computed as sales which is divided by average stock of the
company (Willcocks, 2013).
It formula is: Inventory turnover ratio: Net sales / Inventory
Fixed assets turnover ratio: It is the ratio of sales to worth of total fixed assets. It shows
how well a company has utilised as its fixed assets to incur total revenue during the time.
Fixed assets turnover ratio: Net sales / Average net fixed assets
Working capital turnover ratio: It is used to measure the total revenues which is yield
from every investment funds made in the form of working amount (TM annual report,
2016). It would acknowledge perfect relationship among the working capital that is
invested in the company to incur more sales. It formula is: WCTR: cost of sales /
Average working capital
Company Celcon Telecom (MYR in Million) TM telecom (MYR in
Million)
Inventory turnover ratio =24402/174
= 140 times
=12061/207= 58 times
Fixed asset turnover =24402/13455
=1.81 time.
=12061/8005
=1.50 times
Working capital
turnover ratio
=2701/ 3246
=0.83
=1896/456.5
=4.15
Interpretation:
From the above used activity ratios, it has been found that inventory of Celcon is rotating
140 times as compare to TM telecom which is taking only 58 times in an accounting year. Where
as fixed assets turnover ratios is 1.81 time more from its total revenue as compare to TM telecom
which means that there total sales is more efficient.
6
⊘ This is a preview!⊘
Do you want full access?
Subscribe today to unlock all pages.
Trusted by 1+ million students worldwide
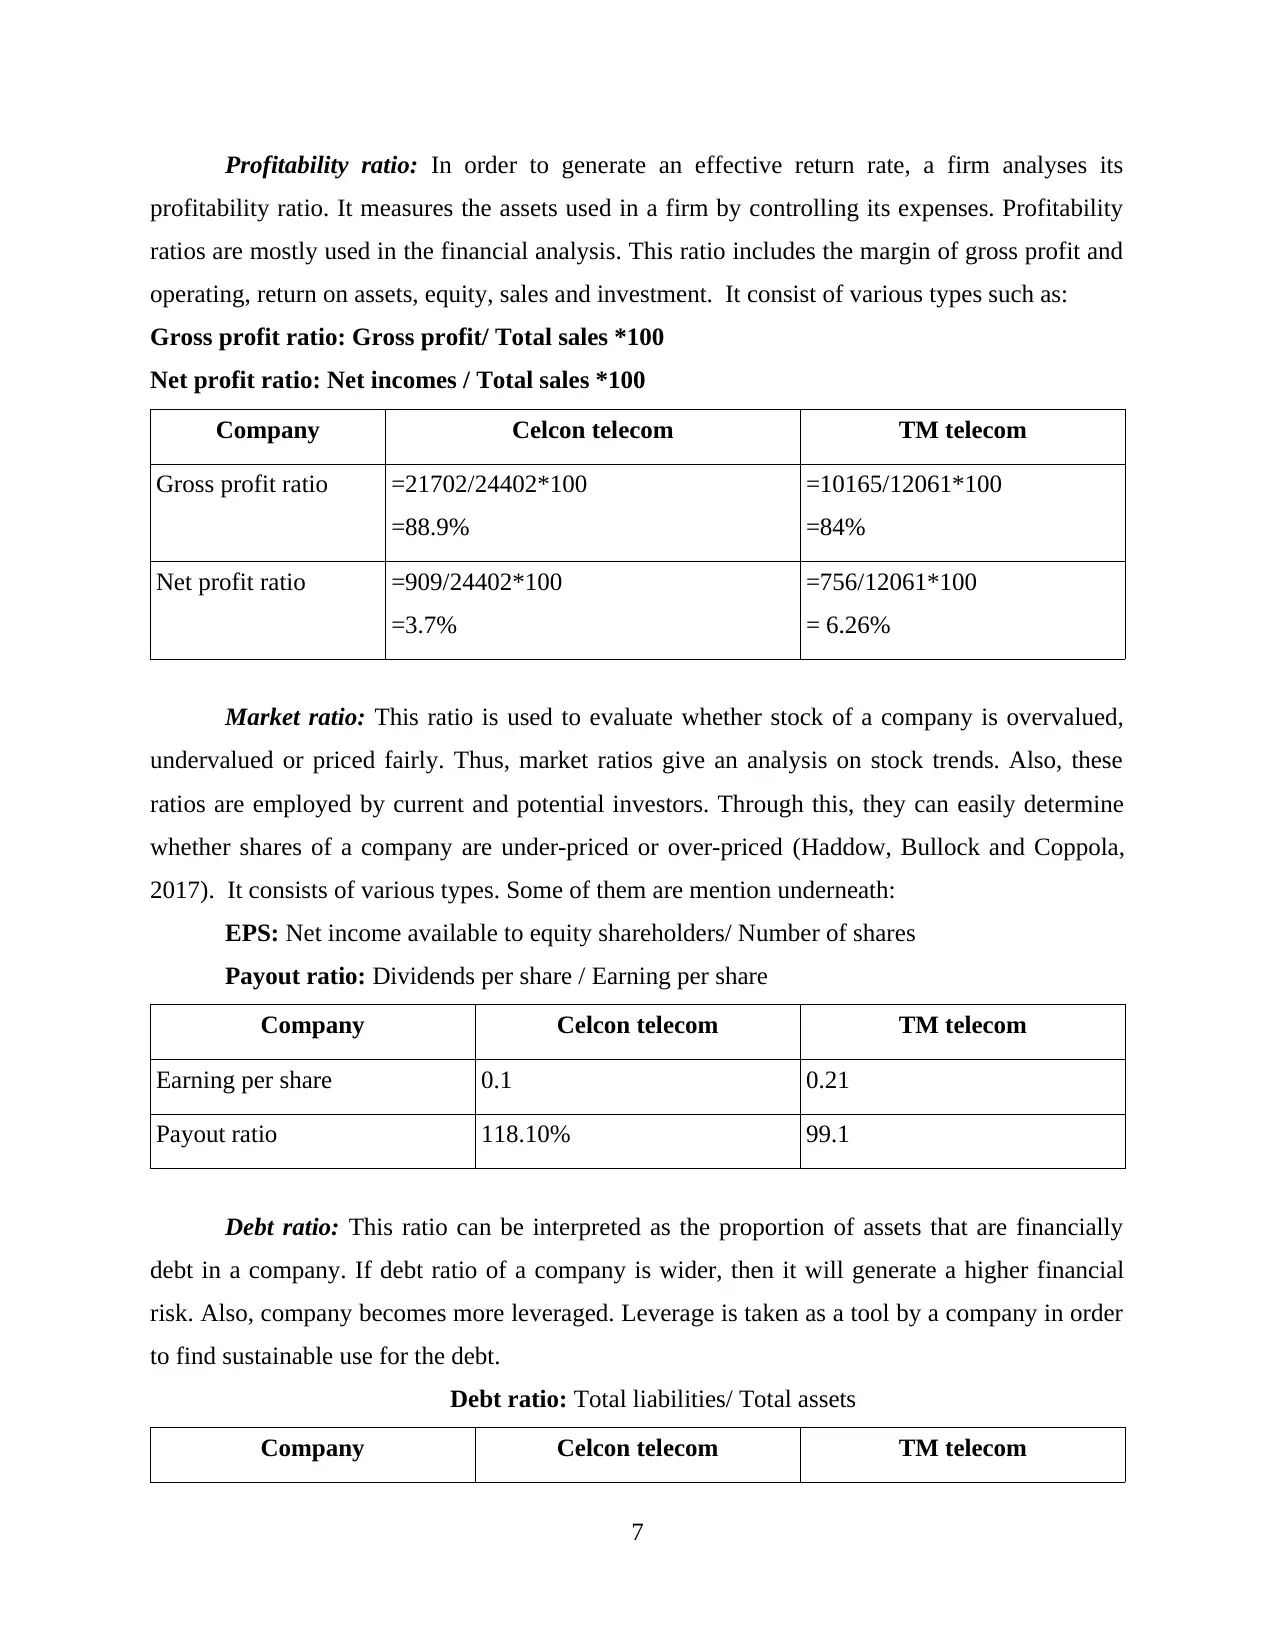
Profitability ratio: In order to generate an effective return rate, a firm analyses its
profitability ratio. It measures the assets used in a firm by controlling its expenses. Profitability
ratios are mostly used in the financial analysis. This ratio includes the margin of gross profit and
operating, return on assets, equity, sales and investment. It consist of various types such as:
Gross profit ratio: Gross profit/ Total sales *100
Net profit ratio: Net incomes / Total sales *100
Company Celcon telecom TM telecom
Gross profit ratio =21702/24402*100
=88.9%
=10165/12061*100
=84%
Net profit ratio =909/24402*100
=3.7%
=756/12061*100
= 6.26%
Market ratio: This ratio is used to evaluate whether stock of a company is overvalued,
undervalued or priced fairly. Thus, market ratios give an analysis on stock trends. Also, these
ratios are employed by current and potential investors. Through this, they can easily determine
whether shares of a company are under-priced or over-priced (Haddow, Bullock and Coppola,
2017). It consists of various types. Some of them are mention underneath:
EPS: Net income available to equity shareholders/ Number of shares
Payout ratio: Dividends per share / Earning per share
Company Celcon telecom TM telecom
Earning per share 0.1 0.21
Payout ratio 118.10% 99.1
Debt ratio: This ratio can be interpreted as the proportion of assets that are financially
debt in a company. If debt ratio of a company is wider, then it will generate a higher financial
risk. Also, company becomes more leveraged. Leverage is taken as a tool by a company in order
to find sustainable use for the debt.
Debt ratio: Total liabilities/ Total assets
Company Celcon telecom TM telecom
7
Paraphrase This Document
Need a fresh take? Get an instant paraphrase of this document with our AI Paraphraser
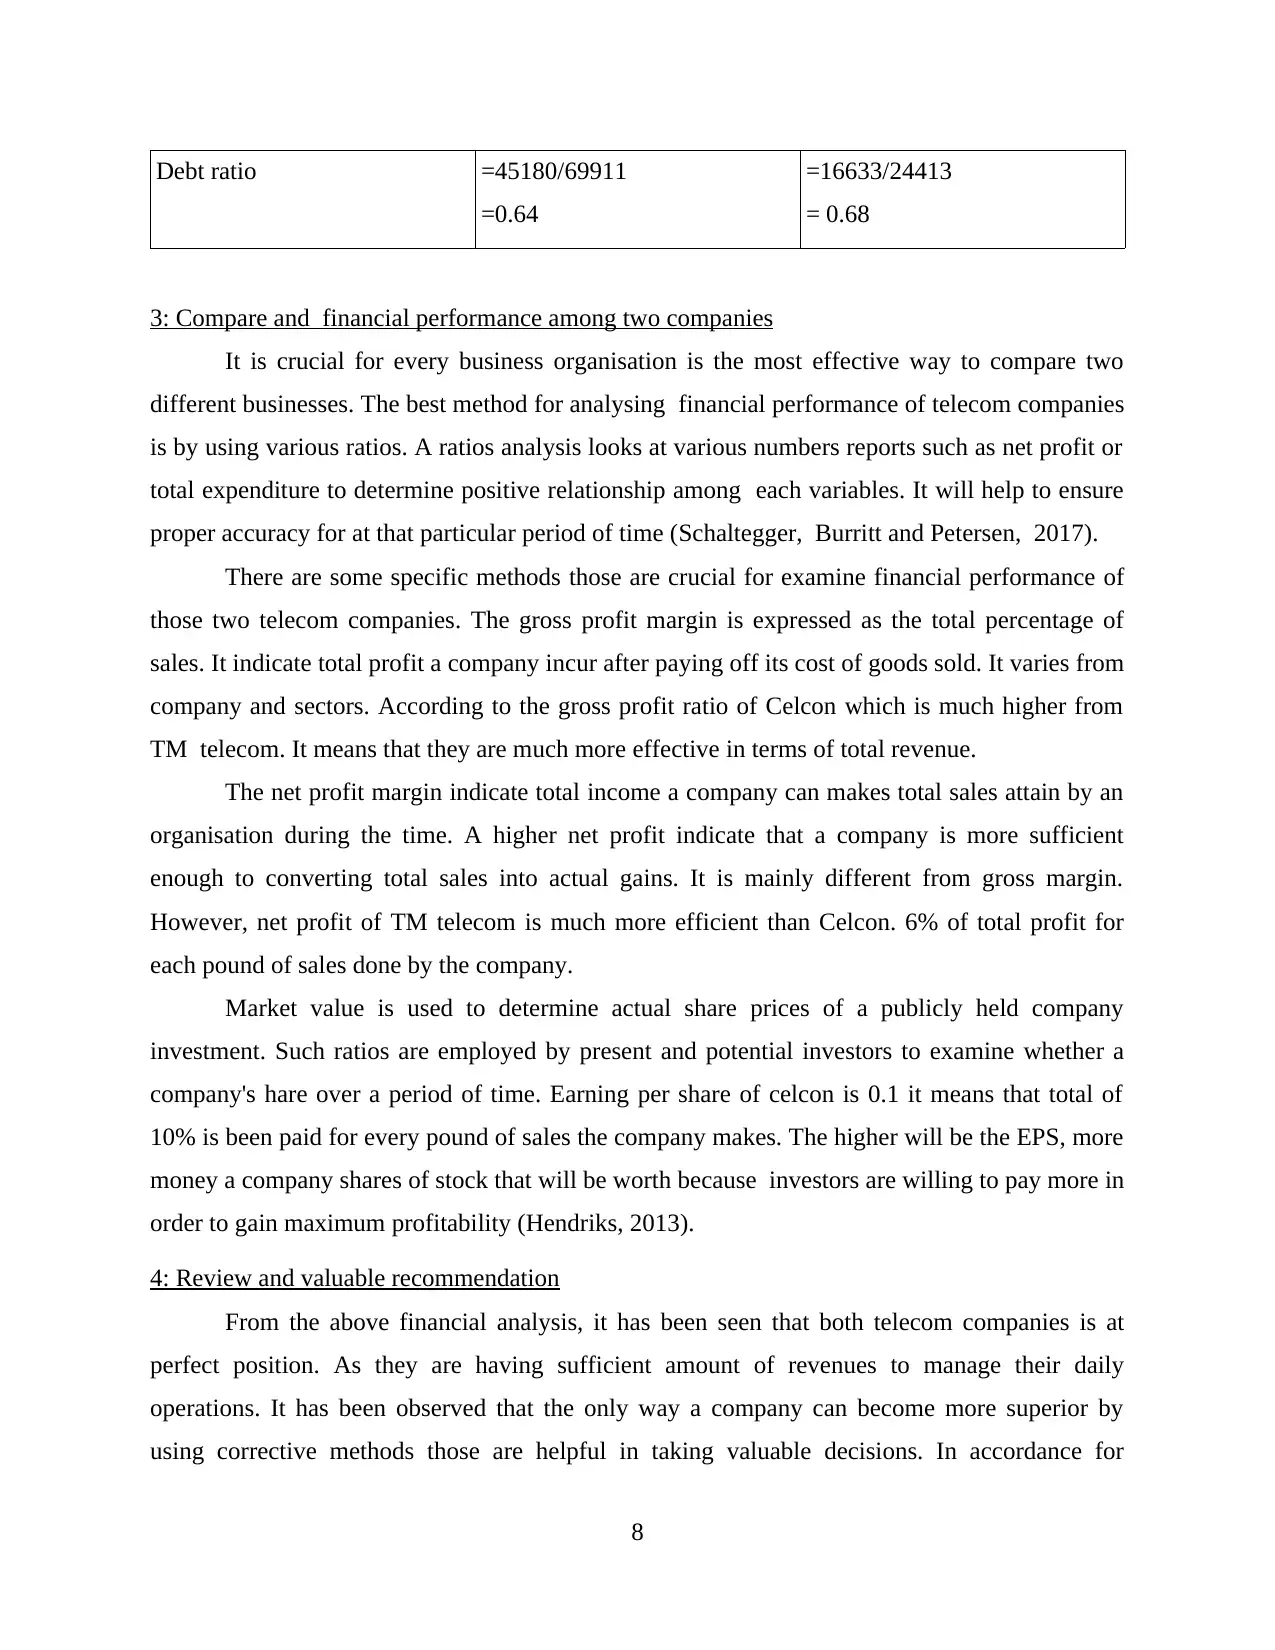
Debt ratio =45180/69911
=0.64
=16633/24413
= 0.68
3: Compare and financial performance among two companies
It is crucial for every business organisation is the most effective way to compare two
different businesses. The best method for analysing financial performance of telecom companies
is by using various ratios. A ratios analysis looks at various numbers reports such as net profit or
total expenditure to determine positive relationship among each variables. It will help to ensure
proper accuracy for at that particular period of time (Schaltegger, Burritt and Petersen, 2017).
There are some specific methods those are crucial for examine financial performance of
those two telecom companies. The gross profit margin is expressed as the total percentage of
sales. It indicate total profit a company incur after paying off its cost of goods sold. It varies from
company and sectors. According to the gross profit ratio of Celcon which is much higher from
TM telecom. It means that they are much more effective in terms of total revenue.
The net profit margin indicate total income a company can makes total sales attain by an
organisation during the time. A higher net profit indicate that a company is more sufficient
enough to converting total sales into actual gains. It is mainly different from gross margin.
However, net profit of TM telecom is much more efficient than Celcon. 6% of total profit for
each pound of sales done by the company.
Market value is used to determine actual share prices of a publicly held company
investment. Such ratios are employed by present and potential investors to examine whether a
company's hare over a period of time. Earning per share of celcon is 0.1 it means that total of
10% is been paid for every pound of sales the company makes. The higher will be the EPS, more
money a company shares of stock that will be worth because investors are willing to pay more in
order to gain maximum profitability (Hendriks, 2013).
4: Review and valuable recommendation
From the above financial analysis, it has been seen that both telecom companies is at
perfect position. As they are having sufficient amount of revenues to manage their daily
operations. It has been observed that the only way a company can become more superior by
using corrective methods those are helpful in taking valuable decisions. In accordance for
8
company to expand their business, they need to plan their every functions collectively to build an
output in excess of output generations.
Suggestion:
To improve financial performance of the company there are various measure that need to be
taken into consideration. Some of them are discuss underneath:
Continuous review about the process: It has been seen that operations affect every part
of the company. This needs to be rectify more quickly so that extra cost and expenses can
be controlled.
Assess financial performance: In small business it is more similar for employees to
become more relative to every manager and owners of the company. As company's wants
to grow their business operations so for this purpose they use to make better
understanding of financial positions of the company (Aebi, Sabato and Schmid, 2012).
CONCLUSION
From the above project report, it has been concluded that financial management helps an
organisation to analyse its current position. For this purpose they use to evaluate various
statements such as income, balance sheet and cash flow statement. The best ways to get better
results is by using financial ratios. The overall project is providing crucial information about
performance of selected company whether they are well enough to make use of their business
operations in an effective manner. There primary motive is to become more reliable and
sufficient enough in telecommunication industries.
9
⊘ This is a preview!⊘
Do you want full access?
Subscribe today to unlock all pages.
Trusted by 1+ million students worldwide
REFERENCES
Books and journals:
Brigham, E. F. and Houston, J. F., 2012. Fundamentals of financial management. Cengage
Learning.
Chandra, P., 2011. Financial management. Tata McGraw-Hill Education.
Higgins, R. C., 2012. Analysis for financial management. McGraw-Hill/Irwin.
Hull, J., 2012. Risk management and financial institutions,+ Web Site (Vol. 733). John Wiley &
Sons.
Willcocks, L., 2013. Information management: the evaluation of information systems
investments. Springer.
Haddow, G., Bullock, J. and Coppola, D. P., 2017. Introduction to emergency management.
Butterworth-Heinemann.
Schaltegger, S., Burritt, R. and Petersen, H., 2017. An introduction to corporate environmental
management: Striving for sustainability. Routledge.
Hendriks, C. J., 2013. Integrated Financial Management Information Systems: Guidelines for
effective implementation by the public sector of South Africa. South African Journal of
Information Management. 15(1). pp.1-9.
Aebi, V., Sabato, G. and Schmid, M., 2012. Risk management, corporate governance, and bank
performance in the financial crisis. Journal of Banking & Finance. 36(12). pp.3213-
3226.
Online
TM annual report. 2016.[Online]. Available through:
<https://www.tm.com.my/annualreport/2016/#/2016-highlights>.
10
Paraphrase This Document
Need a fresh take? Get an instant paraphrase of this document with our AI Paraphraser
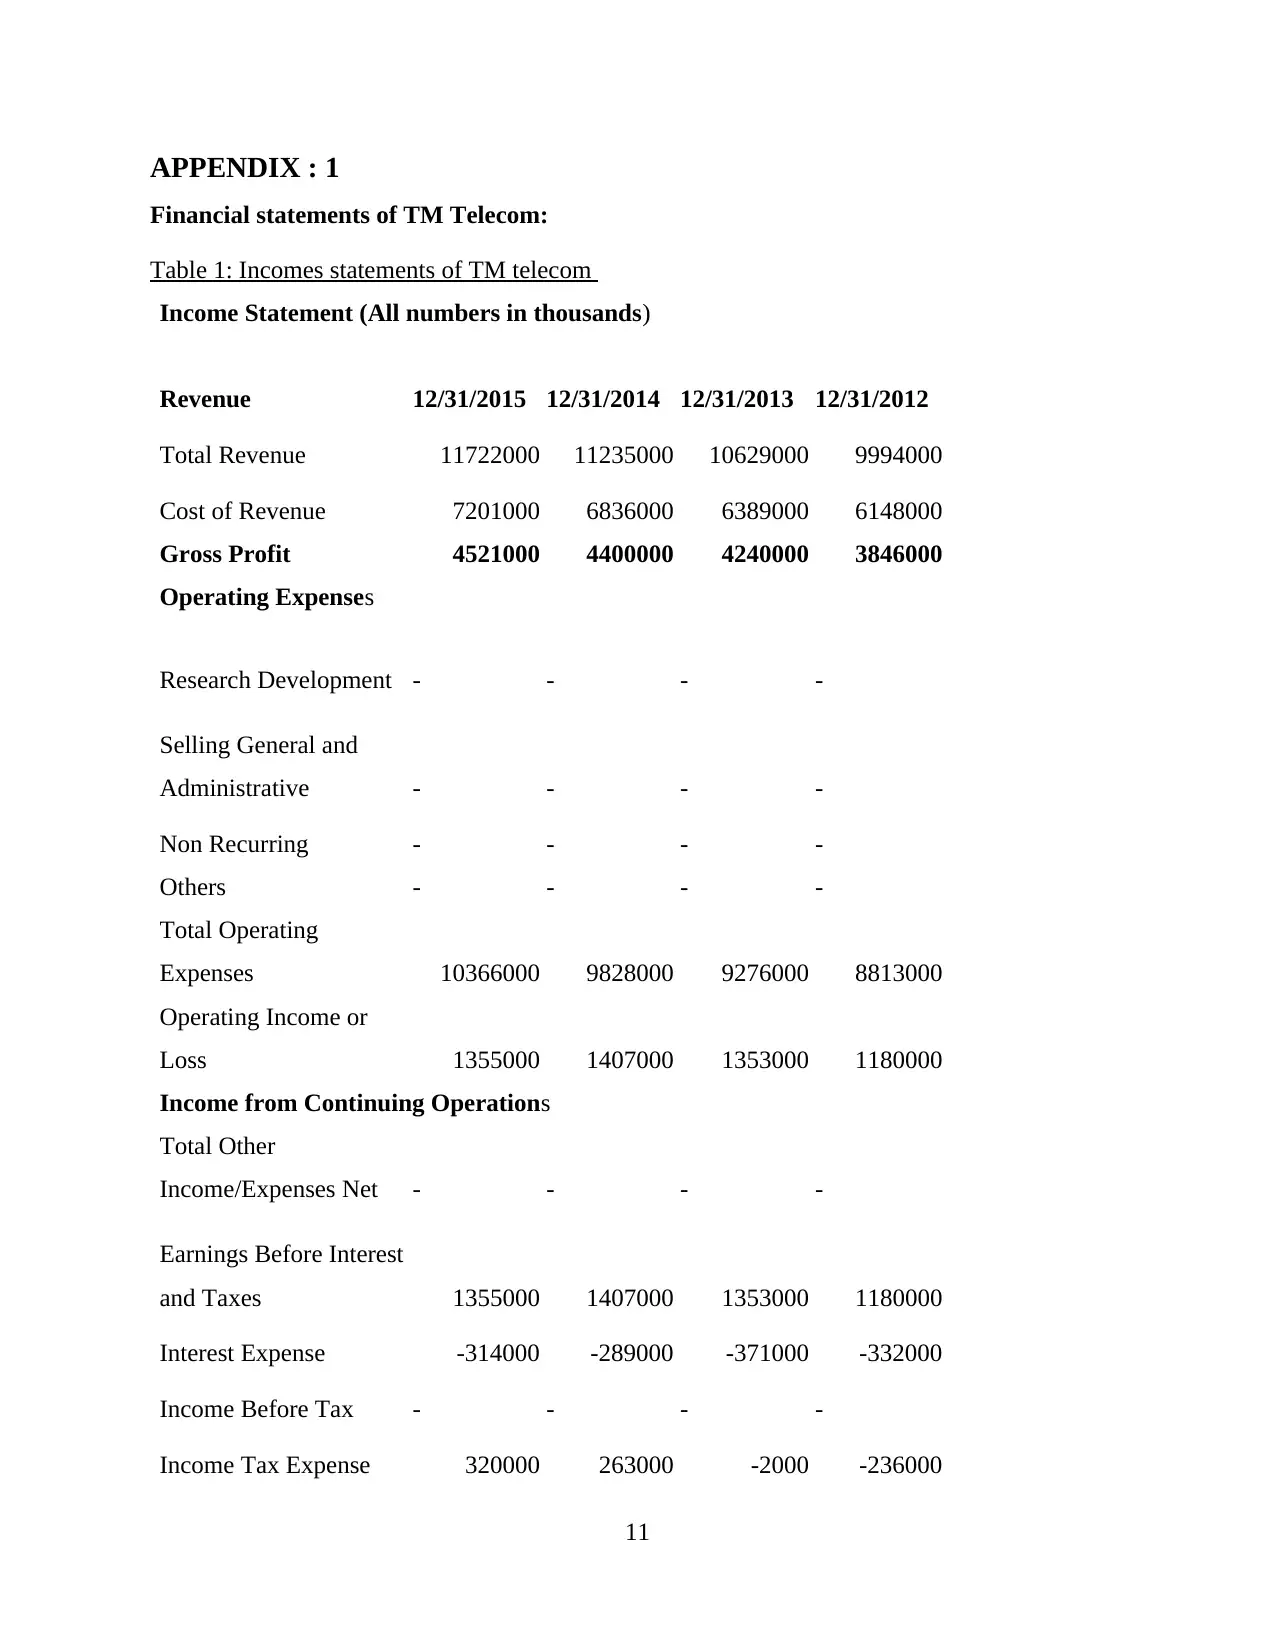
APPENDIX : 1
Financial statements of TM Telecom:
Table 1: Incomes statements of TM telecom
Income Statement (All numbers in thousands)
Revenue 12/31/2015 12/31/2014 12/31/2013 12/31/2012
Total Revenue 11722000 11235000 10629000 9994000
Cost of Revenue 7201000 6836000 6389000 6148000
Gross Profit 4521000 4400000 4240000 3846000
Operating Expenses
Research Development - - - -
Selling General and
Administrative - - - -
Non Recurring - - - -
Others - - - -
Total Operating
Expenses 10366000 9828000 9276000 8813000
Operating Income or
Loss 1355000 1407000 1353000 1180000
Income from Continuing Operations
Total Other
Income/Expenses Net - - - -
Earnings Before Interest
and Taxes 1355000 1407000 1353000 1180000
Interest Expense -314000 -289000 -371000 -332000
Income Before Tax - - - -
Income Tax Expense 320000 263000 -2000 -236000
11
Minority Interest - - - -
Net Income From
Continuing Ops - - - -
Non-recurring Events
Discontinued
Operations - - - -
Extraordinary Items - - - -
Effect Of Accounting
Changes - - - -
Other Items - - - -
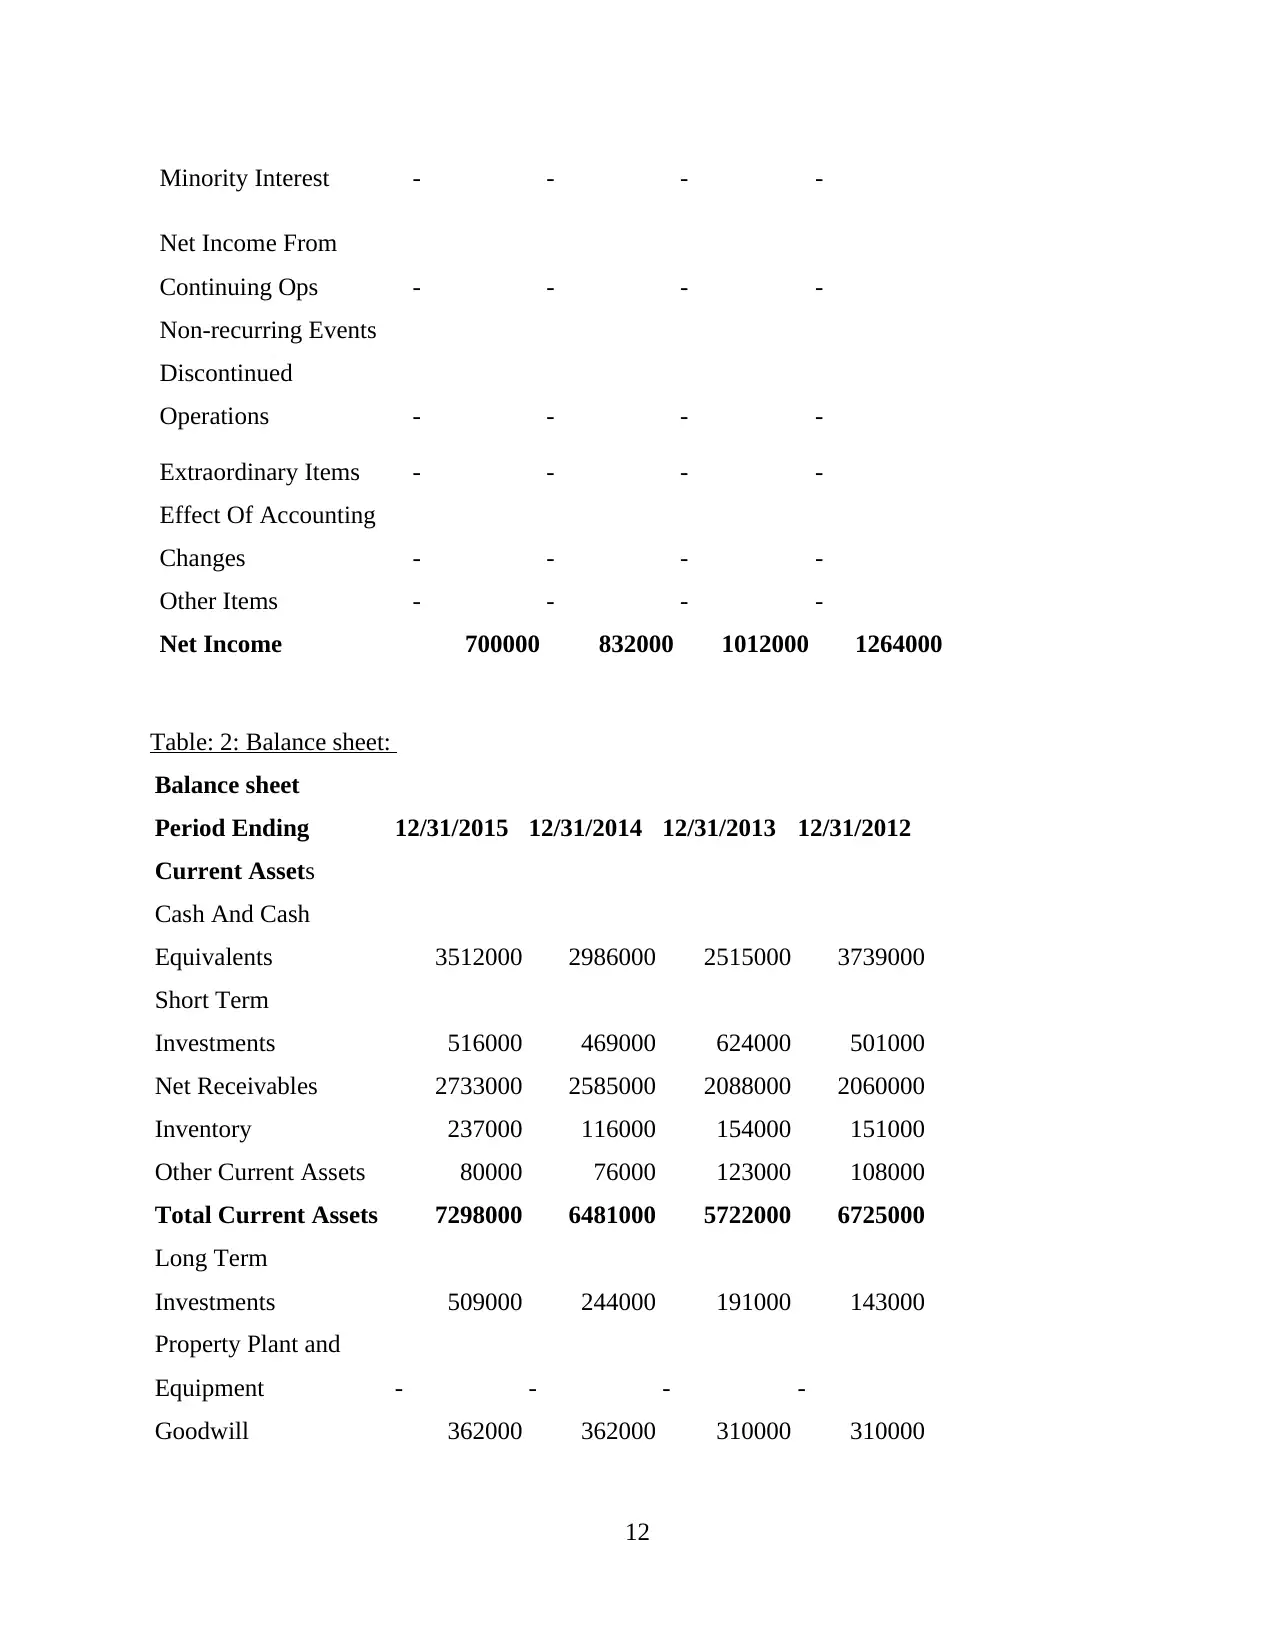
Net Income 700000 832000 1012000 1264000
Table: 2: Balance sheet:
Balance sheet
Period Ending 12/31/2015 12/31/2014 12/31/2013 12/31/2012
Current Assets
Cash And Cash
Equivalents 3512000 2986000 2515000 3739000
Short Term
Investments 516000 469000 624000 501000
Net Receivables 2733000 2585000 2088000 2060000
Inventory 237000 116000 154000 151000
Other Current Assets 80000 76000 123000 108000
Total Current Assets 7298000 6481000 5722000 6725000
Long Term
Investments 509000 244000 191000 143000
Property Plant and
Equipment - - - -
Goodwill 362000 362000 310000 310000
12
Net Income From
Continuing Ops - - - -
Non-recurring Events
Discontinued
Operations - - - -
Extraordinary Items - - - -
Effect Of Accounting
Changes - - - -
Other Items - - - -
Net Income 700000 832000 1012000 1264000
Table: 2: Balance sheet:
Balance sheet
Period Ending 12/31/2015 12/31/2014 12/31/2013 12/31/2012
Current Assets
Cash And Cash
Equivalents 3512000 2986000 2515000 3739000
Short Term
Investments 516000 469000 624000 501000
Net Receivables 2733000 2585000 2088000 2060000
Inventory 237000 116000 154000 151000
Other Current Assets 80000 76000 123000 108000
Total Current Assets 7298000 6481000 5722000 6725000
Long Term
Investments 509000 244000 191000 143000
Property Plant and
Equipment - - - -
Goodwill 362000 362000 310000 310000
12
⊘ This is a preview!⊘
Do you want full access?
Subscribe today to unlock all pages.
Trusted by 1+ million students worldwide
1 out of 17
Related Documents


Your All-in-One AI-Powered Toolkit for Academic Success.
+13062052269
info@desklib.com
Available 24*7 on WhatsApp / Email
![[object Object]](/_next/static/media/star-bottom.7253800d.svg)
Unlock your academic potential
Copyright © 2020–2026 A2Z Services. All Rights Reserved. Developed and managed by ZUCOL.