Financial Analysis and Economic Review of Associated British Foods
VerifiedAdded on 2022/08/28
|26
|5656
|48
Report
AI Summary
This report presents a comprehensive financial analysis of Associated British Foods (ABF), examining its financial performance, position, and reporting. The analysis includes a review of key financial ratios such as net profit margin, return on assets, current ratio, quick ratio, asset turnover, gearing ratio, and leverage ratio, along with DuPont analysis and Altman Z-score. The report evaluates ABF's market perception and stock market performance, considering both microeconomic and macroeconomic environments. It discusses foreign currency translation and financial instruments relevant to ABF's operations. The findings indicate a decrease in ABF's financial performance over the years, as reflected in the movement of share prices compared to industrial performance. The report concludes with a detailed assessment of the company's financial health and provides recommendations based on the analysis.
Running Head: ACCOUNTING AND ECONOMICS FOR DECISION MAKING
ACCOUNTING AND ECONOMICS FOR DECISION MAKING
Name of the Student
Name of the University
Author Note
ACCOUNTING AND ECONOMICS FOR DECISION MAKING
Name of the Student
Name of the University
Author Note
Paraphrase This Document
Need a fresh take? Get an instant paraphrase of this document with our AI Paraphraser
1ACCOUNTING AND ECONOMICS FOR DECISION MAKING
Executive Summary
Financial analysis is the practice of examining entity’s performance in context of its
economic and industry environment for arriving at recommendations or decisions. The main
focus of the financial analysis is evaluation of ability of entity for earning return on its
capital, which is equal to the cost of capital for profitably growing of its operations as well as
for generating sufficient cash for pursuing opportunities and meeting obligations. Further,
this assignment aims to prepare analytical review of financial position, reporting and position
of the Associated British Foods Plc. Moreover, it also aims to discuss microeconomic and
macroeconomic aspects of company. Hence, this report concludes that financial analysis of
ABF is decreased over years. The movements of share price shows that company’s
performance of shares has been decreased over years compared to industrial performance.
2ACCOUNTING AND ECONOMICS FOR DECISION MAKING
Table of Contents
Introduction................................................................................................................................3
Background of Company.......................................................................................................3
Discussion..................................................................................................................................4
Analytical Review of Financial Performance, Position and Reporting.................................4
Market Perception of Company.......................................................................................12
Stock Market Performance Indicators..............................................................................14
Microeconomic and Macroeconomic Environment of Company’s Operations..................15
Microeconomic Environment...........................................................................................15
Macroeconomic Environment..........................................................................................17
Foreign Currency Translation..........................................................................................18
Financial Instruments.......................................................................................................18
Conclusion................................................................................................................................20
Reference..................................................................................................................................22
⊘ This is a preview!⊘
Do you want full access?
Subscribe today to unlock all pages.
Trusted by 1+ million students worldwide
3ACCOUNTING AND ECONOMICS FOR DECISION MAKING
Introduction
Financial analysis is systematic procedure of examining or analyzing company’s
financial information for reaching at the decision-making of business. People in organization
examine how much solvent, stable and profitable the business or any project is and these
assessments are being carried out by the examination of profit & loss statement, statement of
cash flow and balance sheet of entity. After the assessment of firm’s performance by using
financial data, findings are presented to the top management of company with
recommendations regarding their improvement in future. The most commonly used
techniques of financial analysis include vertical analysis, horizontal analysis, trend analysis,
liquidity analysis, turnover analysis, stability analysis, stability analysis, business risk
analysis, financial risk analysis and others (Williams and Dobelman 2017).
For any of the financial professional, it becomes vital for knowing how effectively
firm’s financial statements are analyzed. It requires good understanding of three major key
areas, which are financial statements structures, economic characteristics of industry in which
company operates and firms makes strategies for differentiating itself from that of its
competitors. Further, economic decision-making is process of making the decision that
involves money. All the economic decisions require using of certain sort of information of
the accounting, often in financial reports form (Buvaneswari and Lakshmi 2015). Hence, this
report aims to prepare analytical review of financial position, reporting and position with the
help of financial statements. Further, this repot also includes detailed assessment of
macroeconomic environment within Associated British Foods and microeconomic aspects of
firm’s operations. Lastly, conclusion will be given based on the analysis of company.
Paraphrase This Document
Need a fresh take? Get an instant paraphrase of this document with our AI Paraphraser
4ACCOUNTING AND ECONOMICS FOR DECISION MAKING
Background of Company
Associated British Foods is the diversified international food, retail groups,
ingredients with the sale of its product around £15.6bn. The operations of the company is in
fifty countries all across Australia, Asia, Southern Africa, Europe and the American. The
total employees of company is around 137,000. ABF is British retailing and multinational
food processing entity, which is having it’s headquarter in London, United Kingdom. The
company’s division of ingredients is second largest producer of the world of both the sugar as
well as baker’s yeast and largest producer of the other ingredients, consisting of enzymes,
lactose and emulsifiers. The entity’s division of grocery is the key manufacturer of the
branded as well as private label grocery items and it is consists of brands such as Twinings,
Jordans, Ryvita, Ovaltine and Mazola. The retail division of company, Primark is having 200
stores, which is over 6,500,000 sq. ft. of the selling space all across UK, Spain, Portugal,
Ireland, Germany and Netherlands. ABF is being listed on London Stock Exchange. In
addition, it is constituents of FTSE 100 Index (Abf.co.uk. 2020).
Discussion
Analytical Review of Financial Performance, Position and Reporting
ABF is the largest cap worth entity of UK£20b. The investors watch this company as
stronger and reliable investment of stock. Most of the investors favors big stocks because of
their higher market liquidity and stronger balance sheet. The ratios have been calculated,
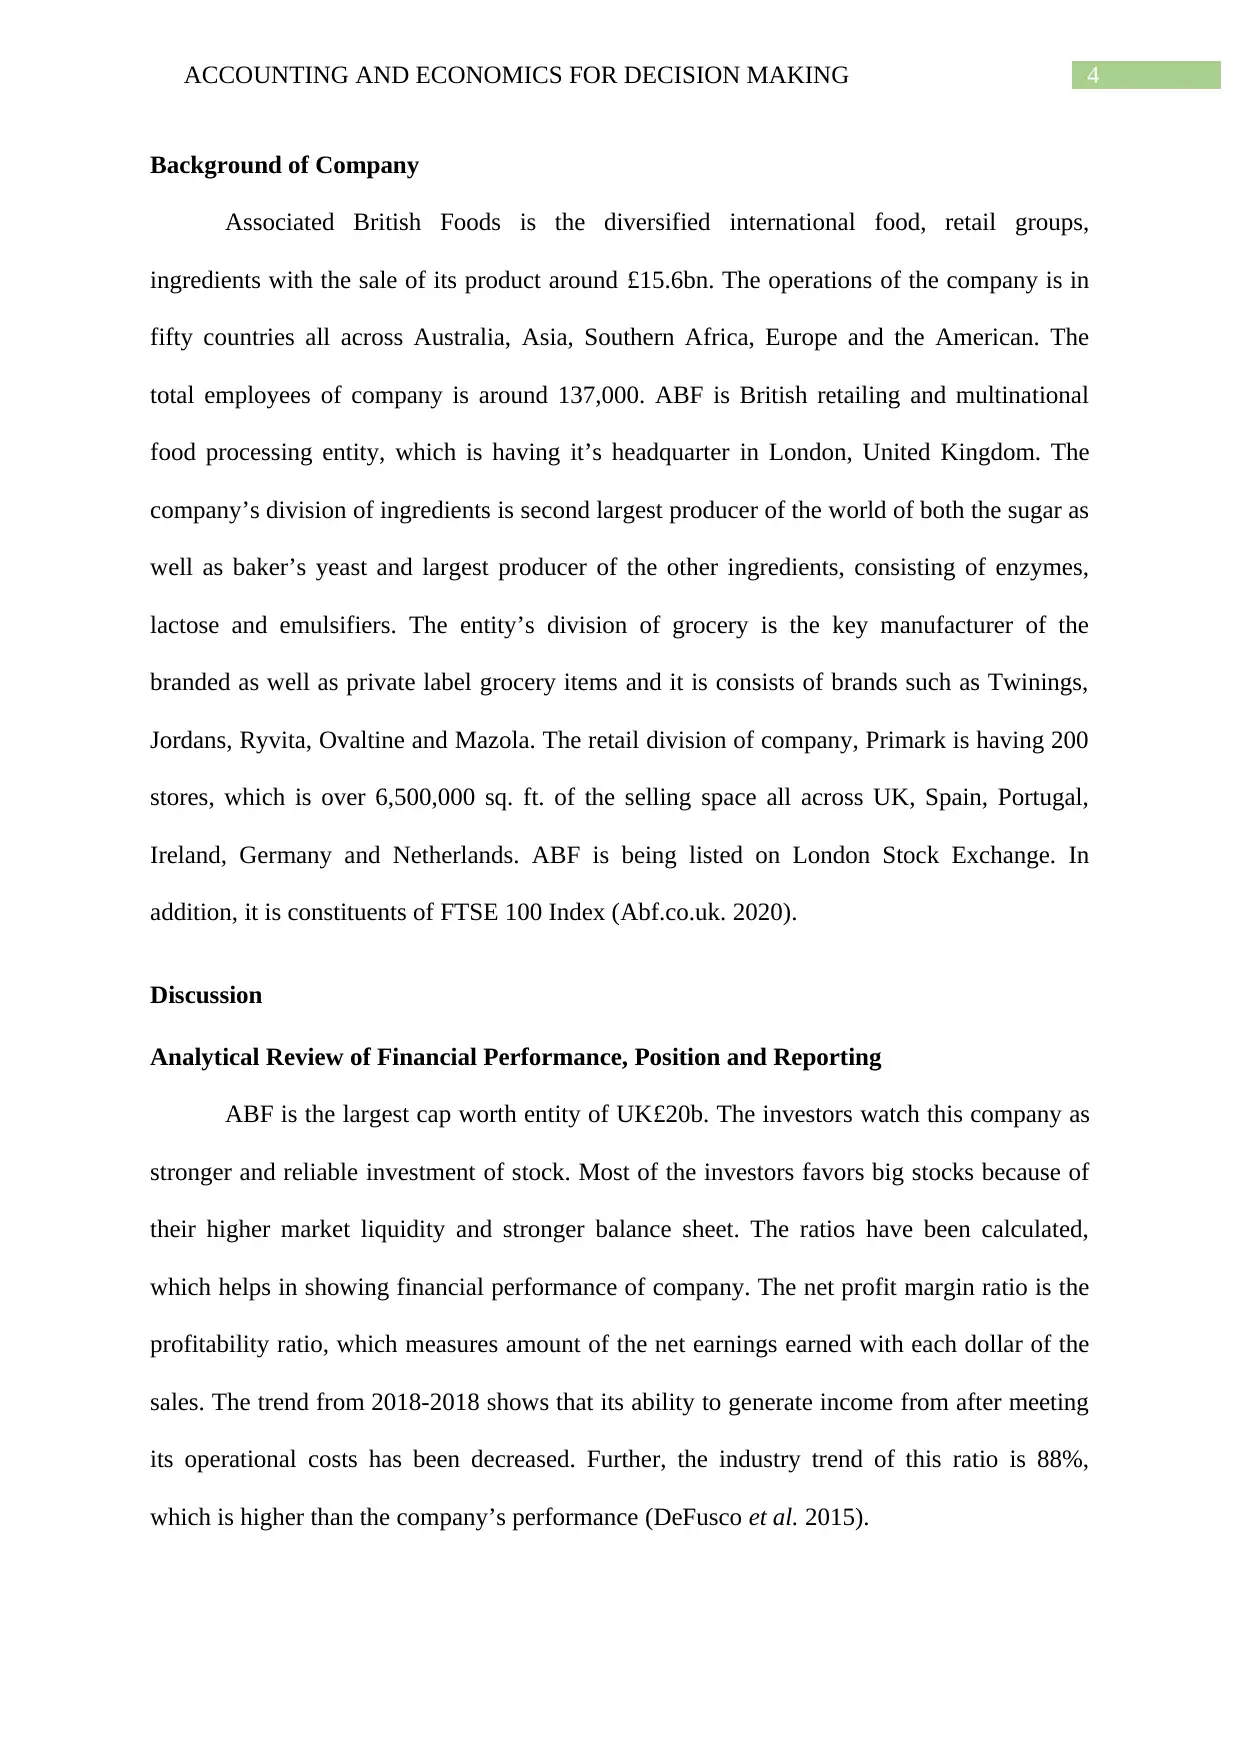
which helps in showing financial performance of company. The net profit margin ratio is the
profitability ratio, which measures amount of the net earnings earned with each dollar of the
sales. The trend from 2018-2018 shows that its ability to generate income from after meeting
its operational costs has been decreased. Further, the industry trend of this ratio is 88%,
which is higher than the company’s performance (DeFusco et al. 2015).
Background of Company
Associated British Foods is the diversified international food, retail groups,
ingredients with the sale of its product around £15.6bn. The operations of the company is in
fifty countries all across Australia, Asia, Southern Africa, Europe and the American. The
total employees of company is around 137,000. ABF is British retailing and multinational
food processing entity, which is having it’s headquarter in London, United Kingdom. The
company’s division of ingredients is second largest producer of the world of both the sugar as
well as baker’s yeast and largest producer of the other ingredients, consisting of enzymes,
lactose and emulsifiers. The entity’s division of grocery is the key manufacturer of the
branded as well as private label grocery items and it is consists of brands such as Twinings,
Jordans, Ryvita, Ovaltine and Mazola. The retail division of company, Primark is having 200
stores, which is over 6,500,000 sq. ft. of the selling space all across UK, Spain, Portugal,
Ireland, Germany and Netherlands. ABF is being listed on London Stock Exchange. In
addition, it is constituents of FTSE 100 Index (Abf.co.uk. 2020).
Discussion
Analytical Review of Financial Performance, Position and Reporting
ABF is the largest cap worth entity of UK£20b. The investors watch this company as
stronger and reliable investment of stock. Most of the investors favors big stocks because of
their higher market liquidity and stronger balance sheet. The ratios have been calculated,
which helps in showing financial performance of company. The net profit margin ratio is the
profitability ratio, which measures amount of the net earnings earned with each dollar of the
sales. The trend from 2018-2018 shows that its ability to generate income from after meeting
its operational costs has been decreased. Further, the industry trend of this ratio is 88%,
which is higher than the company’s performance (DeFusco et al. 2015).
5ACCOUNTING AND ECONOMICS FOR DECISION MAKING
Chart 1: Net Profit Margin Ratio
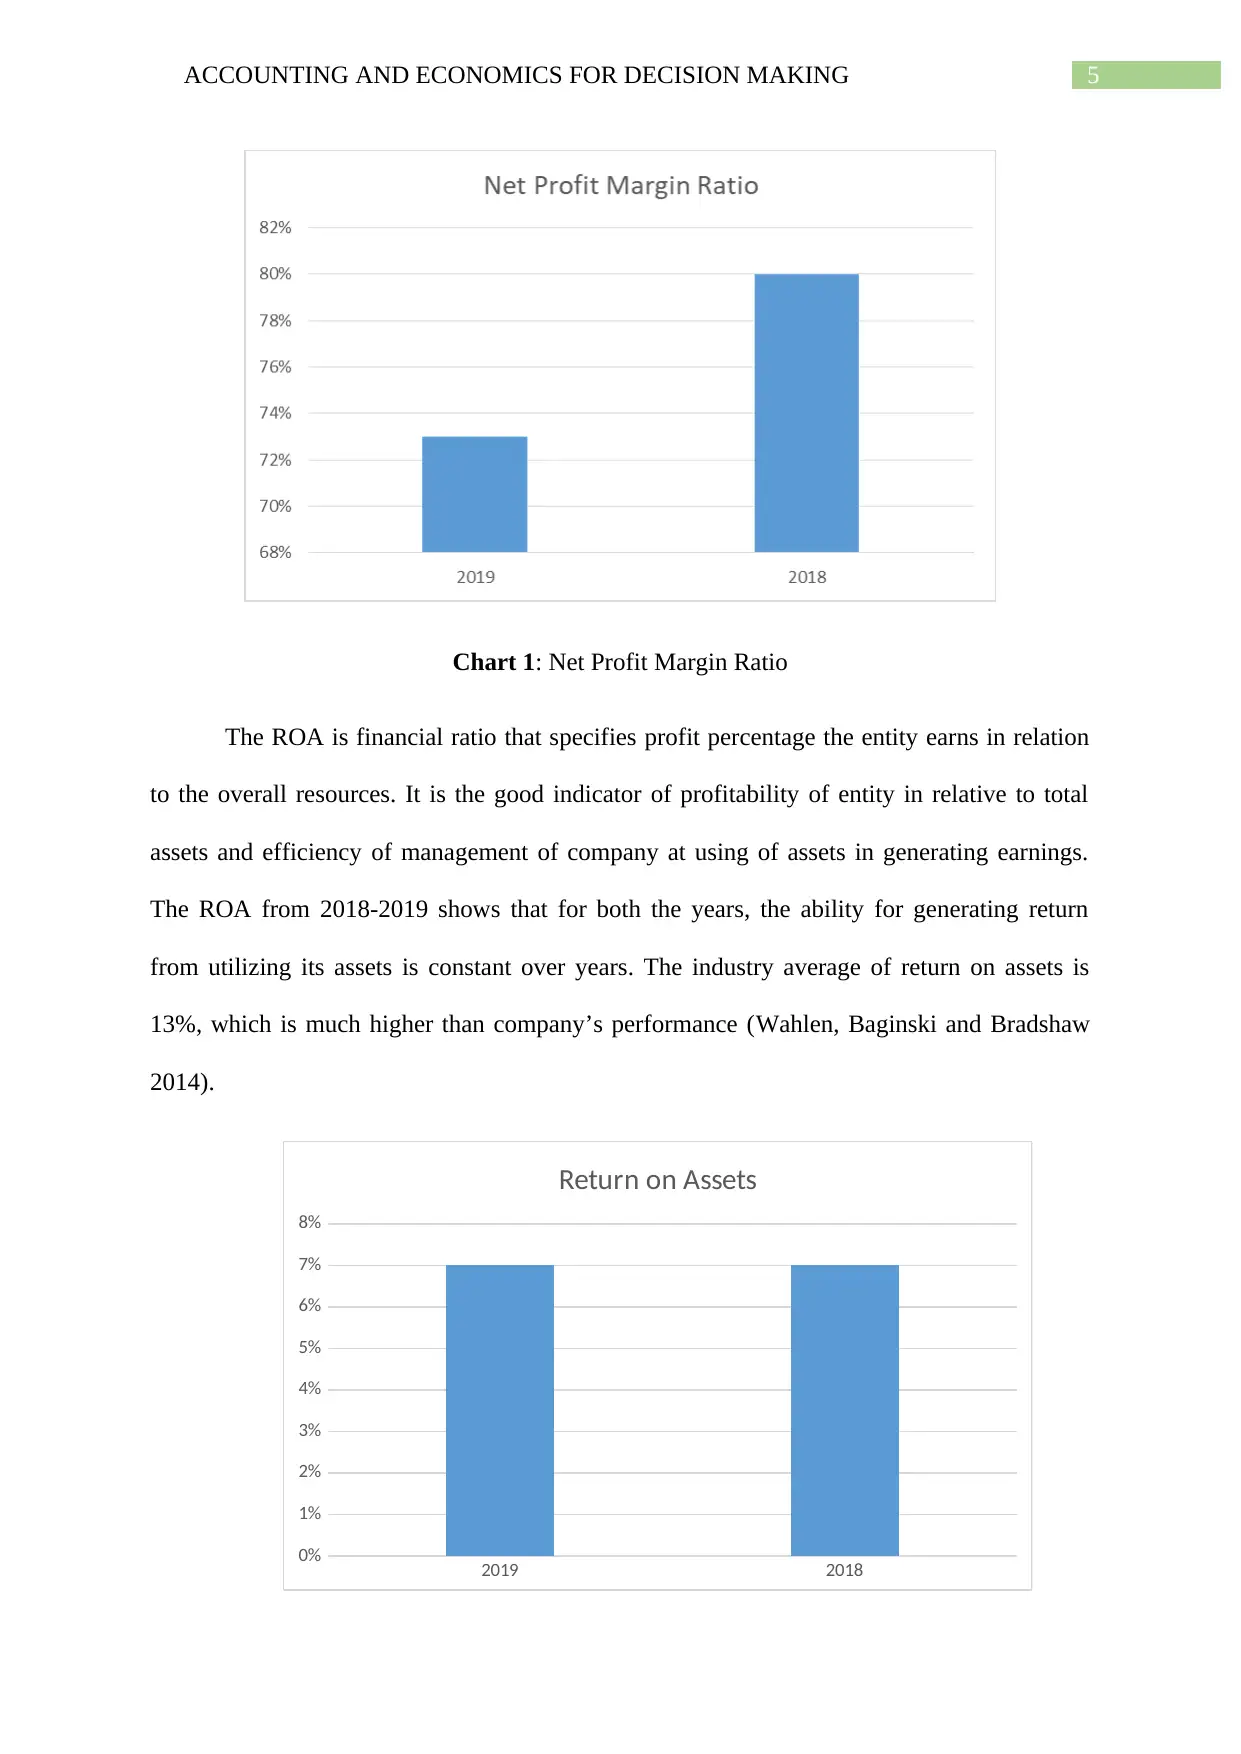
The ROA is financial ratio that specifies profit percentage the entity earns in relation
to the overall resources. It is the good indicator of profitability of entity in relative to total
assets and efficiency of management of company at using of assets in generating earnings.
The ROA from 2018-2019 shows that for both the years, the ability for generating return
from utilizing its assets is constant over years. The industry average of return on assets is
13%, which is much higher than company’s performance (Wahlen, Baginski and Bradshaw
2014).
2019 2018
0%
1%
2%
3%
4%
5%
6%
7%
8%
Return on Assets
Chart 1: Net Profit Margin Ratio
The ROA is financial ratio that specifies profit percentage the entity earns in relation
to the overall resources. It is the good indicator of profitability of entity in relative to total
assets and efficiency of management of company at using of assets in generating earnings.
The ROA from 2018-2019 shows that for both the years, the ability for generating return
from utilizing its assets is constant over years. The industry average of return on assets is
13%, which is much higher than company’s performance (Wahlen, Baginski and Bradshaw
2014).
2019 2018
0%
1%
2%
3%
4%
5%
6%
7%
8%
Return on Assets
⊘ This is a preview!⊘
Do you want full access?
Subscribe today to unlock all pages.
Trusted by 1+ million students worldwide
6ACCOUNTING AND ECONOMICS FOR DECISION MAKING
Chart 2: Return on Assets Ratio
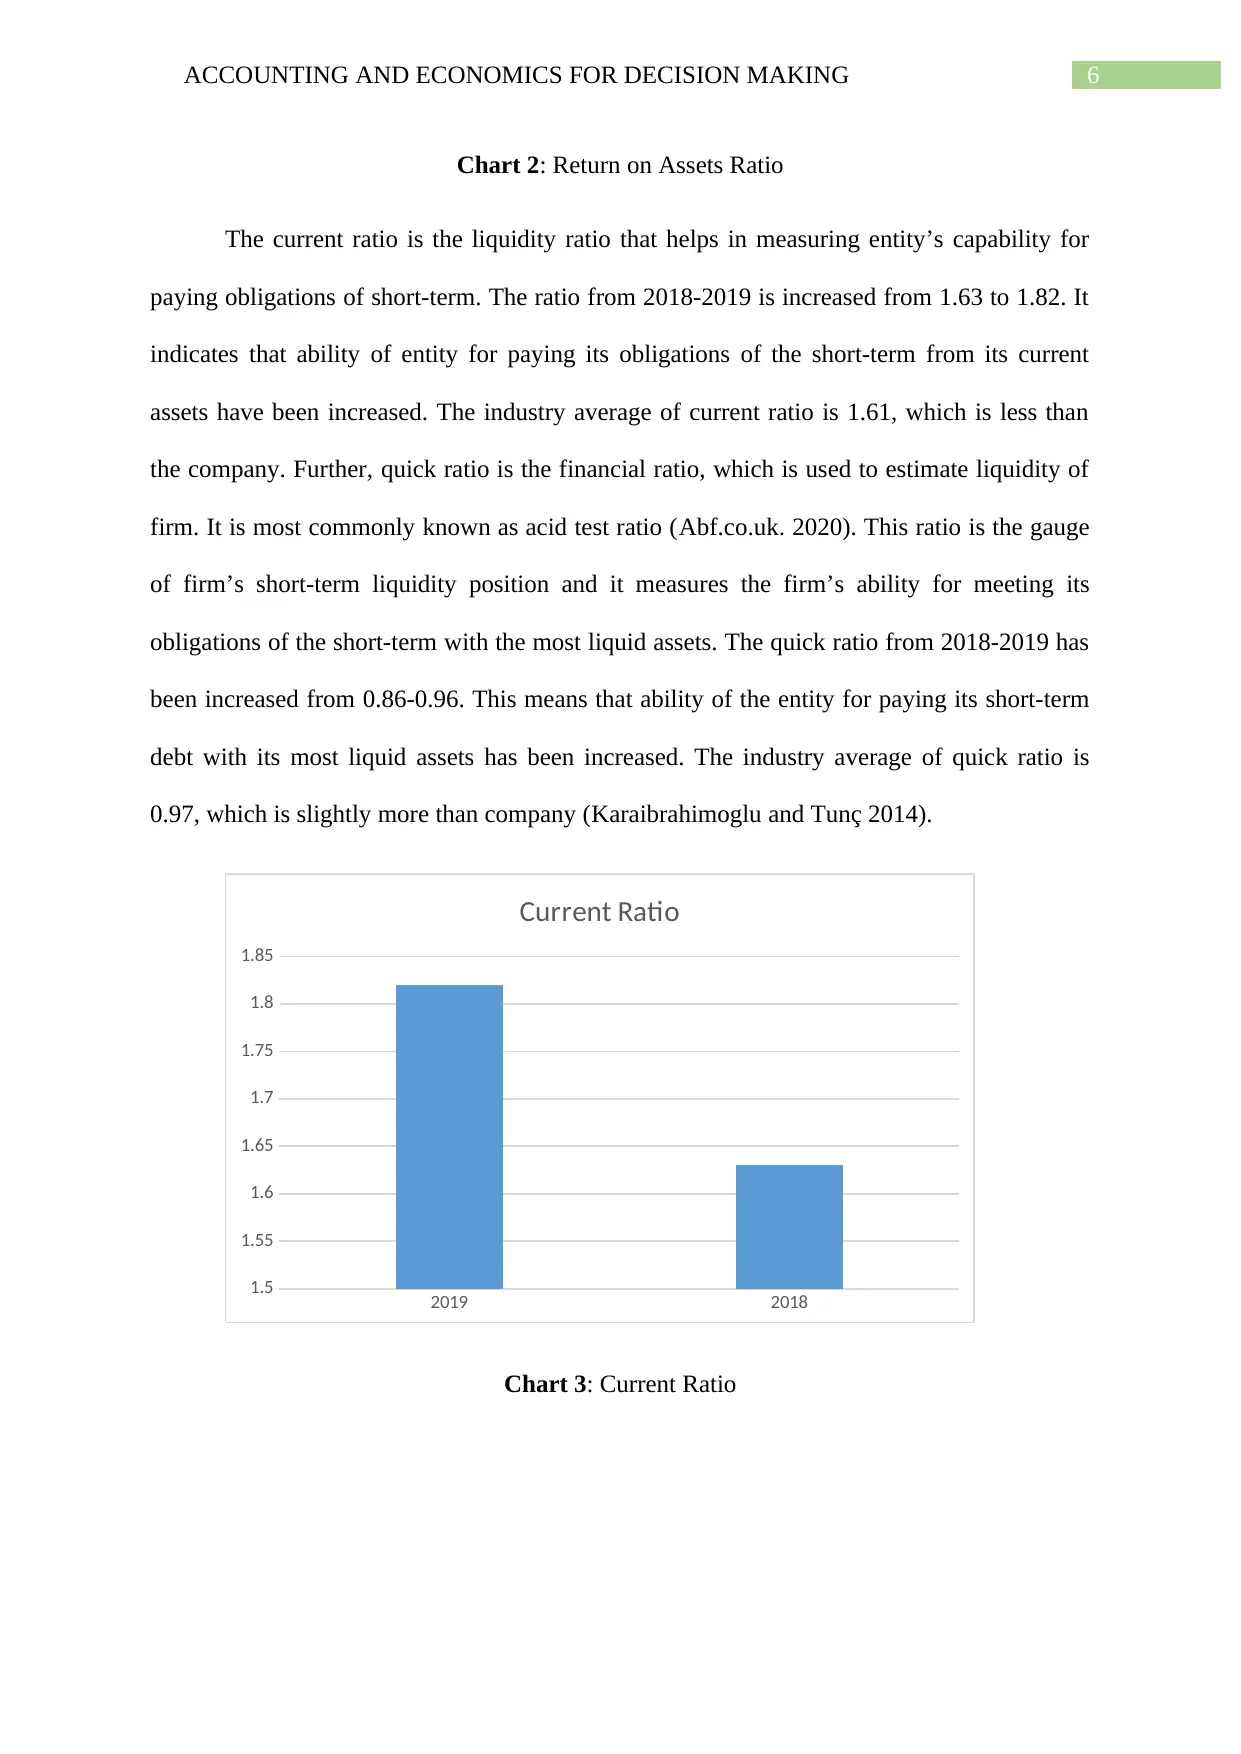
The current ratio is the liquidity ratio that helps in measuring entity’s capability for
paying obligations of short-term. The ratio from 2018-2019 is increased from 1.63 to 1.82. It
indicates that ability of entity for paying its obligations of the short-term from its current
assets have been increased. The industry average of current ratio is 1.61, which is less than
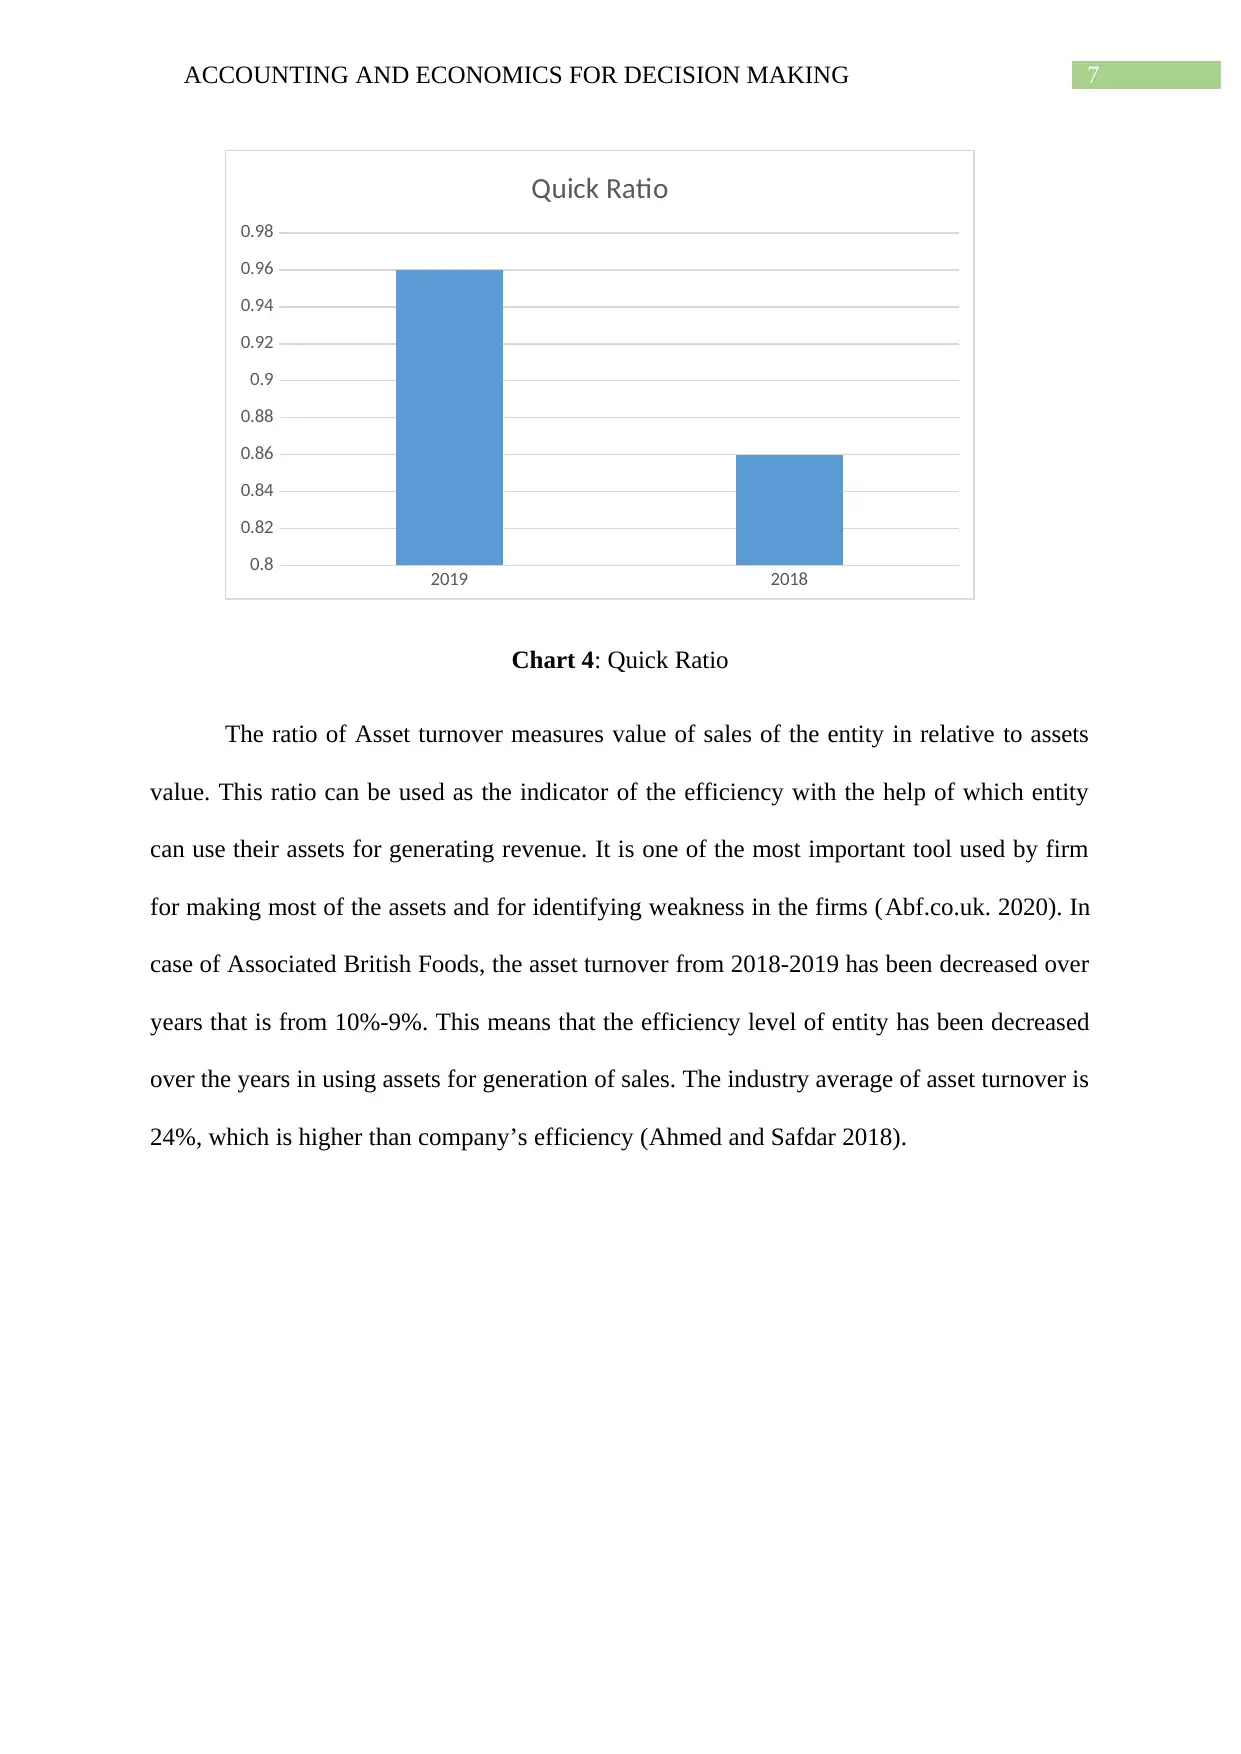
the company. Further, quick ratio is the financial ratio, which is used to estimate liquidity of
firm. It is most commonly known as acid test ratio (Abf.co.uk. 2020). This ratio is the gauge
of firm’s short-term liquidity position and it measures the firm’s ability for meeting its
obligations of the short-term with the most liquid assets. The quick ratio from 2018-2019 has
been increased from 0.86-0.96. This means that ability of the entity for paying its short-term
debt with its most liquid assets has been increased. The industry average of quick ratio is
0.97, which is slightly more than company (Karaibrahimoglu and Tunç 2014).
2019 2018
1.5
1.55
1.6
1.65
1.7
1.75
1.8
1.85
Current Ratio
Chart 3: Current Ratio
Chart 2: Return on Assets Ratio
The current ratio is the liquidity ratio that helps in measuring entity’s capability for
paying obligations of short-term. The ratio from 2018-2019 is increased from 1.63 to 1.82. It
indicates that ability of entity for paying its obligations of the short-term from its current
assets have been increased. The industry average of current ratio is 1.61, which is less than
the company. Further, quick ratio is the financial ratio, which is used to estimate liquidity of
firm. It is most commonly known as acid test ratio (Abf.co.uk. 2020). This ratio is the gauge
of firm’s short-term liquidity position and it measures the firm’s ability for meeting its
obligations of the short-term with the most liquid assets. The quick ratio from 2018-2019 has
been increased from 0.86-0.96. This means that ability of the entity for paying its short-term
debt with its most liquid assets has been increased. The industry average of quick ratio is
0.97, which is slightly more than company (Karaibrahimoglu and Tunç 2014).
2019 2018
1.5
1.55
1.6
1.65
1.7
1.75
1.8
1.85
Current Ratio
Chart 3: Current Ratio
Paraphrase This Document
Need a fresh take? Get an instant paraphrase of this document with our AI Paraphraser
7ACCOUNTING AND ECONOMICS FOR DECISION MAKING
2019 2018
0.8
0.82
0.84
0.86
0.88
0.9
0.92
0.94
0.96
0.98
Quick Ratio
Chart 4: Quick Ratio
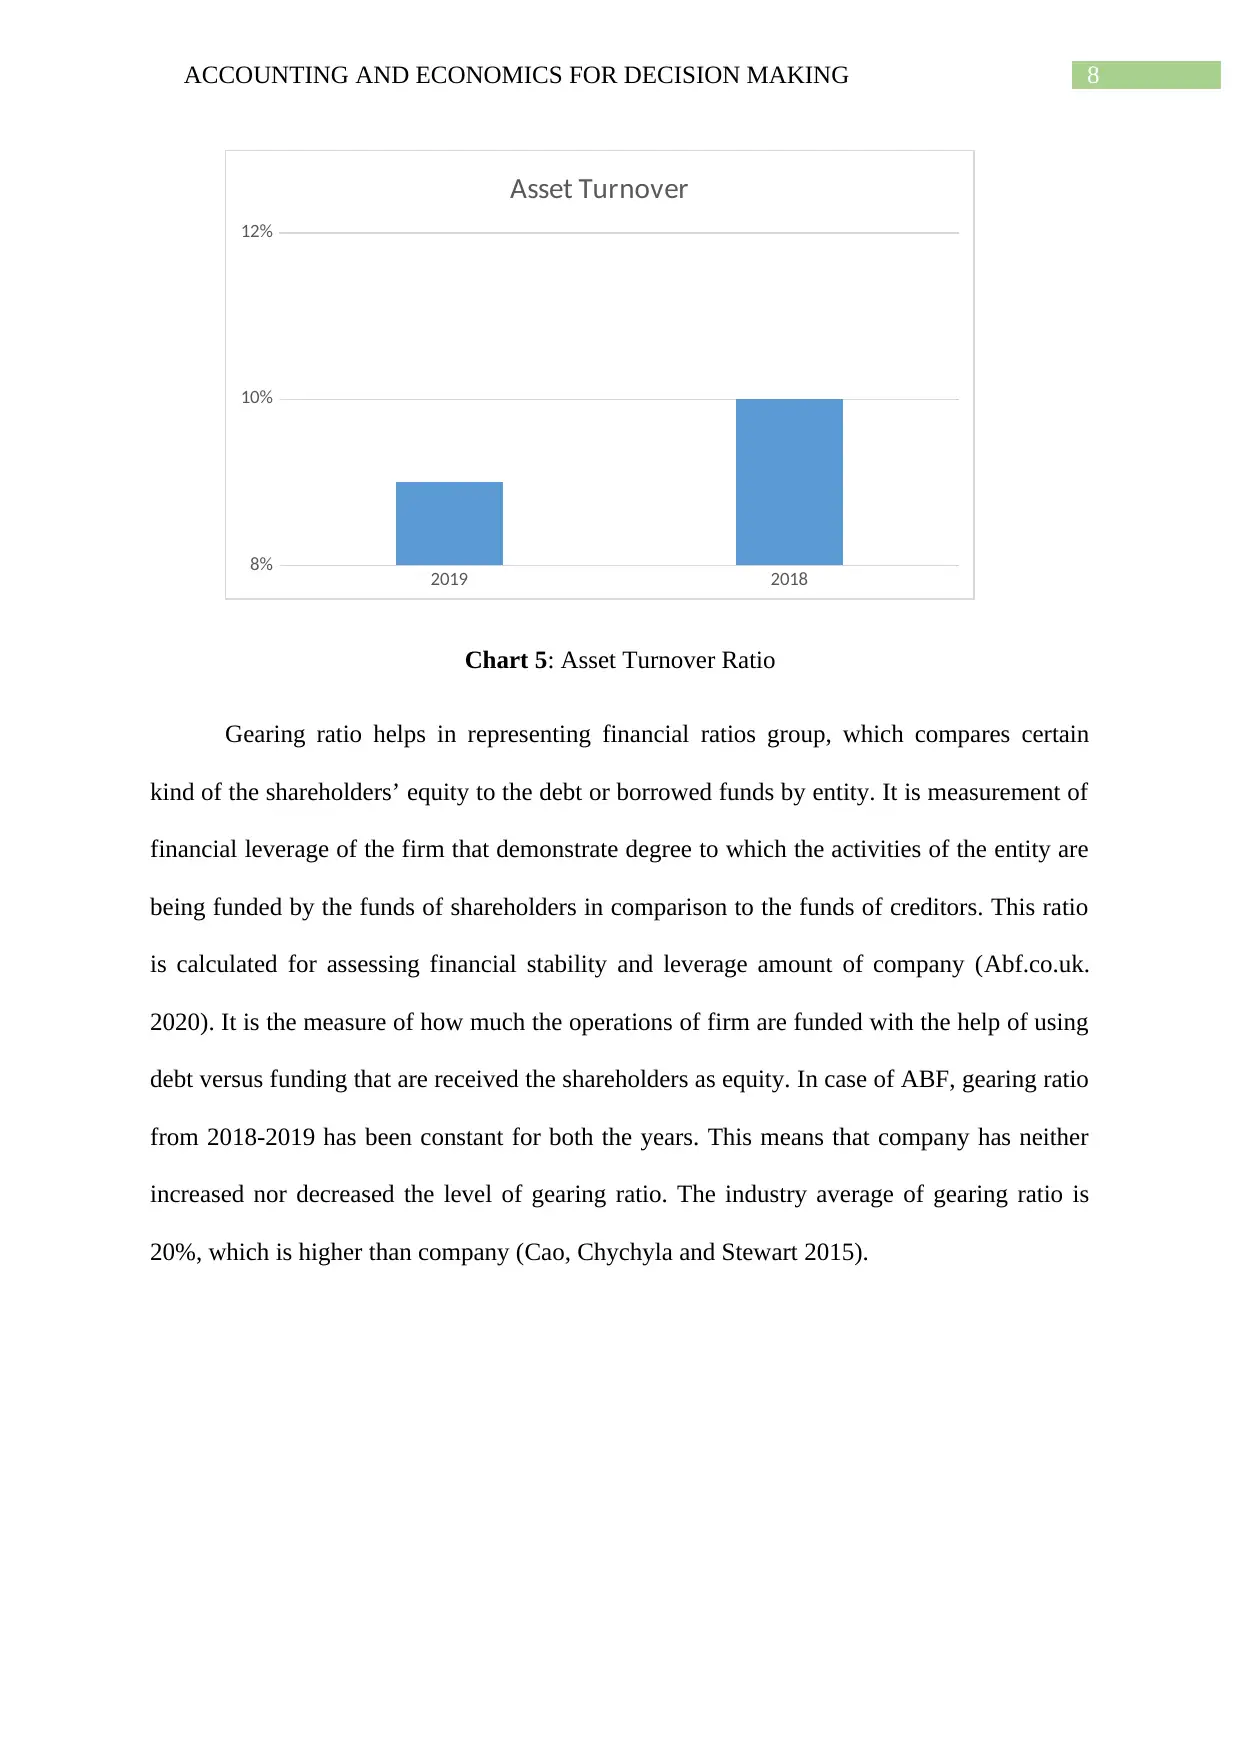
The ratio of Asset turnover measures value of sales of the entity in relative to assets
value. This ratio can be used as the indicator of the efficiency with the help of which entity
can use their assets for generating revenue. It is one of the most important tool used by firm
for making most of the assets and for identifying weakness in the firms (Abf.co.uk. 2020). In
case of Associated British Foods, the asset turnover from 2018-2019 has been decreased over
years that is from 10%-9%. This means that the efficiency level of entity has been decreased
over the years in using assets for generation of sales. The industry average of asset turnover is
24%, which is higher than company’s efficiency (Ahmed and Safdar 2018).
2019 2018
0.8
0.82
0.84
0.86
0.88
0.9
0.92
0.94
0.96
0.98
Quick Ratio
Chart 4: Quick Ratio
The ratio of Asset turnover measures value of sales of the entity in relative to assets
value. This ratio can be used as the indicator of the efficiency with the help of which entity
can use their assets for generating revenue. It is one of the most important tool used by firm
for making most of the assets and for identifying weakness in the firms (Abf.co.uk. 2020). In
case of Associated British Foods, the asset turnover from 2018-2019 has been decreased over
years that is from 10%-9%. This means that the efficiency level of entity has been decreased
over the years in using assets for generation of sales. The industry average of asset turnover is
24%, which is higher than company’s efficiency (Ahmed and Safdar 2018).
8ACCOUNTING AND ECONOMICS FOR DECISION MAKING
2019 2018
8%
10%
12%
Asset Turnover
Chart 5: Asset Turnover Ratio
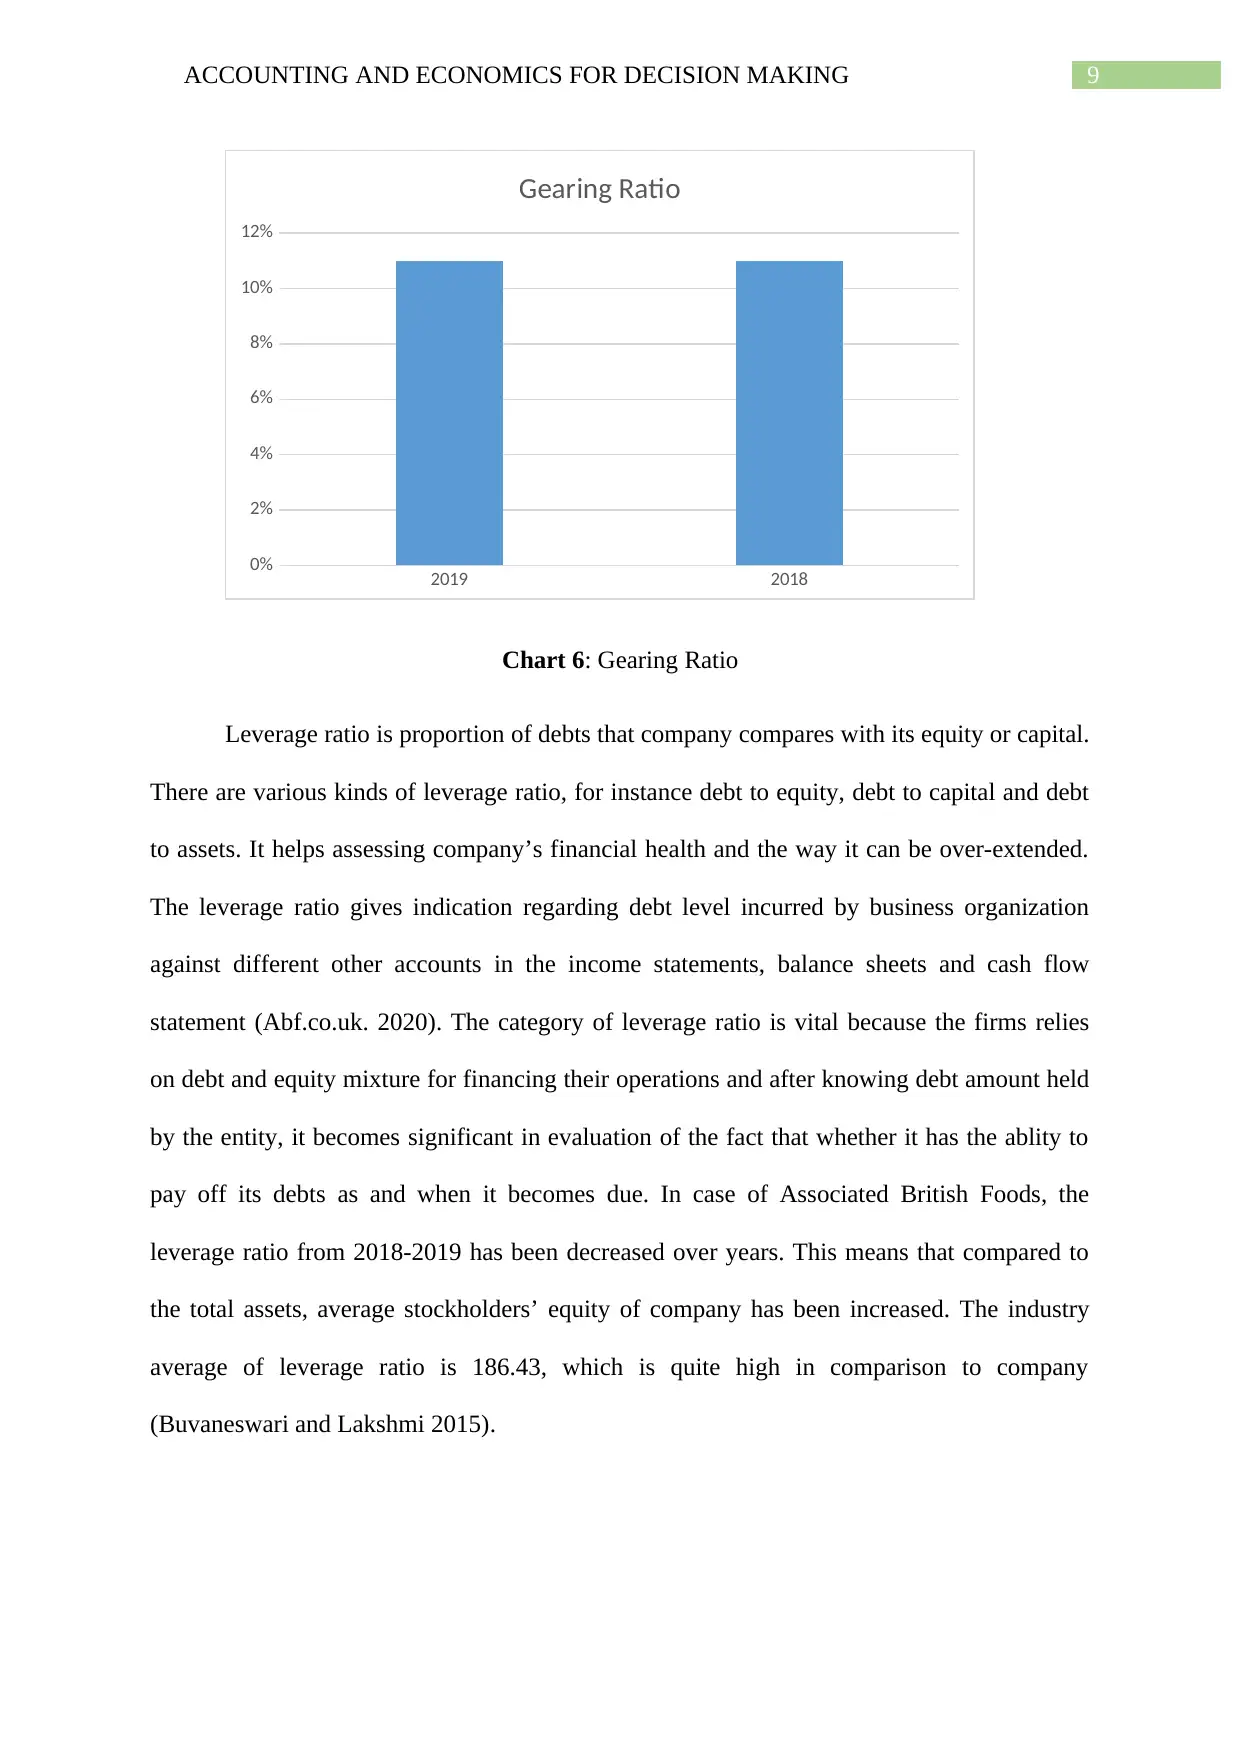
Gearing ratio helps in representing financial ratios group, which compares certain
kind of the shareholders’ equity to the debt or borrowed funds by entity. It is measurement of
financial leverage of the firm that demonstrate degree to which the activities of the entity are
being funded by the funds of shareholders in comparison to the funds of creditors. This ratio
is calculated for assessing financial stability and leverage amount of company (Abf.co.uk.
2020). It is the measure of how much the operations of firm are funded with the help of using
debt versus funding that are received the shareholders as equity. In case of ABF, gearing ratio
from 2018-2019 has been constant for both the years. This means that company has neither
increased nor decreased the level of gearing ratio. The industry average of gearing ratio is
20%, which is higher than company (Cao, Chychyla and Stewart 2015).
2019 2018
8%
10%
12%
Asset Turnover
Chart 5: Asset Turnover Ratio
Gearing ratio helps in representing financial ratios group, which compares certain
kind of the shareholders’ equity to the debt or borrowed funds by entity. It is measurement of
financial leverage of the firm that demonstrate degree to which the activities of the entity are
being funded by the funds of shareholders in comparison to the funds of creditors. This ratio
is calculated for assessing financial stability and leverage amount of company (Abf.co.uk.
2020). It is the measure of how much the operations of firm are funded with the help of using
debt versus funding that are received the shareholders as equity. In case of ABF, gearing ratio
from 2018-2019 has been constant for both the years. This means that company has neither
increased nor decreased the level of gearing ratio. The industry average of gearing ratio is
20%, which is higher than company (Cao, Chychyla and Stewart 2015).
⊘ This is a preview!⊘
Do you want full access?
Subscribe today to unlock all pages.
Trusted by 1+ million students worldwide
9ACCOUNTING AND ECONOMICS FOR DECISION MAKING
2019 2018
0%
2%
4%
6%
8%
10%
12%
Gearing Ratio
Chart 6: Gearing Ratio
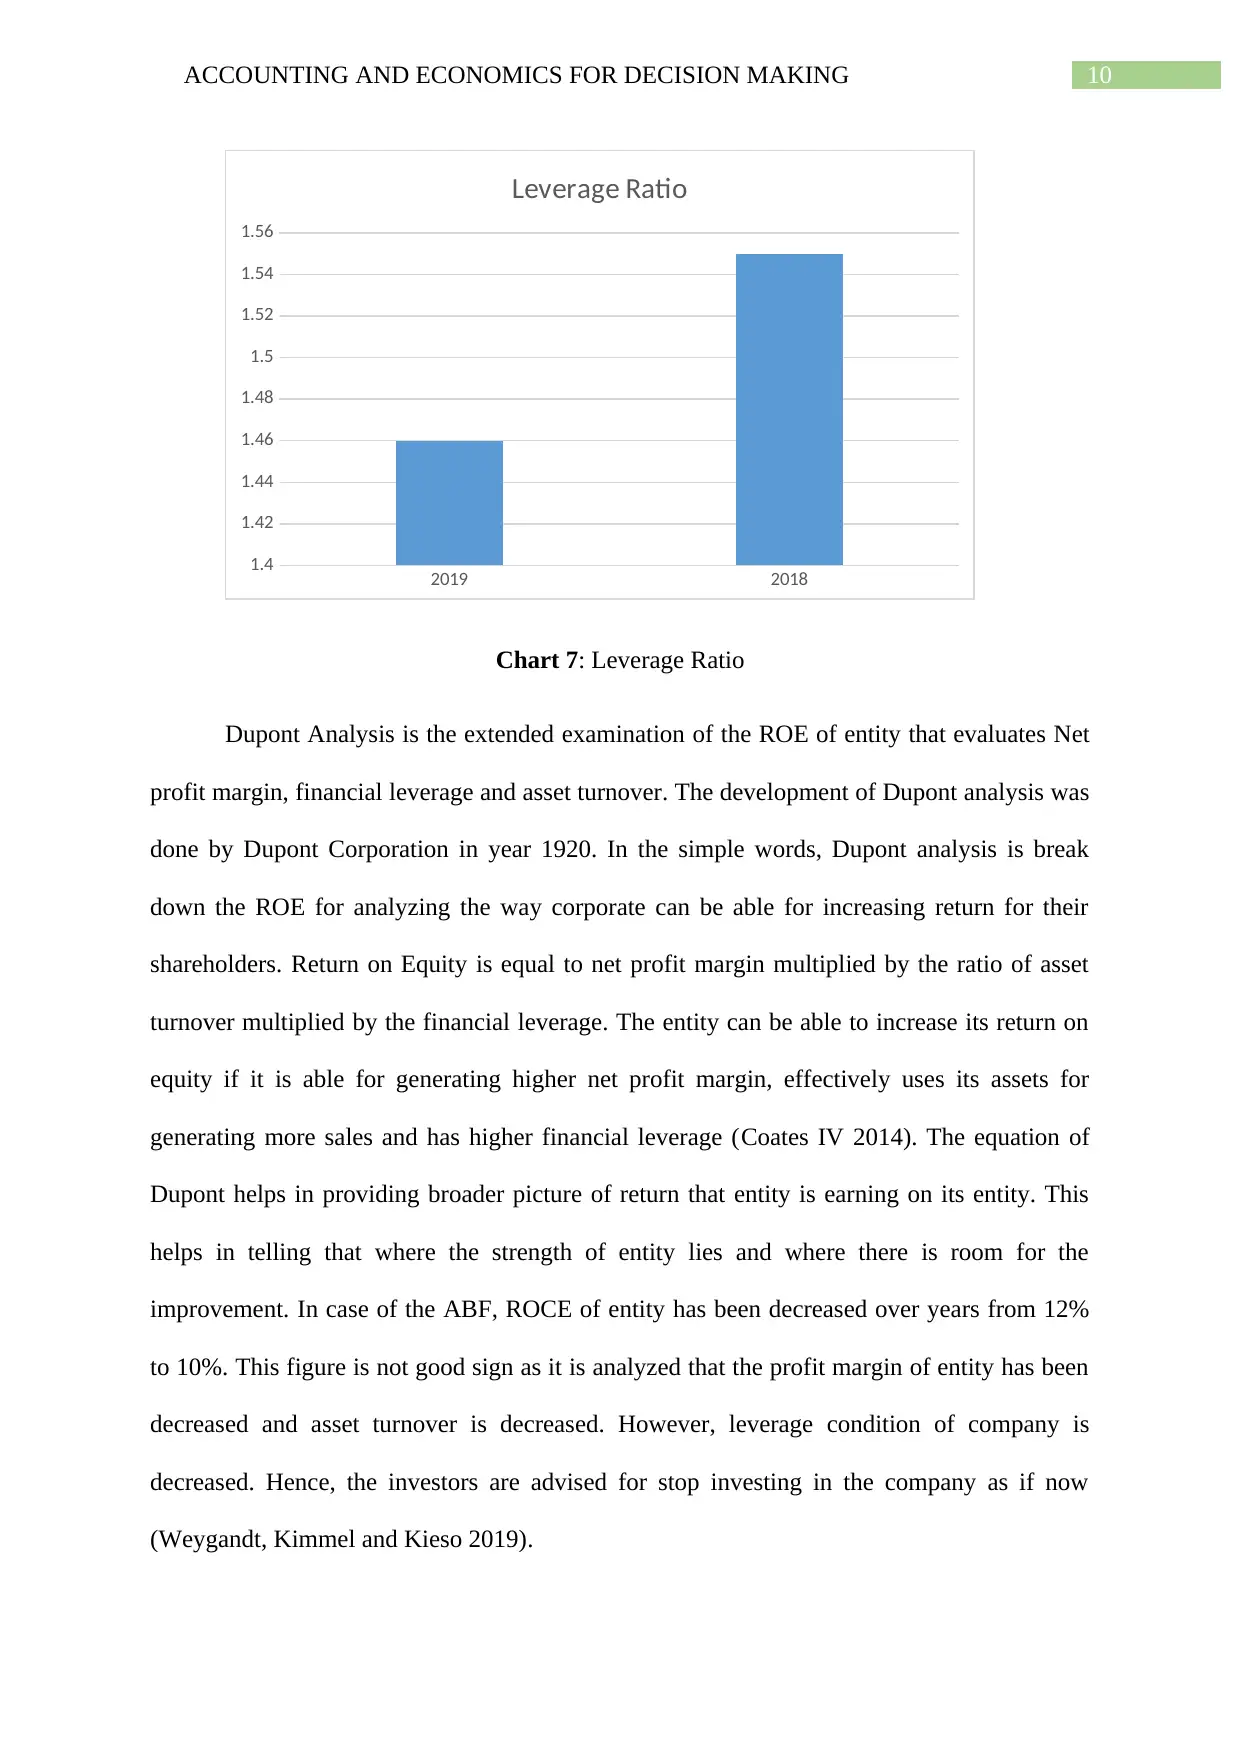
Leverage ratio is proportion of debts that company compares with its equity or capital.
There are various kinds of leverage ratio, for instance debt to equity, debt to capital and debt
to assets. It helps assessing company’s financial health and the way it can be over-extended.
The leverage ratio gives indication regarding debt level incurred by business organization
against different other accounts in the income statements, balance sheets and cash flow
statement (Abf.co.uk. 2020). The category of leverage ratio is vital because the firms relies
on debt and equity mixture for financing their operations and after knowing debt amount held
by the entity, it becomes significant in evaluation of the fact that whether it has the ablity to
pay off its debts as and when it becomes due. In case of Associated British Foods, the
leverage ratio from 2018-2019 has been decreased over years. This means that compared to
the total assets, average stockholders’ equity of company has been increased. The industry
average of leverage ratio is 186.43, which is quite high in comparison to company
(Buvaneswari and Lakshmi 2015).
2019 2018
0%
2%
4%
6%
8%
10%
12%
Gearing Ratio
Chart 6: Gearing Ratio
Leverage ratio is proportion of debts that company compares with its equity or capital.
There are various kinds of leverage ratio, for instance debt to equity, debt to capital and debt
to assets. It helps assessing company’s financial health and the way it can be over-extended.
The leverage ratio gives indication regarding debt level incurred by business organization
against different other accounts in the income statements, balance sheets and cash flow
statement (Abf.co.uk. 2020). The category of leverage ratio is vital because the firms relies
on debt and equity mixture for financing their operations and after knowing debt amount held
by the entity, it becomes significant in evaluation of the fact that whether it has the ablity to
pay off its debts as and when it becomes due. In case of Associated British Foods, the
leverage ratio from 2018-2019 has been decreased over years. This means that compared to
the total assets, average stockholders’ equity of company has been increased. The industry
average of leverage ratio is 186.43, which is quite high in comparison to company
(Buvaneswari and Lakshmi 2015).
Paraphrase This Document
Need a fresh take? Get an instant paraphrase of this document with our AI Paraphraser
10ACCOUNTING AND ECONOMICS FOR DECISION MAKING
2019 2018
1.4
1.42
1.44
1.46
1.48
1.5
1.52
1.54
1.56
Leverage Ratio
Chart 7: Leverage Ratio
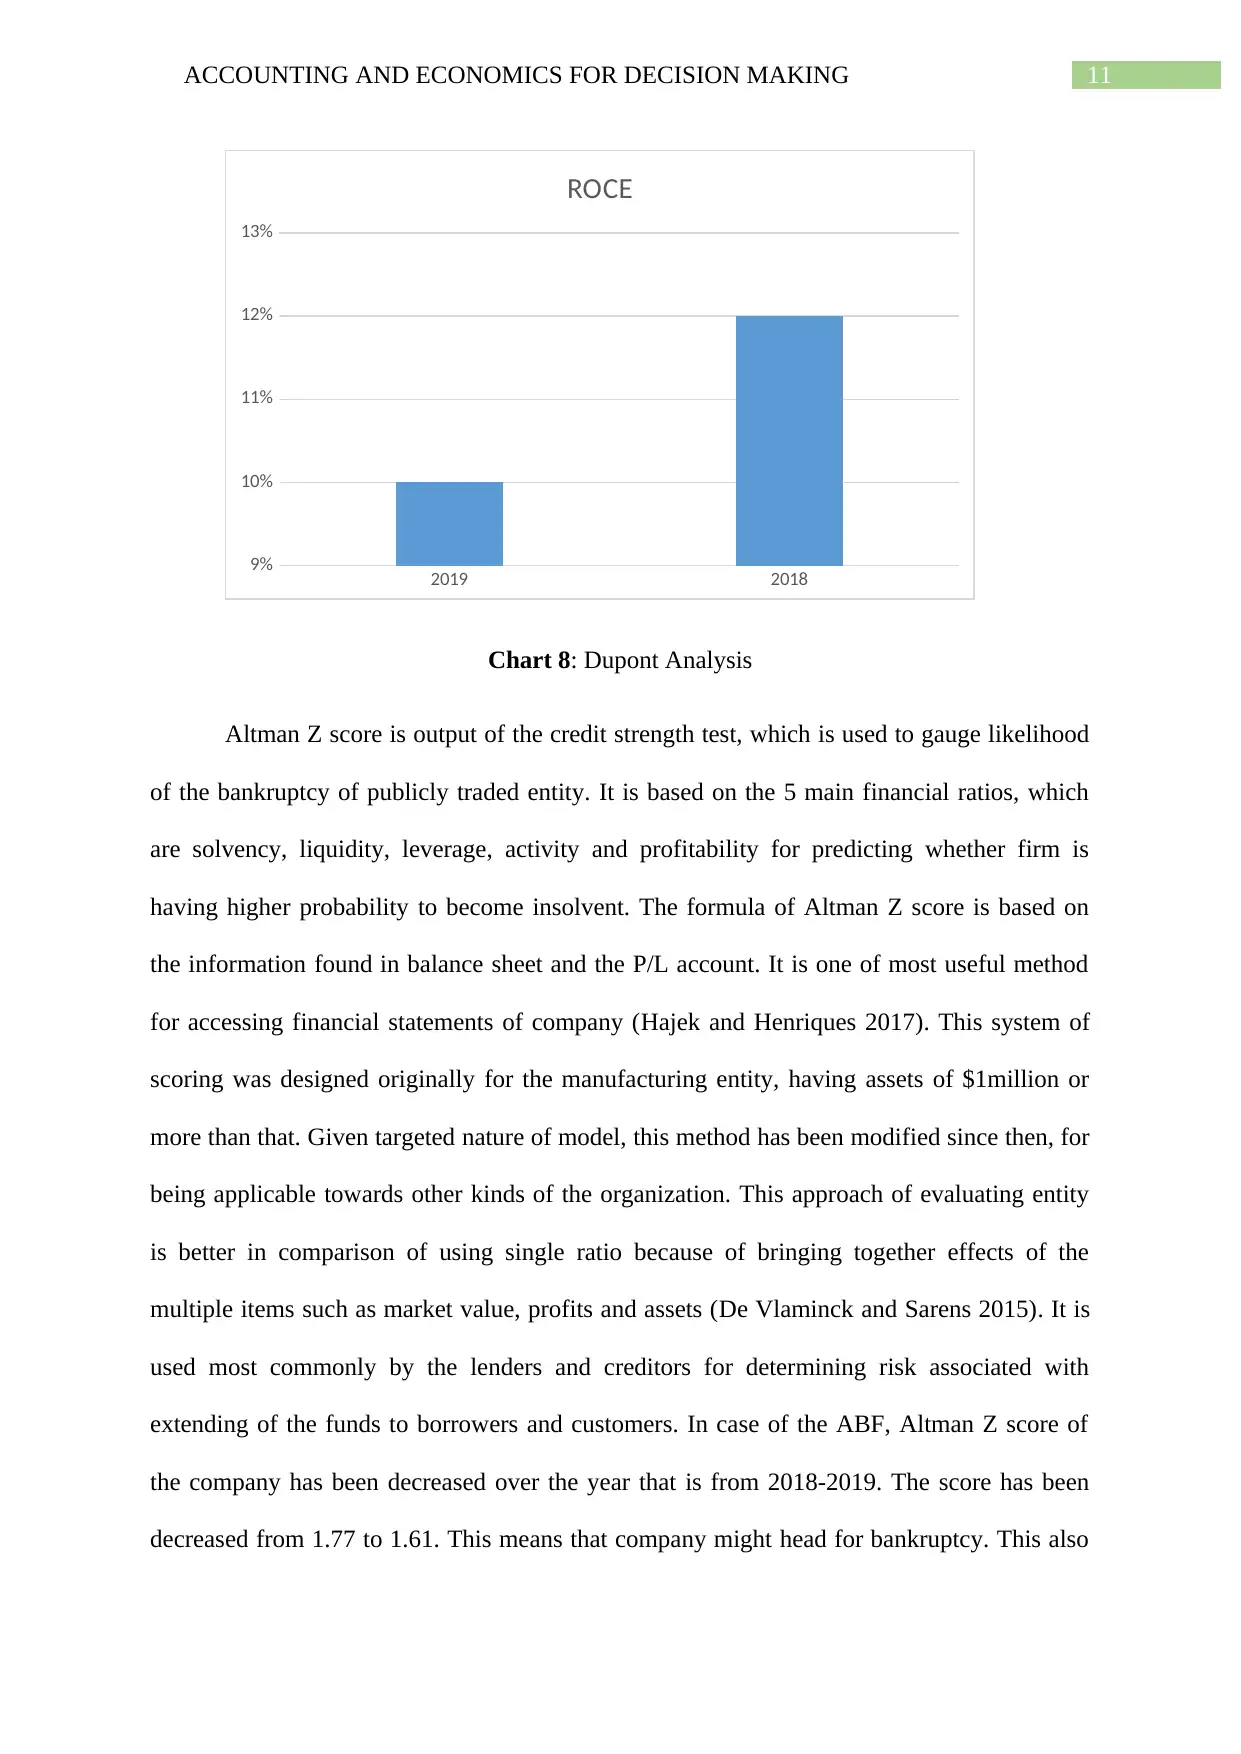
Dupont Analysis is the extended examination of the ROE of entity that evaluates Net
profit margin, financial leverage and asset turnover. The development of Dupont analysis was
done by Dupont Corporation in year 1920. In the simple words, Dupont analysis is break
down the ROE for analyzing the way corporate can be able for increasing return for their
shareholders. Return on Equity is equal to net profit margin multiplied by the ratio of asset
turnover multiplied by the financial leverage. The entity can be able to increase its return on
equity if it is able for generating higher net profit margin, effectively uses its assets for
generating more sales and has higher financial leverage (Coates IV 2014). The equation of
Dupont helps in providing broader picture of return that entity is earning on its entity. This
helps in telling that where the strength of entity lies and where there is room for the
improvement. In case of the ABF, ROCE of entity has been decreased over years from 12%
to 10%. This figure is not good sign as it is analyzed that the profit margin of entity has been
decreased and asset turnover is decreased. However, leverage condition of company is
decreased. Hence, the investors are advised for stop investing in the company as if now
(Weygandt, Kimmel and Kieso 2019).
2019 2018
1.4
1.42
1.44
1.46
1.48
1.5
1.52
1.54
1.56
Leverage Ratio
Chart 7: Leverage Ratio
Dupont Analysis is the extended examination of the ROE of entity that evaluates Net
profit margin, financial leverage and asset turnover. The development of Dupont analysis was
done by Dupont Corporation in year 1920. In the simple words, Dupont analysis is break
down the ROE for analyzing the way corporate can be able for increasing return for their
shareholders. Return on Equity is equal to net profit margin multiplied by the ratio of asset
turnover multiplied by the financial leverage. The entity can be able to increase its return on
equity if it is able for generating higher net profit margin, effectively uses its assets for
generating more sales and has higher financial leverage (Coates IV 2014). The equation of
Dupont helps in providing broader picture of return that entity is earning on its entity. This
helps in telling that where the strength of entity lies and where there is room for the
improvement. In case of the ABF, ROCE of entity has been decreased over years from 12%
to 10%. This figure is not good sign as it is analyzed that the profit margin of entity has been
decreased and asset turnover is decreased. However, leverage condition of company is
decreased. Hence, the investors are advised for stop investing in the company as if now
(Weygandt, Kimmel and Kieso 2019).
11ACCOUNTING AND ECONOMICS FOR DECISION MAKING
2019 2018
9%
10%
11%
12%
13%
ROCE
Chart 8: Dupont Analysis
Altman Z score is output of the credit strength test, which is used to gauge likelihood
of the bankruptcy of publicly traded entity. It is based on the 5 main financial ratios, which
are solvency, liquidity, leverage, activity and profitability for predicting whether firm is
having higher probability to become insolvent. The formula of Altman Z score is based on
the information found in balance sheet and the P/L account. It is one of most useful method
for accessing financial statements of company (Hajek and Henriques 2017). This system of
scoring was designed originally for the manufacturing entity, having assets of $1million or
more than that. Given targeted nature of model, this method has been modified since then, for
being applicable towards other kinds of the organization. This approach of evaluating entity
is better in comparison of using single ratio because of bringing together effects of the
multiple items such as market value, profits and assets (De Vlaminck and Sarens 2015). It is
used most commonly by the lenders and creditors for determining risk associated with
extending of the funds to borrowers and customers. In case of the ABF, Altman Z score of
the company has been decreased over the year that is from 2018-2019. The score has been
decreased from 1.77 to 1.61. This means that company might head for bankruptcy. This also
⊘ This is a preview!⊘
Do you want full access?
Subscribe today to unlock all pages.
Trusted by 1+ million students worldwide
1 out of 26
Related Documents


Your All-in-One AI-Powered Toolkit for Academic Success.
+13062052269
info@desklib.com
Available 24*7 on WhatsApp / Email
![[object Object]](/_next/static/media/star-bottom.7253800d.svg)
Unlock your academic potential
Copyright © 2020–2026 A2Z Services. All Rights Reserved. Developed and managed by ZUCOL.