Accounting Report: Comparative Financial Analysis of Rose Garden Hotel

Verified

Added on  2020/05/01

|8
|1692
|120
Report
AI Summary
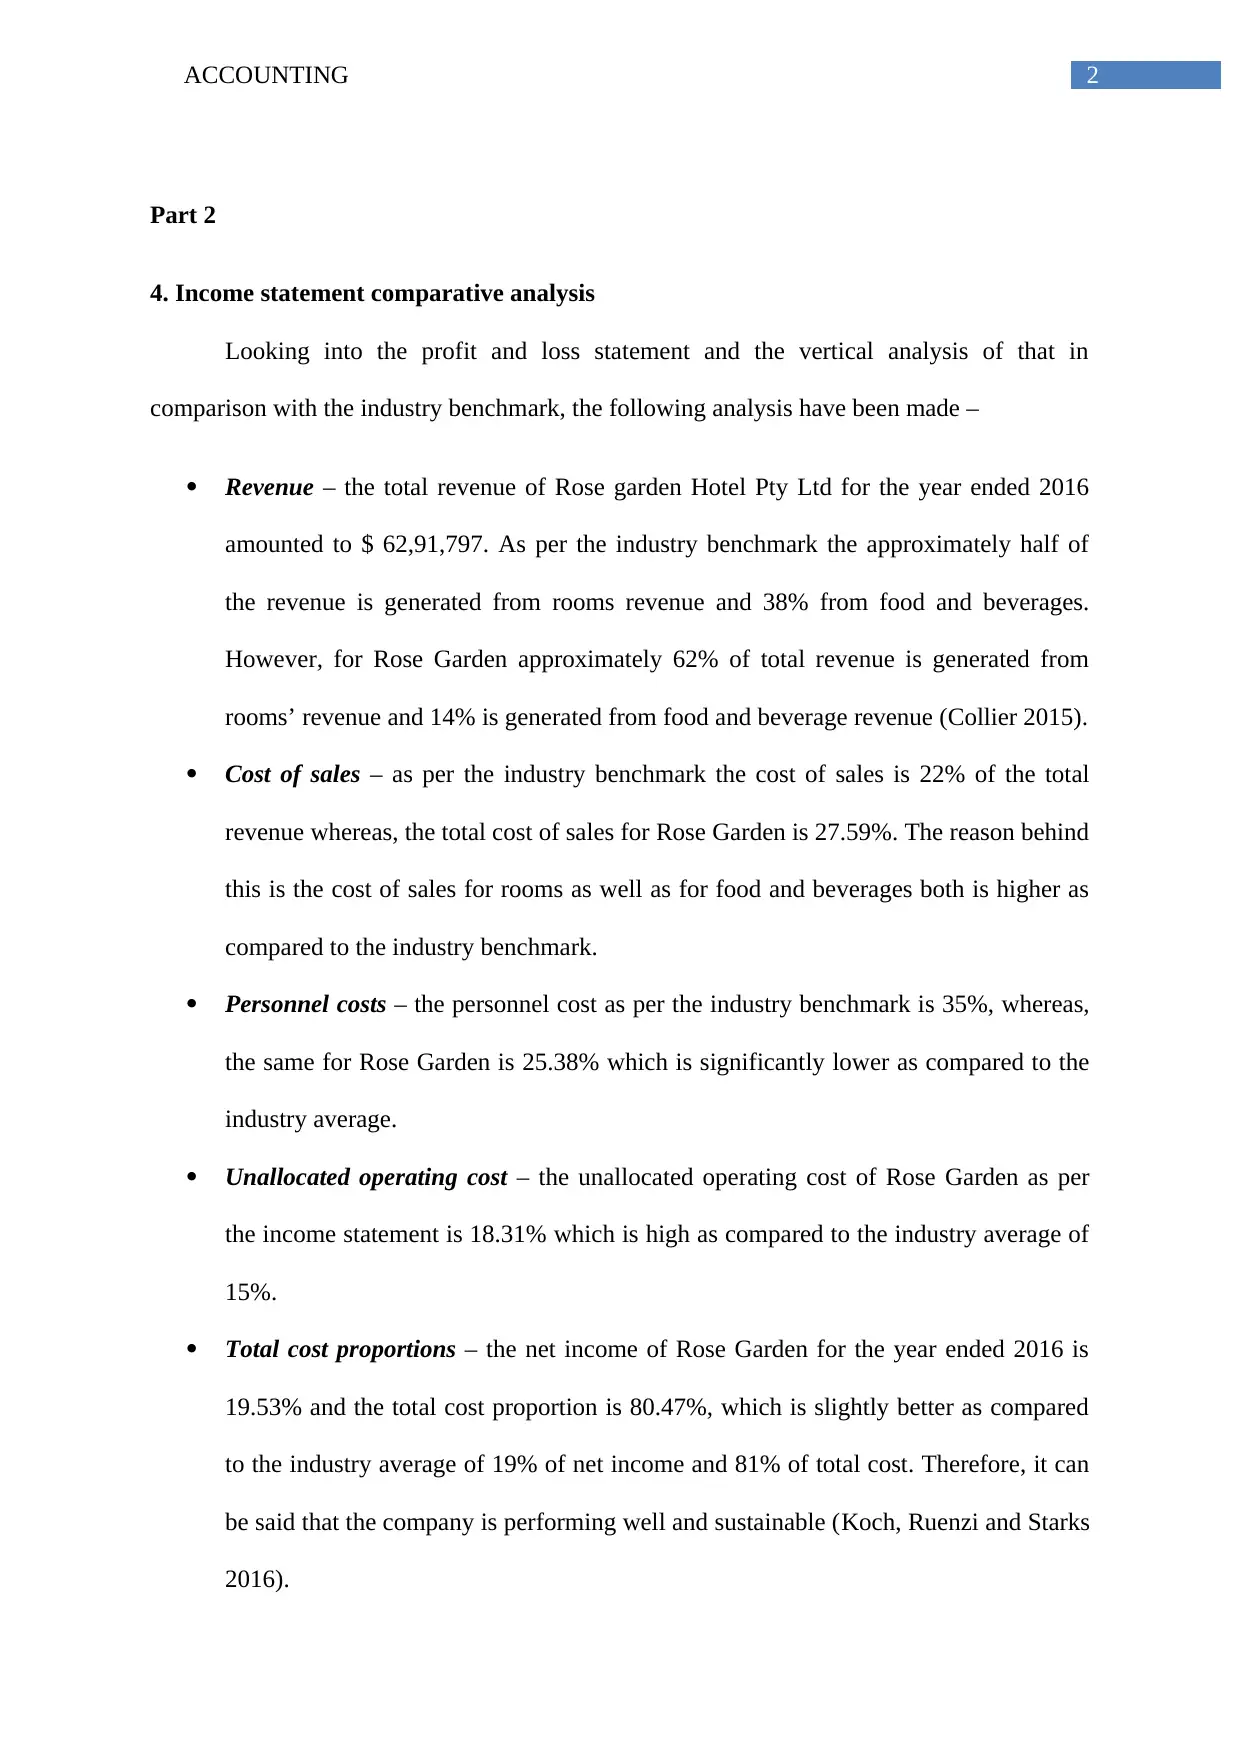
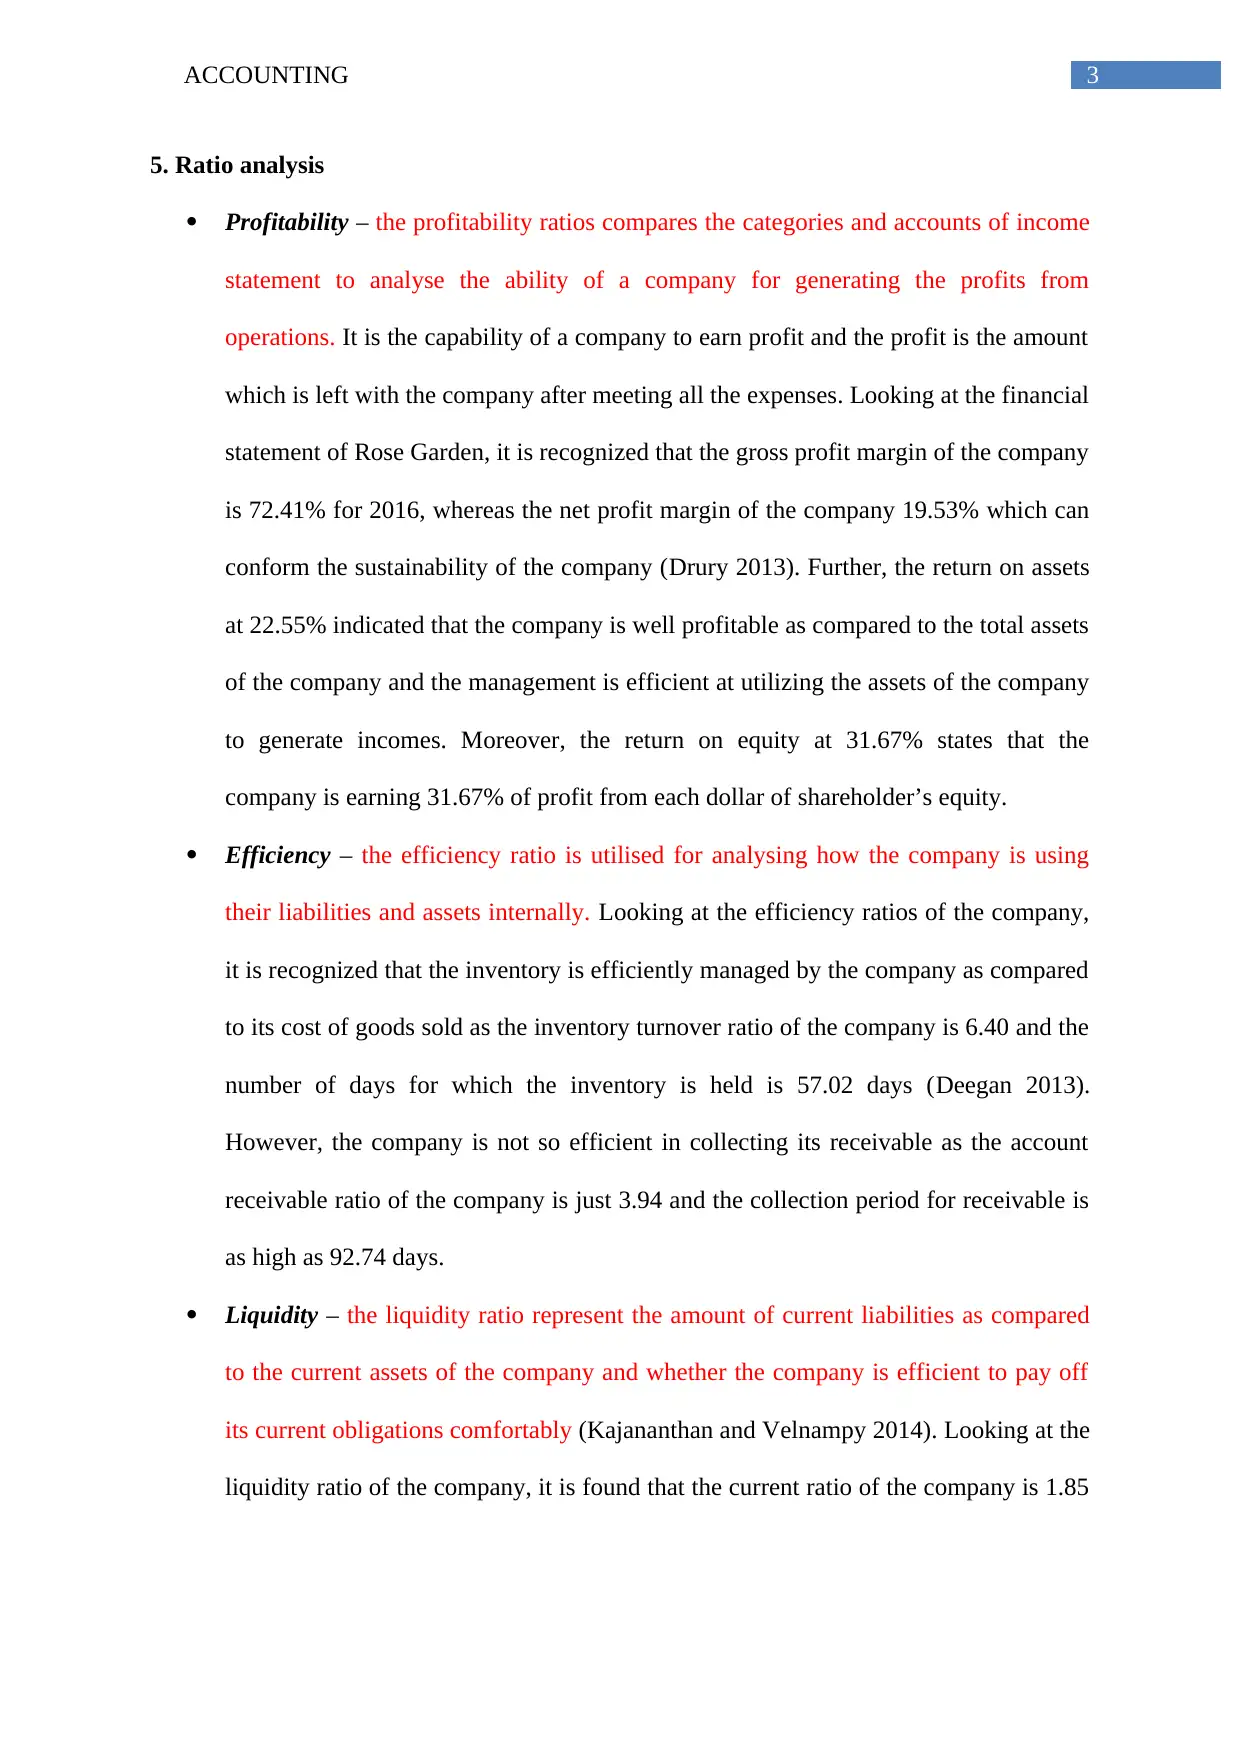
This report provides a comprehensive financial analysis of Rose Garden Hotel Pty Ltd, comparing its performance to industry benchmarks. The analysis includes an examination of the income statement, revealing revenue generation, cost of sales, and operating costs. Ratio analysis is conducted to assess profitability (gross profit margin, net profit margin, return on assets, return on equity), efficiency (inventory turnover, receivable collection), liquidity (current ratio), and solvency. The report compares the hotel's performance to industry averages, highlighting strengths such as net profit margin and return on equity, while also identifying areas for improvement, like receivable collection and inventory turnover. The report suggests strategies to enhance financial performance, such as offering discounts for early payments and conducting market research to optimize sales. Benchmarks like occupancy rate, average daily rate, and total room revenue are also discussed for comparative analysis.
Document Page
Running head: ACCOUNTING
Accounting
Name of the student
Name of the university
Author note
tabler-icon-diamond-filled.svg

Secure Best Marks with AI Grader

Need help grading? Try our AI Grader for instant feedback on your assignments.
Document Page
1ACCOUNTING
Table of Contents
Part 2..........................................................................................................................................2
4. Income statement comparative analysis.............................................................................2
5. Ratio analysis.....................................................................................................................3
6. Industry specific performance............................................................................................4
References..................................................................................................................................6
Document Page
2ACCOUNTING
Part 2
4. Income statement comparative analysis
Looking into the profit and loss statement and the vertical analysis of that in
comparison with the industry benchmark, the following analysis have been made –
Revenue – the total revenue of Rose garden Hotel Pty Ltd for the year ended 2016
amounted to $ 62,91,797. As per the industry benchmark the approximately half of
the revenue is generated from rooms revenue and 38% from food and beverages.
However, for Rose Garden approximately 62% of total revenue is generated from
rooms’ revenue and 14% is generated from food and beverage revenue (Collier 2015).
Cost of sales – as per the industry benchmark the cost of sales is 22% of the total
revenue whereas, the total cost of sales for Rose Garden is 27.59%. The reason behind
this is the cost of sales for rooms as well as for food and beverages both is higher as
compared to the industry benchmark.
Personnel costs – the personnel cost as per the industry benchmark is 35%, whereas,
the same for Rose Garden is 25.38% which is significantly lower as compared to the
industry average.
Unallocated operating cost – the unallocated operating cost of Rose Garden as per
the income statement is 18.31% which is high as compared to the industry average of
15%.
Total cost proportions – the net income of Rose Garden for the year ended 2016 is
19.53% and the total cost proportion is 80.47%, which is slightly better as compared
to the industry average of 19% of net income and 81% of total cost. Therefore, it can
be said that the company is performing well and sustainable (Koch, Ruenzi and Starks
2016).
Document Page
3ACCOUNTING
5. Ratio analysis
Profitability the profitability ratios compares the categories and accounts of income
statement to analyse the ability of a company for generating the profits from
operations. It is the capability of a company to earn profit and the profit is the amount
which is left with the company after meeting all the expenses. Looking at the financial
statement of Rose Garden, it is recognized that the gross profit margin of the company
is 72.41% for 2016, whereas the net profit margin of the company 19.53% which can
conform the sustainability of the company (Drury 2013). Further, the return on assets
at 22.55% indicated that the company is well profitable as compared to the total assets
of the company and the management is efficient at utilizing the assets of the company
to generate incomes. Moreover, the return on equity at 31.67% states that the
company is earning 31.67% of profit from each dollar of shareholder’s equity.
Efficiency the efficiency ratio is utilised for analysing how the company is using
their liabilities and assets internally. Looking at the efficiency ratios of the company,
it is recognized that the inventory is efficiently managed by the company as compared
to its cost of goods sold as the inventory turnover ratio of the company is 6.40 and the
number of days for which the inventory is held is 57.02 days (Deegan 2013).
However, the company is not so efficient in collecting its receivable as the account
receivable ratio of the company is just 3.94 and the collection period for receivable is
as high as 92.74 days.
Liquidity the liquidity ratio represent the amount of current liabilities as compared
to the current assets of the company and whether the company is efficient to pay off
its current obligations comfortably (Kajananthan and Velnampy 2014). Looking at the
liquidity ratio of the company, it is found that the current ratio of the company is 1.85
tabler-icon-diamond-filled.svg

Secure Best Marks with AI Grader

Need help grading? Try our AI Grader for instant feedback on your assignments.
Document Page
4ACCOUNTING
which indicates that the company is efficient in paying off its short-term obligations
with the available current assets.
Solvency solvency ratios are used to analyse the company’s ability for meeting the
long-term debt of the company. Further, solvency ratio computes the amount of
income after tax, non-cash expenses towards depreciation as compared to the
company’s debt obligation. Analyzing the solvency ratios of the company it is
recognized that out of the total capital, 35.82% is financed through debt and the rest
of 64.18% is financed through equity (Bebbington, Unerman and O'Dwyer 2014).
Further, it is recognized that 26.37% of the company’s assets are financed through
debt. Moreover, the interest coverage ratio of 60 indicates that the company is able to
pay the interest on the outstanding debt efficiently.
6. Industry specific performance
If the performance of Rose Garden is compared with the industrial benchmark, it is
identified that the gross profit margin of the company at 72.41% is lower as compared to the
industry average of 81%. However, the net profit margin is better at 19.53% as compared to
the industry average of 11%. Further, the return on equity as well as the return on assets both
is significantly higher as compared to the industry average (Bodie 2013). With regard to the
efficiency ratio, it is found that the inventory turnover ratio of the company is lower at 6.40
as compared to the industry benchmark of 8.60. Further, the receivable collection period of
the company is significantly higher at 92.74 as compared to the industry average of 35.
Therefore, it can be said that the company is not so efficient in managing its inventories and
collecting their receivables. Considering the liquidity ratios of the company, it is found that
though the liquidity ratios of the company are good, it is significantly lower as compared to
the industry benchmark (Ogiela and Ogiela 2015). With regard to the solvency ratio, it is
found that 35.82% of the capital is financed through debt and 64.18% is financed through
Document Page
5ACCOUNTING
equity. Further, it is recognized that 26.37% of the company’s assets are financed through
debt and the interest coverage ratio of 60 indicates that the company is able to pay the interest
on the outstanding debt efficiently.
Therefore, if the overall performance of the company in comparison with the industry
benchmark is considered, it can be said that the company is performing well that confirms its
long-term profitability and sustainability. However, as the receivable collection period of the
company is significantly high for the company as compared to the industry benchmark, the
management shall look into the matter and take necessary steps to collect the debts in shorter
time period. For instance, it can offer discounts to the debtor who makes the payment in short
period or the company can appoint a person as debt collector who will solely look after the
collection. Apart from this, to improve the inventory turnover rate, the company shall
condusct a research in the market to analyse the demand of the customers and shall take
necessary steps to minimise the cost of making the sales.
Further, the benchmarks ratios that can be used by the hotel for the purpose of
comparative analysis are as follows –
Occupancy rate – the occupancy rate is the ratio of the rentals generated from the rented units
as against total number of rooms. The formula for calculating the occupancy rate is to divide
the total rooms occupied by the total numbers of the available rooms. The occupancy rate can
be increased by implementing the strategies that will put restrictions on length of the stay.
Average daily rate – this is a statistical unit generally used in the hotel and lodging industries.
This number reveals the average rental income earned from each room occupied under a
given period of time. The average daily rate with the occupancy rate of the hotel is the key
ratios for analysing the financial performance of a hotel.
Document Page
6ACCOUNTING
Total room revenue – revenue per room available is the performance metric that is used for
the hotel industry and it is measured through multiplying the average daily rate by the
occupancy rate or it is measured through dividing the total room revenue by total number of
rooms available in the given period of time.
tabler-icon-diamond-filled.svg

Paraphrase This Document

Need a fresh take? Get an instant paraphrase of this document with our AI Paraphraser
Document Page
7ACCOUNTING
References
Bebbington, J., Unerman, J. and O'Dwyer, B. eds., 2014. Sustainability accounting and
accountability. Routledge.
Bodie, Z., 2013. Investments. McGraw-Hill.
Collier, P.M., 2015. Accounting for managers: Interpreting accounting information for
decision making. John Wiley & Sons.
Deegan, C., 2013. Financial accounting theory. McGraw-Hill Education Australia.
DRURY, C.M., 2013. Management and cost accounting. Springer.
Kajananthan, R. and Velnampy, T., 2014. Liquidity, Solvency and Profitability Analysis
Using Cash Flow Ratios and Traditional Ratios: The Telecommunication Sector in Sri
Lanka. Research Journal of Finance and Accounting, 5(23).
Koch, A., Ruenzi, S. and Starks, L., 2016. Commonality in liquidity: a demand-side
explanation. The Review of Financial Studies, 29(8), pp.1943-1974.
Ogiela, L. and Ogiela, M.R., 2015. Management information systems. In Ubiquitous
Computing Application and Wireless Sensor (pp. 449-456). Springer, Dordrecht.
chevron_up_icon
1 out of 8
circle_padding
hide_on_mobile
zoom_out_icon
logo.png

Your All-in-One AI-Powered Toolkit for Academic Success.

Available 24*7 on WhatsApp / Email

[object Object]