ACC1AIS - Financial Analysis of Roshan Karki Company, May 2018

Verified

Added on  2023/06/12

|10
|1437
|51
Practical Assignment
AI Summary
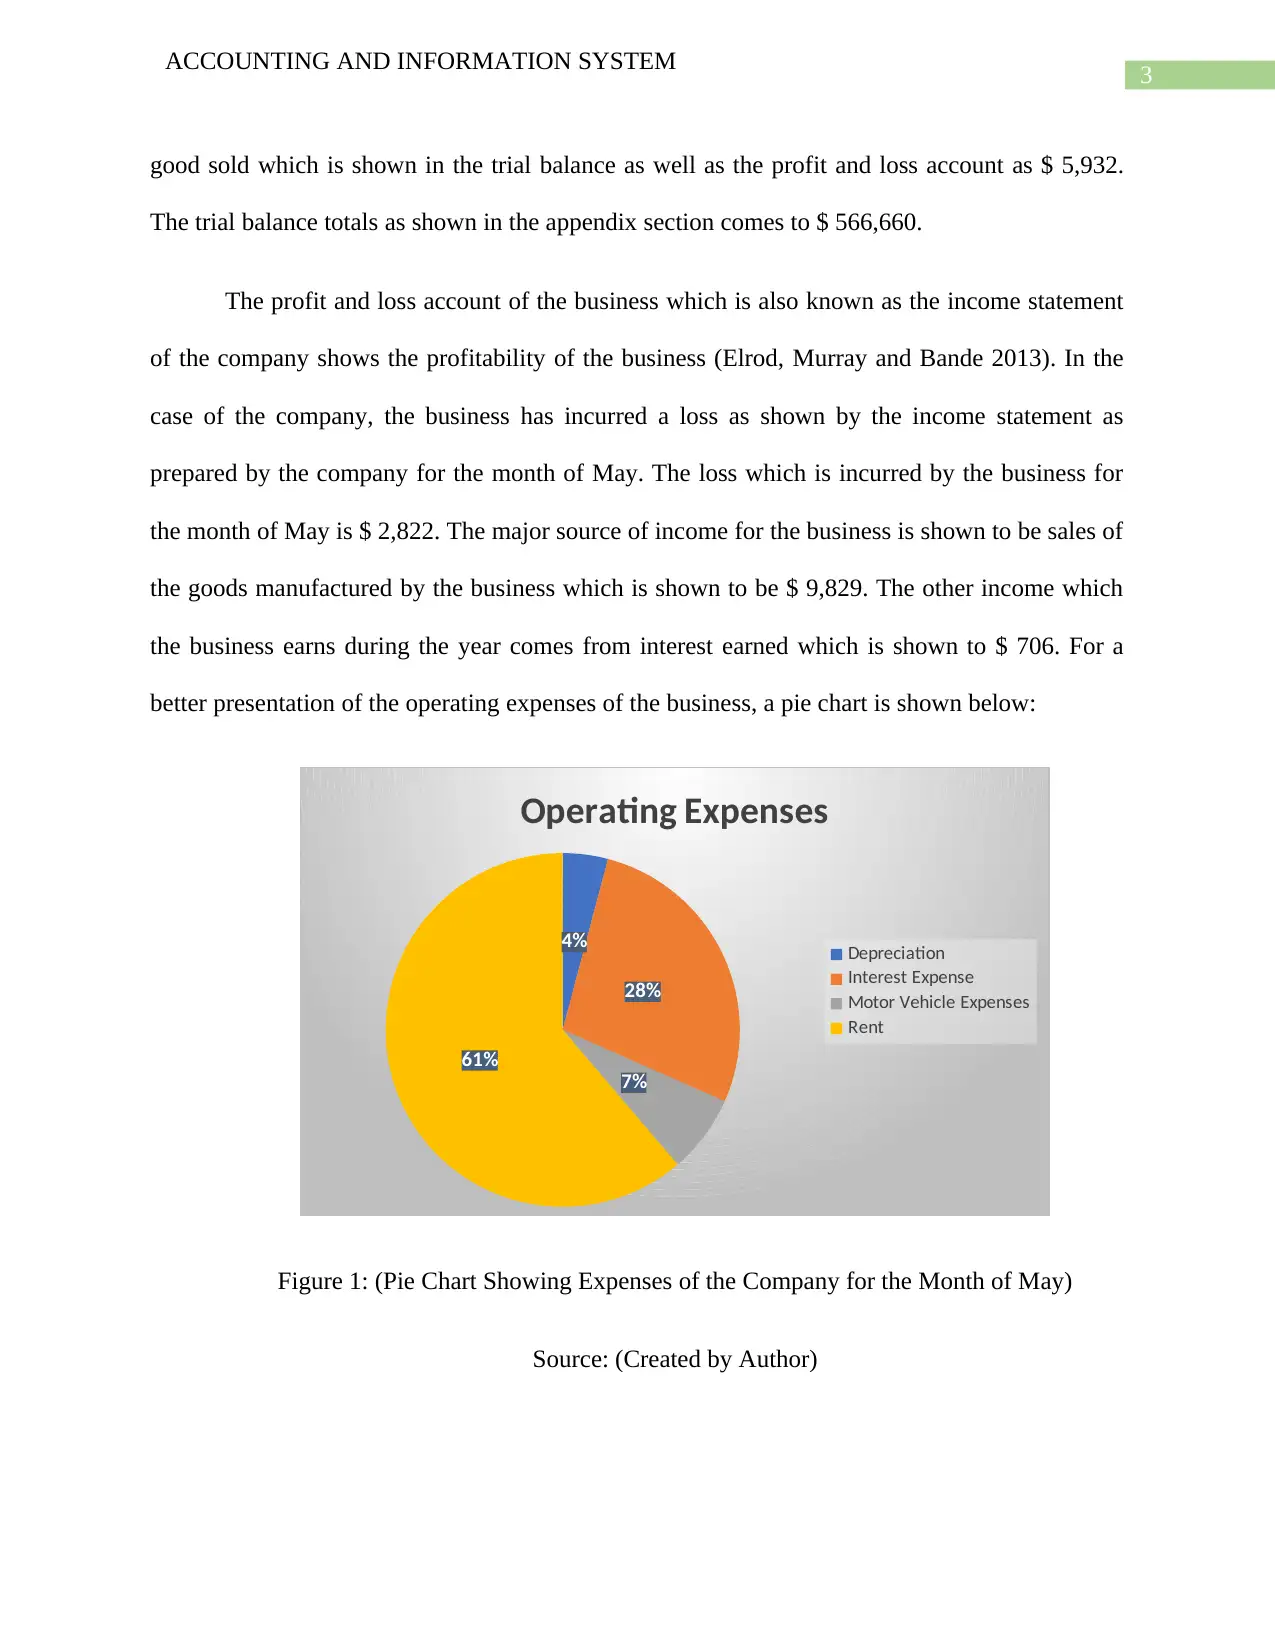
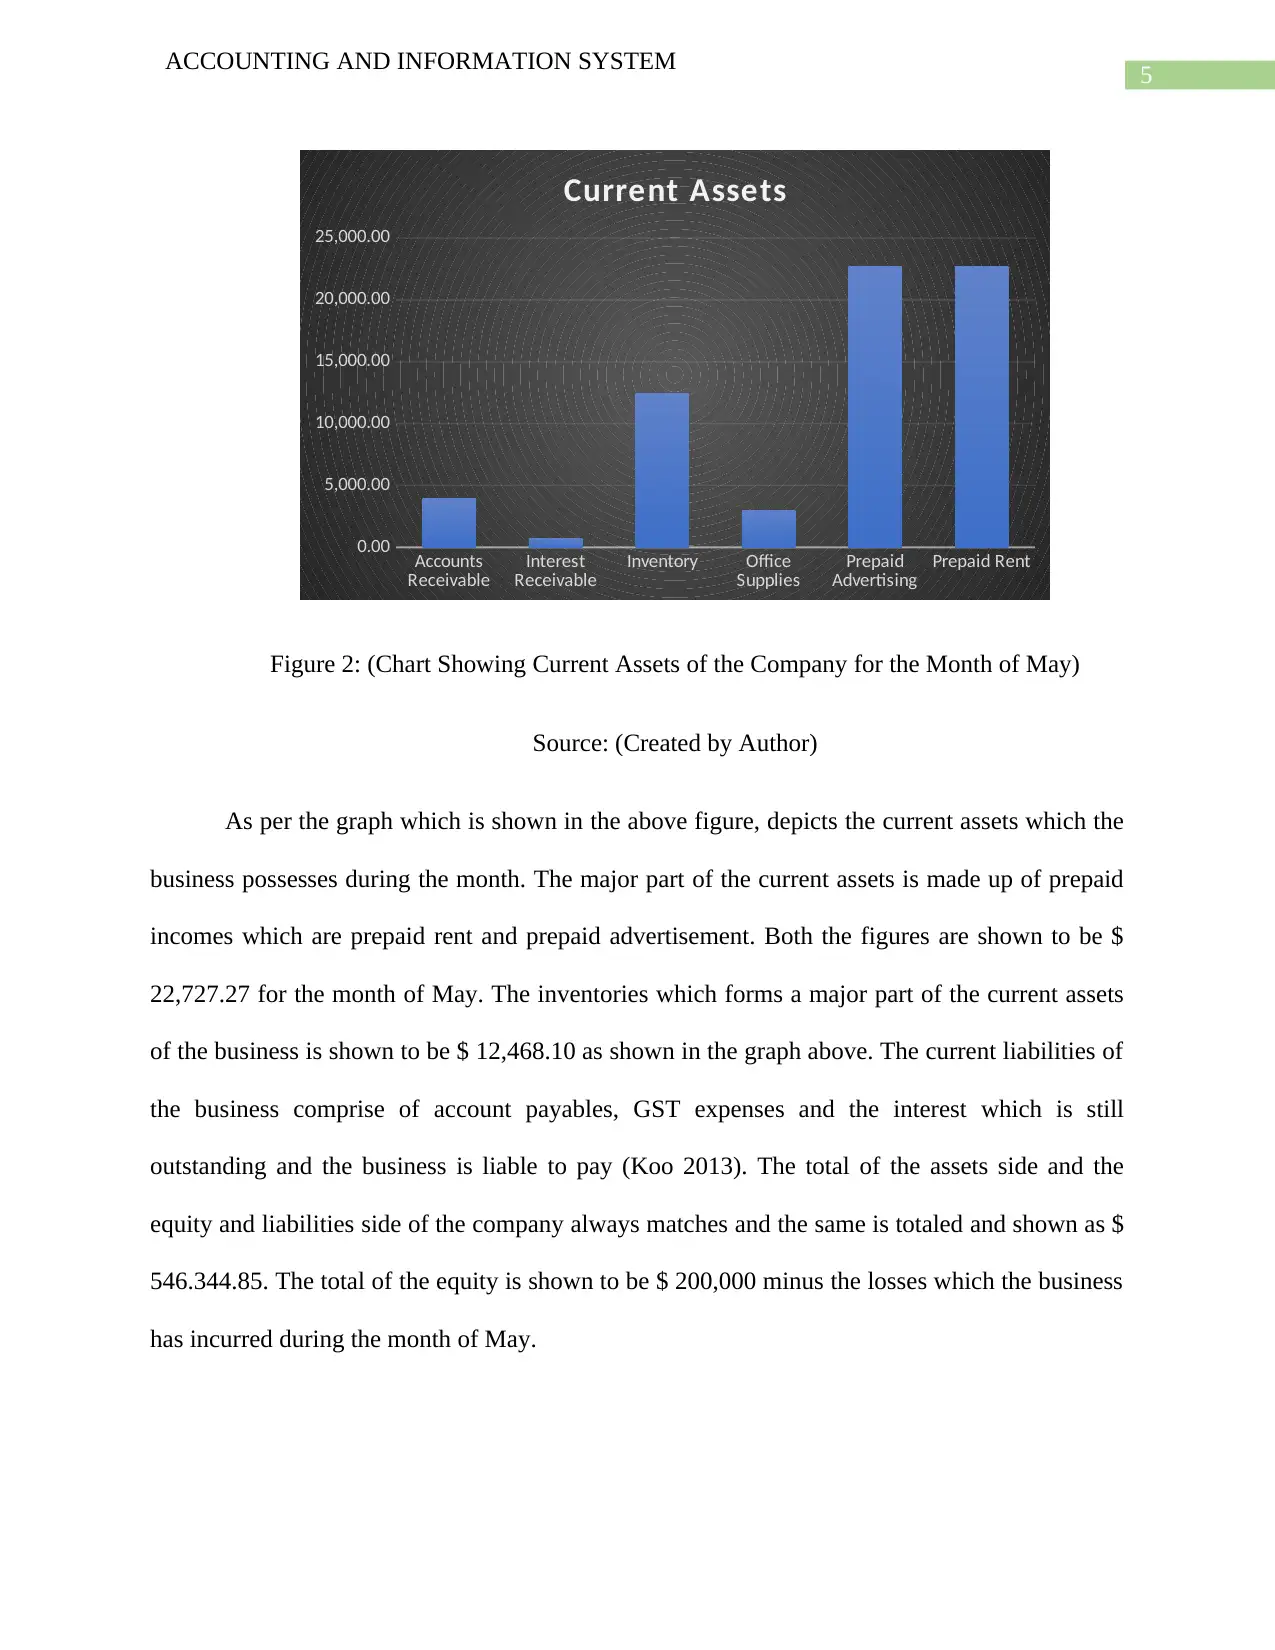
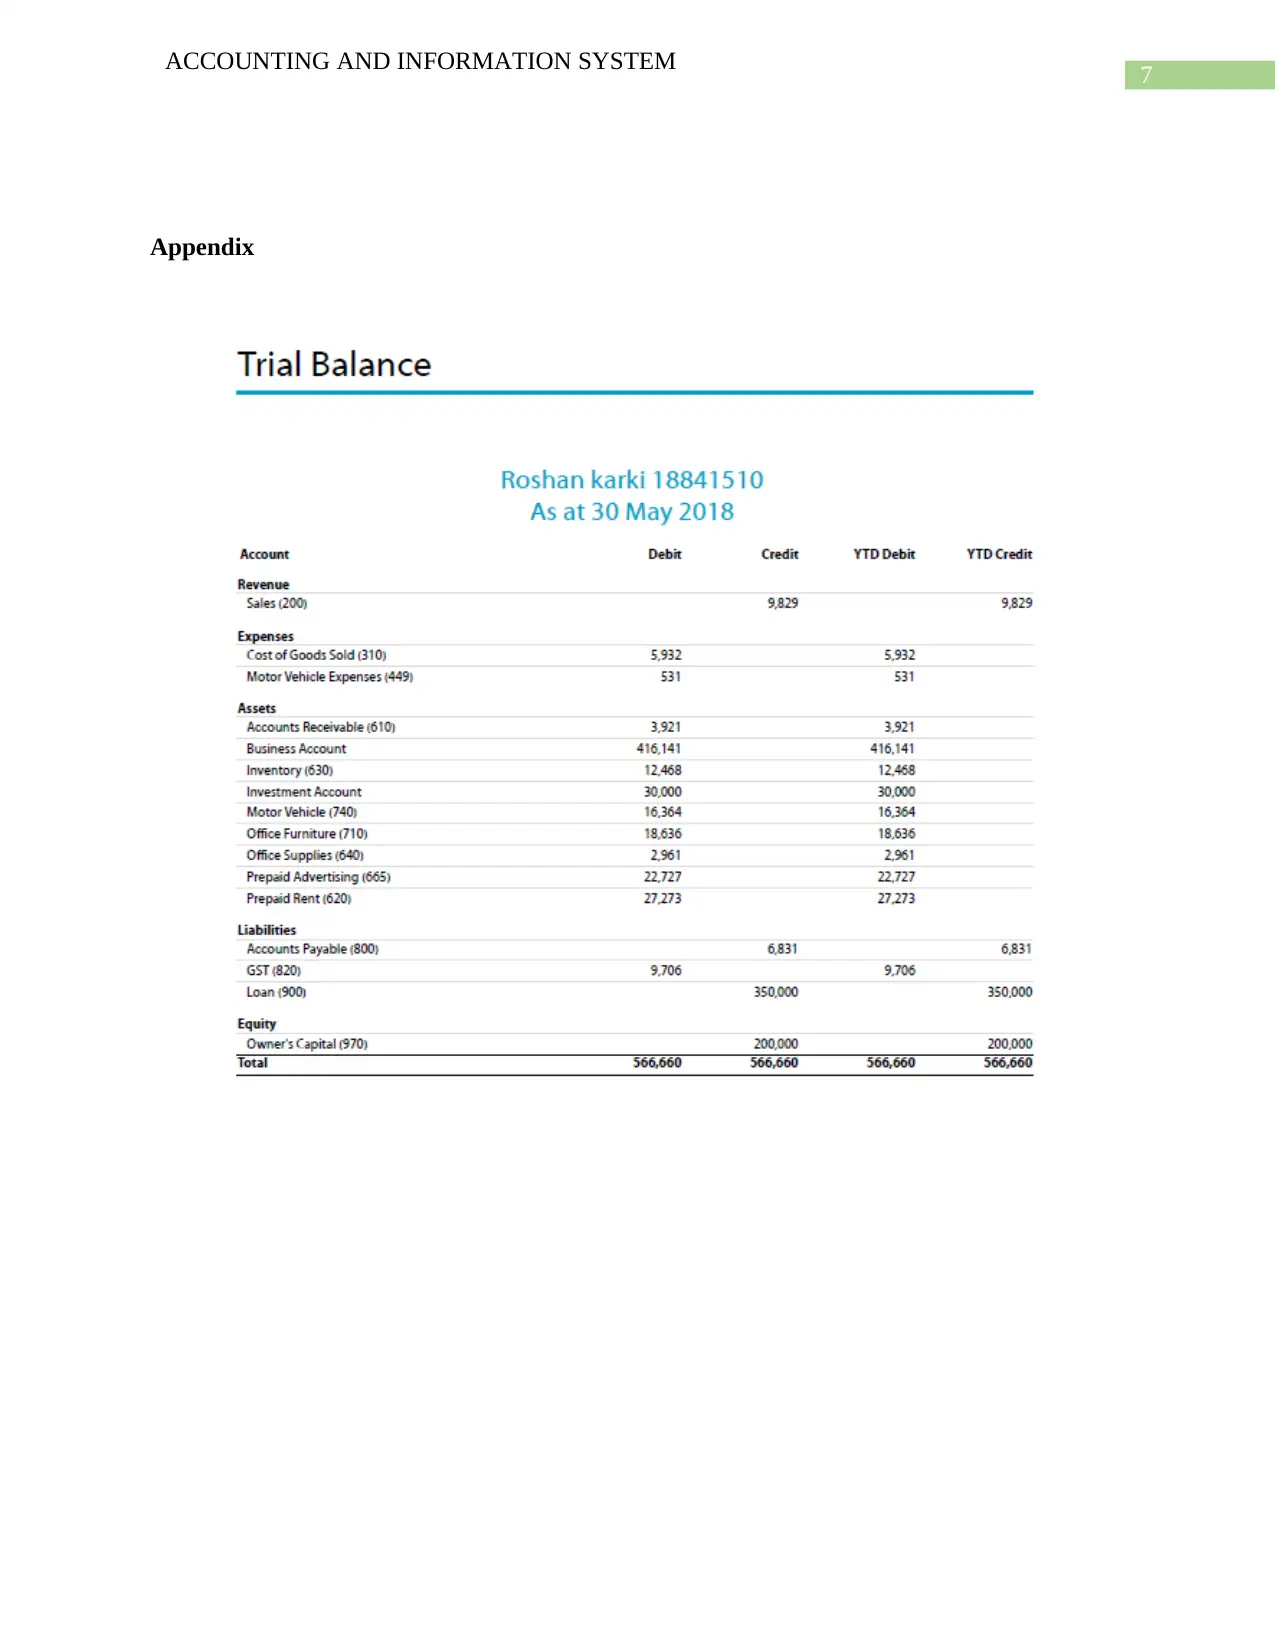
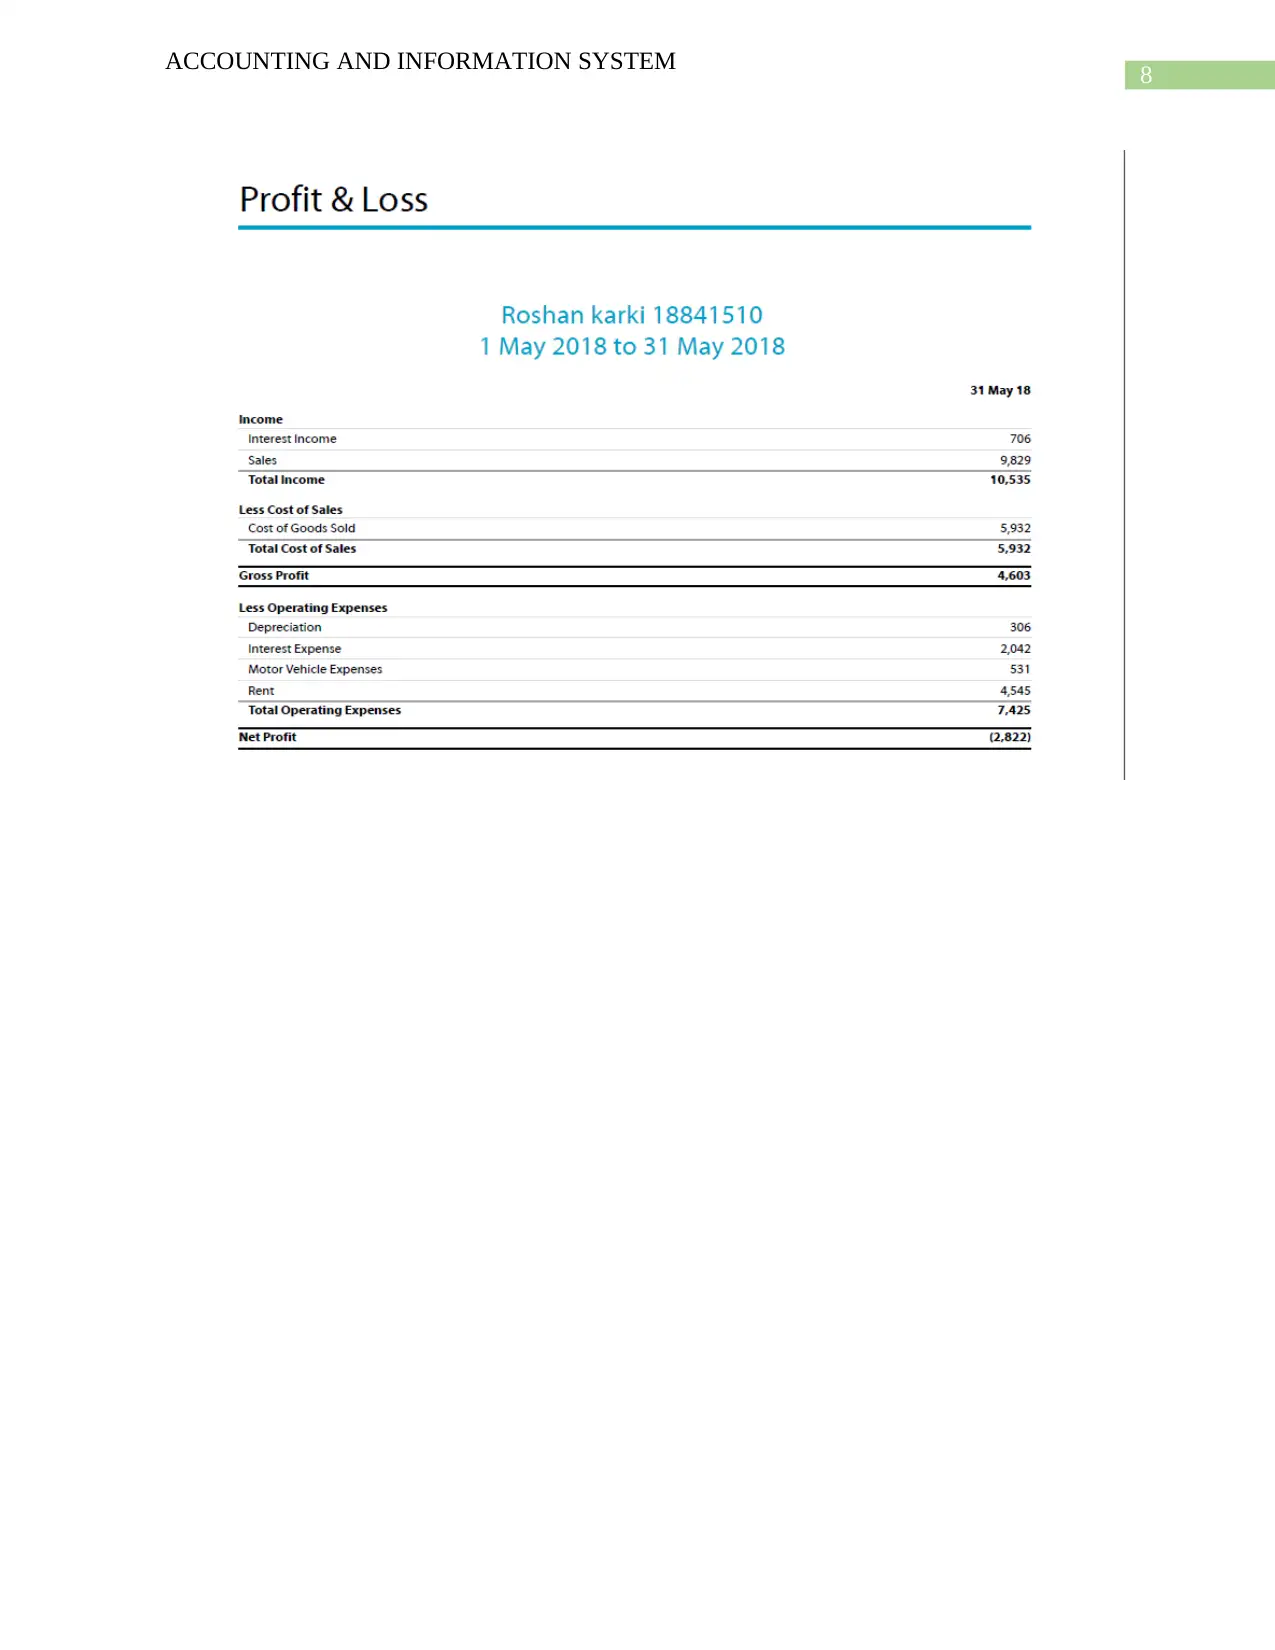
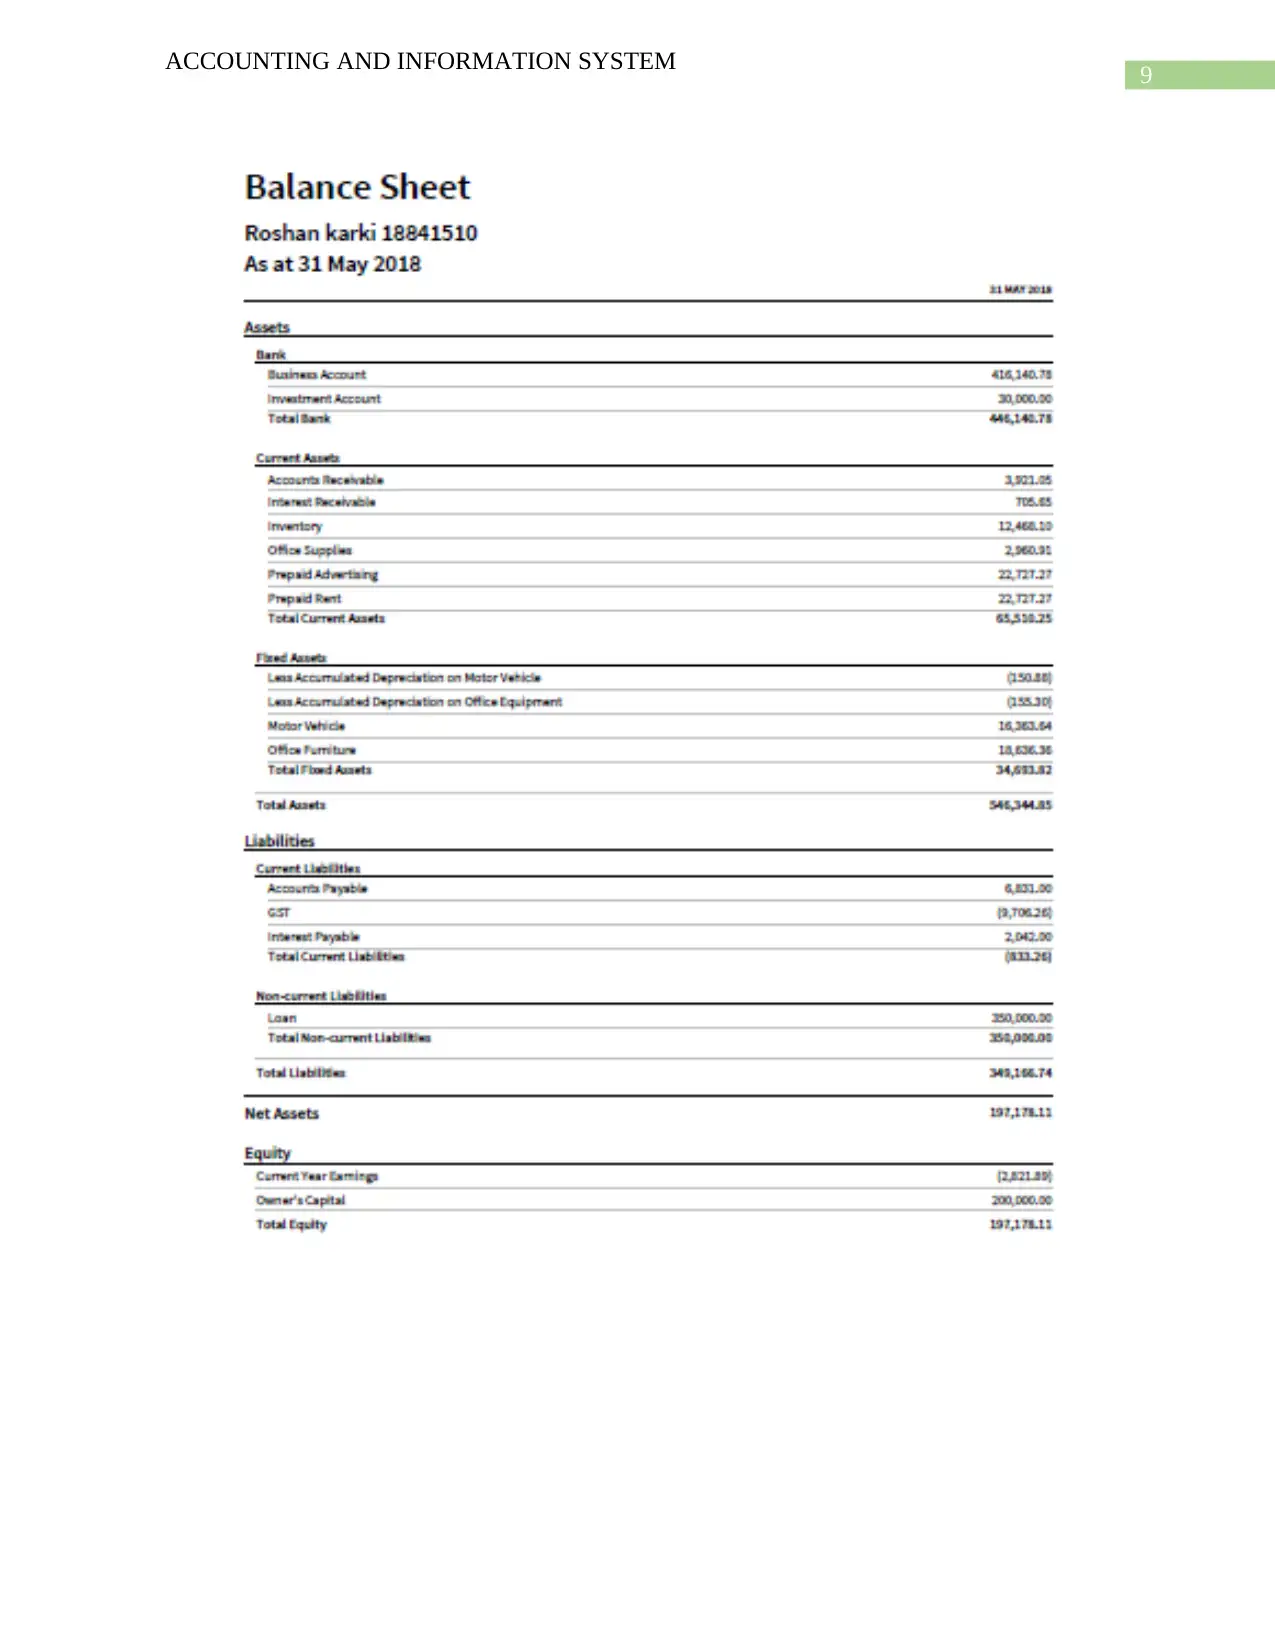
This report provides a financial analysis of Roshan Karki Company for the month of May, focusing on their accounting information system. It examines the company's transactions, journal entries, ledger accounts, and trial balance to assess financial accuracy. The analysis includes a review of the income statement, highlighting sales, interest income, and operating expenses such as rent, interest, depreciation, and motor vehicle expenses. A pie chart visually represents the distribution of operating expenses. The balance sheet is also analyzed, detailing liquid and current assets, including accounts receivable, inventory, and prepaid expenses, along with current liabilities like accounts payable and GST expenses. The report concludes with an overview of the company's financial position, noting a net loss for the month and providing a comprehensive view of its assets, liabilities, and equity.
Document Page
Running head: ACCOUNTING AND INFORMATION SYSTEM
Accounting and Information System
Name of the Student:
Name of the University:
Author’s Note:
tabler-icon-diamond-filled.svg

Secure Best Marks with AI Grader

Need help grading? Try our AI Grader for instant feedback on your assignments.
Document Page
1
ACCOUNTING AND INFORMATION SYSTEM
Table of Contents
Introduction......................................................................................................................................2
Financial Analysis...........................................................................................................................2
Reference.........................................................................................................................................6
Appendix..........................................................................................................................................7
Document Page
2
ACCOUNTING AND INFORMATION SYSTEM
Introduction
The report focuses on the analysis of financial statements which are prepared for Roshan
Karki Company. The financial analysis is to be conducted for the month of May. The
transactions which are undertaken by the business are recorded in the books of accounts of the
company and for the same journal entries are passed. On the basis of such journal entries, ledger
accounts and trial balance are prepared which are shown in the appendix below. The company
for which the transactions are being analyzed is engaged in the business of buying and selling of
socks. The report will be analyzing the items which are included in the income statement,
balance sheet and trial balance.
Financial Analysis
The transaction which Roshan Karki company made during the month of May are
depicted in the books of accounts which are prepared by the business. The business has prepared
the trial balance so as to ensure that there are no mistakes in terms of accuracy of the books of
accounts (Bray 2013).
As per the trial balance, the company has shown sales of $ 9,829 for the months which
has a credit balance as per trail balance. The trial balance also shows the various expenses and
loss which are incurred by the company during the month and in addition to this, the assets and
liabilities of the business are also shown in the trial balance of the company. The trial balance as
prepared by the business matches which means that there is no presence of an accuracy errors
which are detectable by the trial balance (Awosejo, Kekwaletswe and Pretorius 2014). The major
expenses which the business incurs which is directly related to the sales of the product is cost of
Document Page
3
ACCOUNTING AND INFORMATION SYSTEM
good sold which is shown in the trial balance as well as the profit and loss account as $ 5,932.
The trial balance totals as shown in the appendix section comes to $ 566,660.
The profit and loss account of the business which is also known as the income statement
of the company shows the profitability of the business (Elrod, Murray and Bande 2013). In the
case of the company, the business has incurred a loss as shown by the income statement as
prepared by the company for the month of May. The loss which is incurred by the business for
the month of May is $ 2,822. The major source of income for the business is shown to be sales of
the goods manufactured by the business which is shown to be $ 9,829. The other income which
the business earns during the year comes from interest earned which is shown to $ 706. For a
better presentation of the operating expenses of the business, a pie chart is shown below:
4%
28%
7%
61%
Operating Expenses
Depreciation
Interest Expense
Motor Vehicle Expenses
Rent
Figure 1: (Pie Chart Showing Expenses of the Company for the Month of May)
Source: (Created by Author)
tabler-icon-diamond-filled.svg

Secure Best Marks with AI Grader

Need help grading? Try our AI Grader for instant feedback on your assignments.
Document Page
4
ACCOUNTING AND INFORMATION SYSTEM
As shown in the above Pie Chart, a significant portion of the operating expenses of the
business comprises of rent which forms a major part of the expenses and the same is shown to be
61% of the total expenses which the business has incurred during the month (Rødseth, Skarlo
and Schjølberg 2015). In addition to this, the business has incurred interest expenses which is
due to the loan which is taken by the business which is shown in the balance sheet of the
company. The expenses which are relating to rent and interest expenses are shown as $ 4,545 and
$ 2042 during the month. The other expenses which are shown in the income statement are
depreciation and Motor vehicle expenses. Both theses expenses are related to the assets which
are shown in the balance sheet of the company for the month. The expenses which is related to
depreciation arises when the assets value decreases due to wear and tear of the assets. The
expenses relating to motor vehicles are shown as $ 531 and depreciation expenses is shown to be
$ 306. The profit and loss statement is shown to be unfavorable for the month as the business has
incur losses which may be due to the increase in the operating expenses of the business for the
month.
The balance sheet is a statement which shows the financial position of the company at the
end of a particular period (Kapan and Minoiu 2013). The balance sheet shows all the assets and
liabilities of the business which the business possesses during such a period. As per the balance
sheet prepared by the business, the liquid assets of the business is shown to be $ 446,140.78. The
liquid assets of the company consist of bank balance and liquid investments (Lewis 2013). The
current assets of the business totals to be $ 65,510.25 as shown in the balance sheet which is
prepared by the company. The various items which makes the current assets of the business are
shown in a graphical presentation as shown below:
Document Page
5
ACCOUNTING AND INFORMATION SYSTEM
Accounts
Receivable
Interest
Receivable
Inventory Office
Supplies
Prepaid
Advertising
Prepaid Rent
0.00
5,000.00
10,000.00
15,000.00
20,000.00
25,000.00
Current Assets
Figure 2: (Chart Showing Current Assets of the Company for the Month of May)
Source: (Created by Author)
As per the graph which is shown in the above figure, depicts the current assets which the
business possesses during the month. The major part of the current assets is made up of prepaid
incomes which are prepaid rent and prepaid advertisement. Both the figures are shown to be $
22,727.27 for the month of May. The inventories which forms a major part of the current assets
of the business is shown to be $ 12,468.10 as shown in the graph above. The current liabilities of
the business comprise of account payables, GST expenses and the interest which is still
outstanding and the business is liable to pay (Koo 2013). The total of the assets side and the
equity and liabilities side of the company always matches and the same is totaled and shown as $
546.344.85. The total of the equity is shown to be $ 200,000 minus the losses which the business
has incurred during the month of May.
Document Page
6
ACCOUNTING AND INFORMATION SYSTEM
Reference
Awosejo, O.J., Kekwaletswe, R. and Pretorius, P., 2014. Recommendation of Information
Systems to Motivate Accounting Firm in South Africa. Lecture Notes on Information
Theory, 2(4).
Bray, F.S., 2013. Social accounts and the business enterprise sector of the national
economy (Vol. 2). Cambridge University Press.
Elrod, C., Murray, S. and Bande, S., 2013. A review of performance metrics for supply chain
management. Engineering Management Journal, 25(3), pp.39-50.
Kapan, M.T. and Minoiu, C., 2013. Balance sheet strength and bank lending during the global
financial crisis (No. 13-102). Internationa
Koo, R., 2013. Balance sheet recession as the ‘other half’of macroeconomics. European Journal
of Economics and Economic Policies: Intervention, 10(2), pp.136-157.
Lewis, M.K., 2013. Off-balance sheet activities and financial innovation in banking. PSL
Quarterly Review, 41(167).
Rødseth, H., Skarlo, T. and Schjølberg, P., 2015. Profit loss indicator: a novel maintenance
indicator applied for integrated planning. Advances in Manufacturing, 3(2), pp.139-150.
tabler-icon-diamond-filled.svg

Paraphrase This Document

Need a fresh take? Get an instant paraphrase of this document with our AI Paraphraser
Document Page
7
ACCOUNTING AND INFORMATION SYSTEM
Appendix
Document Page
8
ACCOUNTING AND INFORMATION SYSTEM
Document Page
9
ACCOUNTING AND INFORMATION SYSTEM
chevron_up_icon
1 out of 10
circle_padding
hide_on_mobile
zoom_out_icon
logo.png

Your All-in-One AI-Powered Toolkit for Academic Success.

Available 24*7 on WhatsApp / Email

[object Object]