Financial Decision Making Report: Financial Analysis of Acquisition
VerifiedAdded on 2023/01/17
|17
|4280
|87
Report
AI Summary
This report provides a comprehensive financial analysis of a potential acquisition, likely focusing on Starbucks. It begins with an executive summary and an industry review of the coffee sector, highlighting its growth and opportunities. The core of the report involves a detailed performance analysis, including income statements, balance sheets, and cash flow analysis of a target company (Roast Ltd). Key financial ratios like profitability, liquidity, and solvency ratios are evaluated to assess the financial health of the target. The report then delves into investment appraisal techniques, such as payback period, accounting rate of return, net present value, and discusses potential sources of funding for the acquisition. The analysis includes a working capital analysis and a discussion on dividend policy. The financial statements are used to assess the company's performance and make financial decisions. The report concludes with an assessment of the financial position of the company and its potential for acquisition, making recommendations based on the financial data provided. This report is a valuable resource for students studying finance and business, offering insights into real-world financial decision-making processes.

Financial Decision Making
Paraphrase This Document
Need a fresh take? Get an instant paraphrase of this document with our AI Paraphraser
Table of Contents
EXECUTIVE SUMMARY.............................................................................................................3
PART-1- Industry review................................................................................................................3
PART-2: Performance analysis .......................................................................................................4
2.1 Statement of the income statement .......................................................................................4
2.2 Statement of balance sheet or financial position....................................................................5
2.3 cash flow analysis .................................................................................................................7
PART-3............................................................................................................................................9
3.1 Investment appraisal..............................................................................................................9
3.2 Sources through which funds could be raised .....................................................................12
REFERENCES................................................................................................................................1
EXECUTIVE SUMMARY
Financial decision making is defined as the deciding a single option form various
different alternative relating to the financial decisions of the company. The finance is the most
crucial part in the business because without finance no work can be done and it is very difficult
to work without money. Hence, it is very necessary for the company to select the cheapest source
of finance so that all the operations of the company can be carried on by the company in
successful manner. The present report is based on the analysis that whether Starbucks need to
acquire its target company or not. For analysing the attractiveness of the acquisition, the
company analyses the financial statements of the company in order to ascertain its financial
position and the financial performance of the target company. Further the report has discussed
the investment appraisal options for the acquisition with the help of the analysis of different
investment appraisal criteria. These criterion are like payback period, accounting rate of return,
net present value and many others. In the end the discussion held was on the different sources of
finance. This is very necessary because of the fact that finance need to be taken from outside so
it is very essential to have low cost of borrowing money form others.
PART-1- Industry review
The coffee industry has gained the success of 20 consecutive years and is still growing
and booming industry. The total estimated contribution of coffee industry in the Gross Value
Added to the GDP of UK was £3.7 billion in 2017. The growth rate of UK coffee industry was
around 7 % from 2012 to 2017. Also, this industry provides employment opportunities for the
country and the employees in the coffee industry was around 133,965 in the year 2017 (UK
coffee market analysis published, 2018). From the different survey it was outlined that the on an
average approximately 95 million of cups are consumed on daily basis in UK. This industry is
performing exceptionally well as the industry and the profits from it is growing to a great extent.
But then also there are many different opportunities and challenges with the industry.
The major opportunity for the coffee industry is the changes taking place in the
technology. This is a very crucial and important opportunity which needs to be undertaken by the
coffee industry. This is majorly due to the fact that the technology will assist the coffee industry
in simplifying the work of producing the coffee and to improve the quality of the product and
⊘ This is a preview!⊘
Do you want full access?
Subscribe today to unlock all pages.
Trusted by 1+ million students worldwide
services. Also, this is an opportunity because of the fact that the use of technology reduces the
human effort and this can be used in some other place.
The major challenge for the coffee industry is that the consumer taste and preferences and
the perception of the consumers relating to coffee and its consumption is fast changing. Thus, it
is very crucial for the coffee industry in UK to continuously monitor the needs and changing
expectation of the consumers in order to earn more of the profits and grow and develop the
industry.
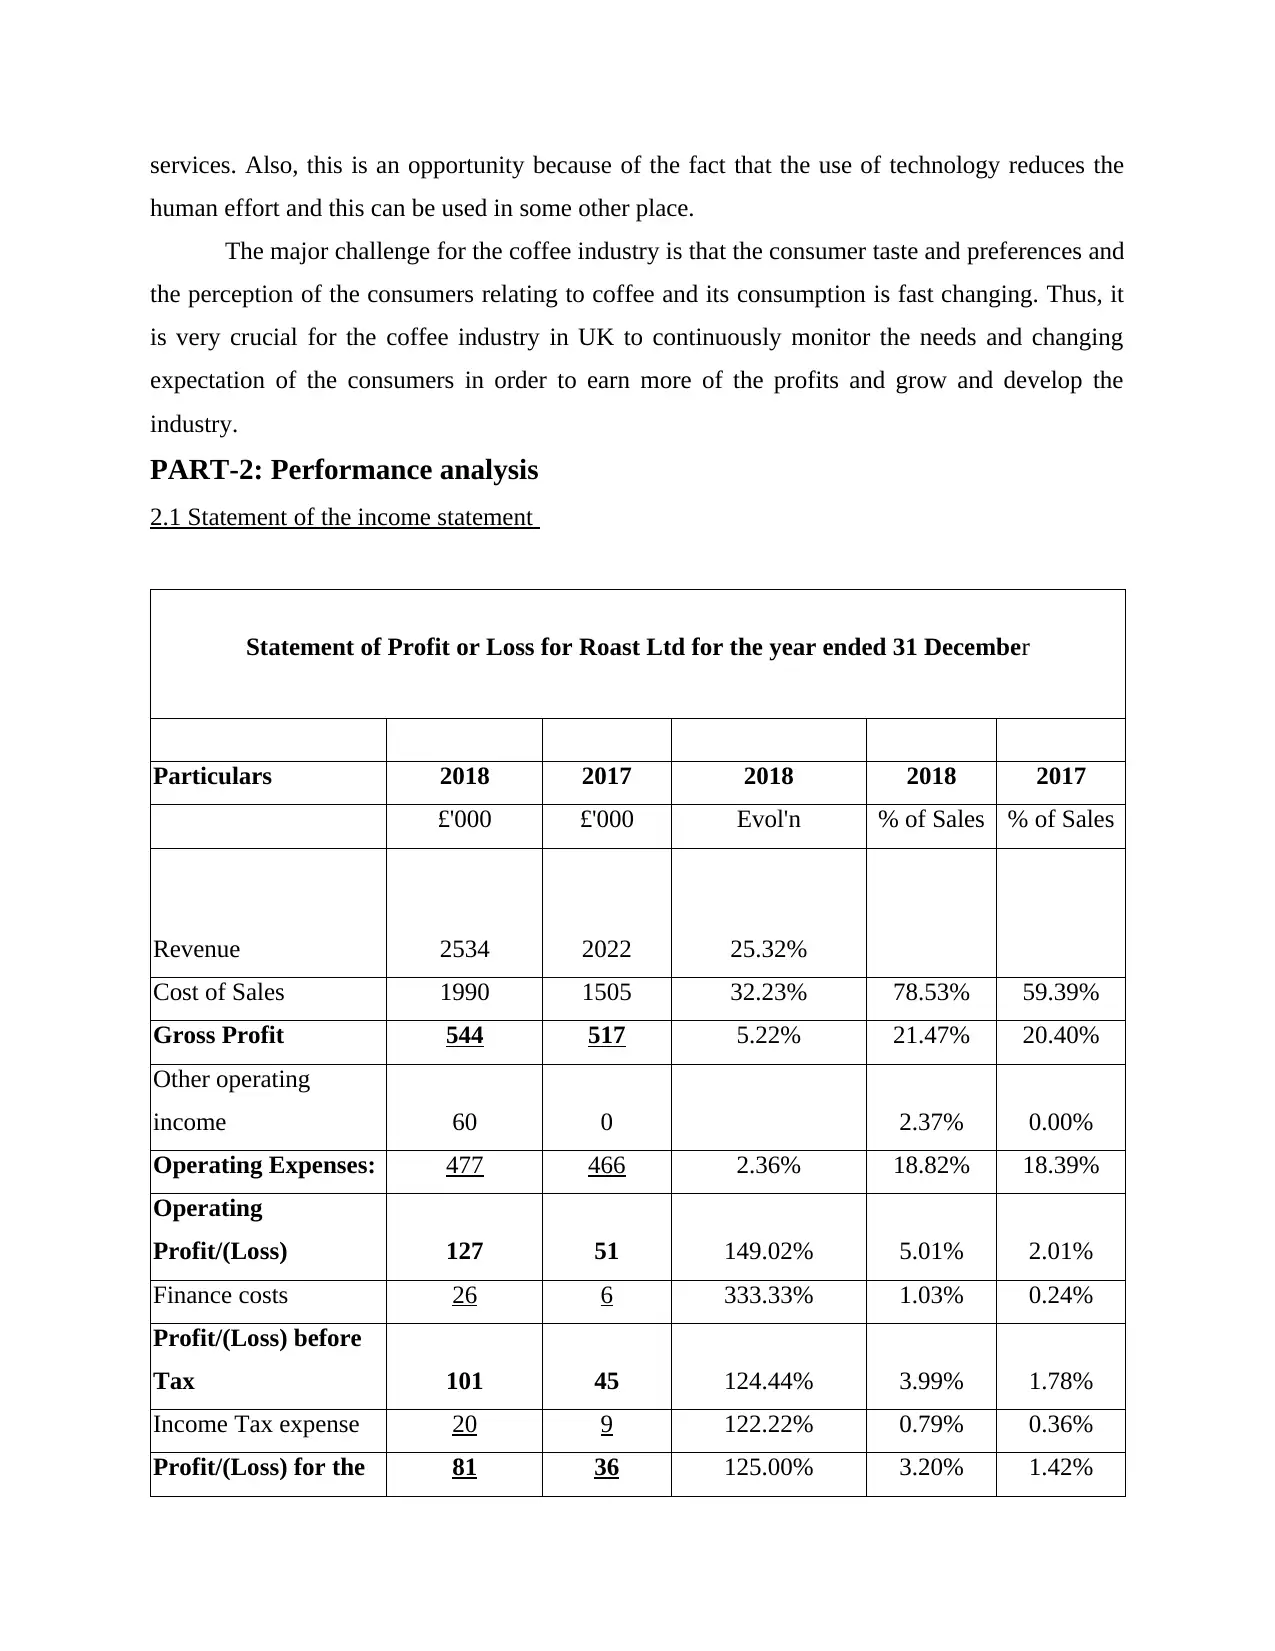
PART-2: Performance analysis
2.1 Statement of the income statement
Statement of Profit or Loss for Roast Ltd for the year ended 31 December
Particulars 2018 2017 2018 2018 2017
£'000 £'000 Evol'n % of Sales % of Sales
Revenue 2534 2022 25.32%
Cost of Sales 1990 1505 32.23% 78.53% 59.39%
Gross Profit 544 517 5.22% 21.47% 20.40%
Other operating
income 60 0 2.37% 0.00%
Operating Expenses: 477 466 2.36% 18.82% 18.39%
Operating
Profit/(Loss) 127 51 149.02% 5.01% 2.01%
Finance costs 26 6 333.33% 1.03% 0.24%
Profit/(Loss) before
Tax 101 45 124.44% 3.99% 1.78%
Income Tax expense 20 9 122.22% 0.79% 0.36%
Profit/(Loss) for the 81 36 125.00% 3.20% 1.42%
human effort and this can be used in some other place.
The major challenge for the coffee industry is that the consumer taste and preferences and
the perception of the consumers relating to coffee and its consumption is fast changing. Thus, it
is very crucial for the coffee industry in UK to continuously monitor the needs and changing
expectation of the consumers in order to earn more of the profits and grow and develop the
industry.
PART-2: Performance analysis
2.1 Statement of the income statement
Statement of Profit or Loss for Roast Ltd for the year ended 31 December
Particulars 2018 2017 2018 2018 2017
£'000 £'000 Evol'n % of Sales % of Sales
Revenue 2534 2022 25.32%
Cost of Sales 1990 1505 32.23% 78.53% 59.39%
Gross Profit 544 517 5.22% 21.47% 20.40%
Other operating
income 60 0 2.37% 0.00%
Operating Expenses: 477 466 2.36% 18.82% 18.39%
Operating
Profit/(Loss) 127 51 149.02% 5.01% 2.01%
Finance costs 26 6 333.33% 1.03% 0.24%
Profit/(Loss) before
Tax 101 45 124.44% 3.99% 1.78%
Income Tax expense 20 9 122.22% 0.79% 0.36%
Profit/(Loss) for the 81 36 125.00% 3.20% 1.42%
Paraphrase This Document
Need a fresh take? Get an instant paraphrase of this document with our AI Paraphraser
period
Interpretation- from the above analysis it has been assessed that revenue over the year
increases and the cost sales with that of the revenue has also been increased. This resulted to
increase in the gross profits that is from 517 to 544. As per the vertical analysis the percentage
change in the operating expenses shows an increasing trend that in turn reflects a that the net
profit of the company increases which indicates a better financial performance of Roast limited.
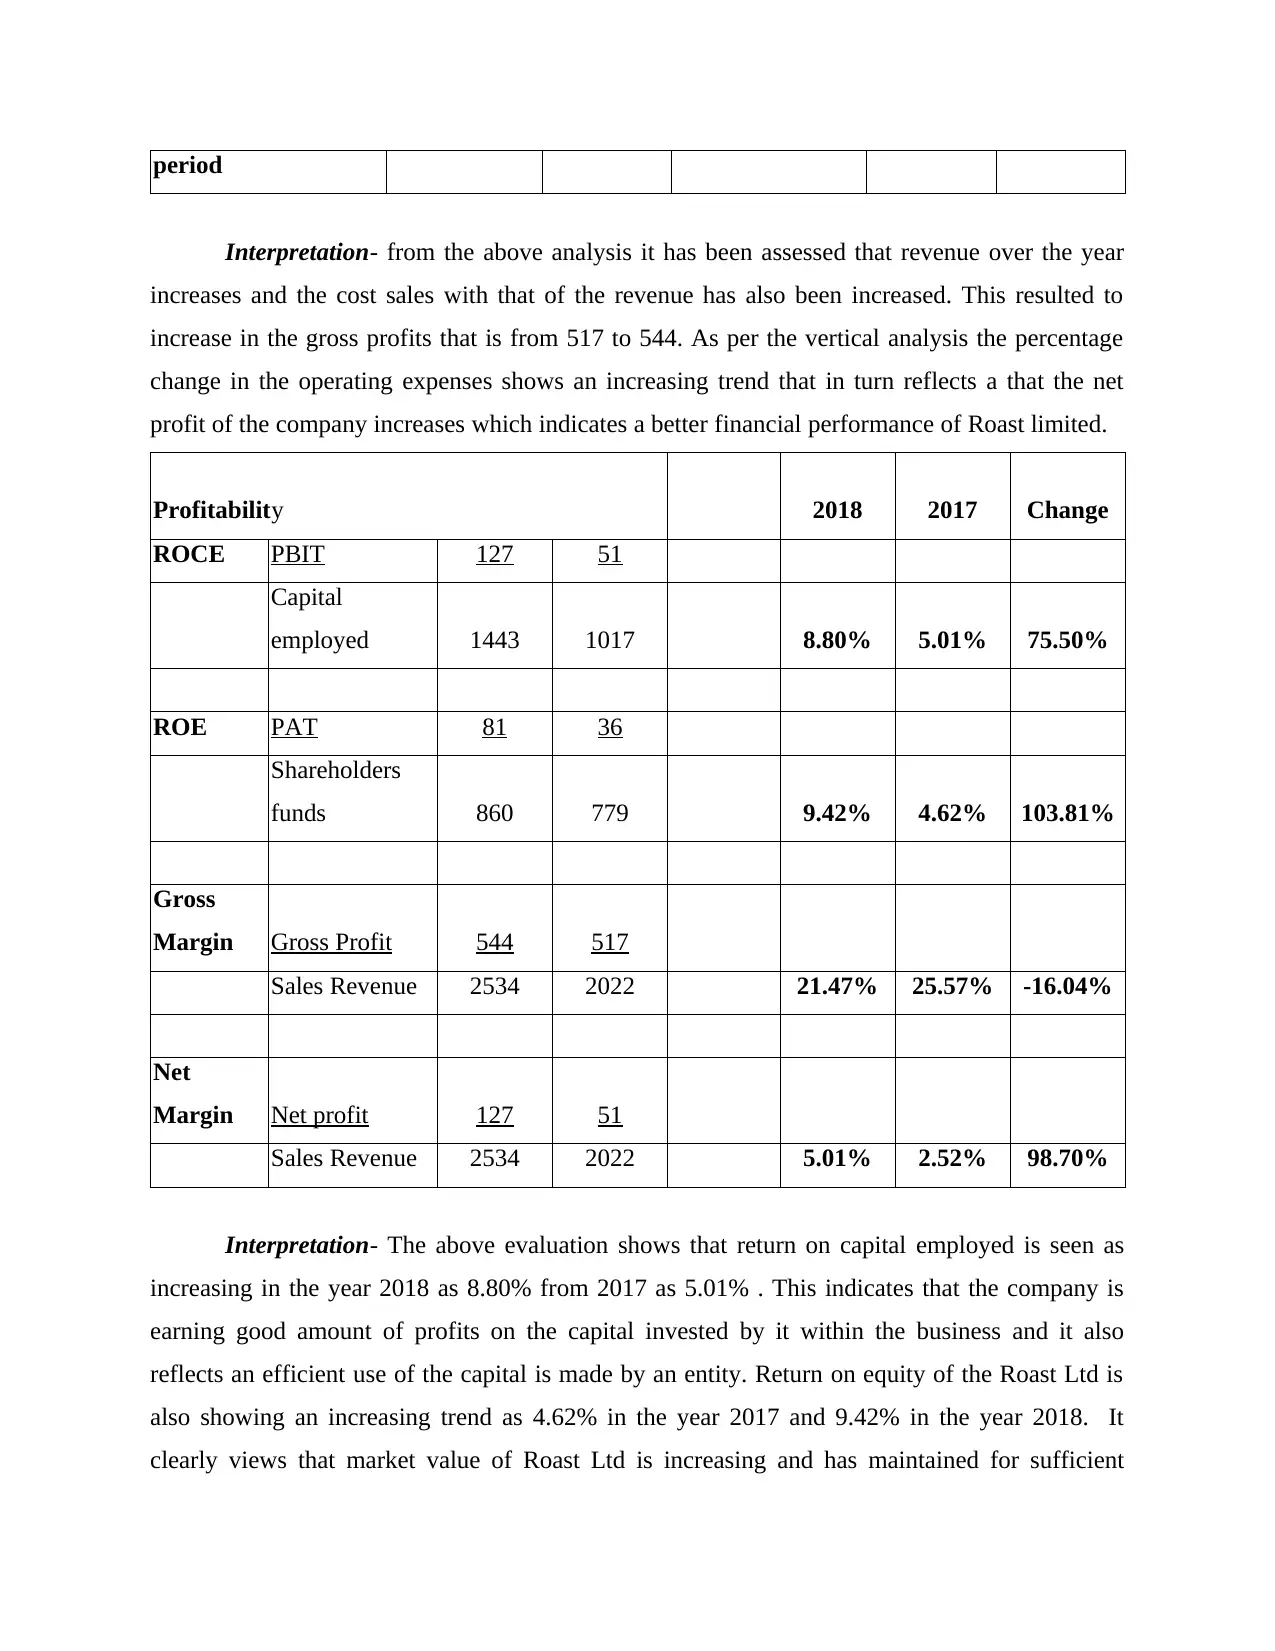
Profitability 2018 2017 Change
ROCE PBIT 127 51
Capital
employed 1443 1017 8.80% 5.01% 75.50%
ROE PAT 81 36
Shareholders
funds 860 779 9.42% 4.62% 103.81%
Gross
Margin Gross Profit 544 517
Sales Revenue 2534 2022 21.47% 25.57% -16.04%
Net
Margin Net profit 127 51
Sales Revenue 2534 2022 5.01% 2.52% 98.70%
Interpretation- The above evaluation shows that return on capital employed is seen as
increasing in the year 2018 as 8.80% from 2017 as 5.01% . This indicates that the company is
earning good amount of profits on the capital invested by it within the business and it also
reflects an efficient use of the capital is made by an entity. Return on equity of the Roast Ltd is
also showing an increasing trend as 4.62% in the year 2017 and 9.42% in the year 2018. It
clearly views that market value of Roast Ltd is increasing and has maintained for sufficient
Interpretation- from the above analysis it has been assessed that revenue over the year
increases and the cost sales with that of the revenue has also been increased. This resulted to
increase in the gross profits that is from 517 to 544. As per the vertical analysis the percentage
change in the operating expenses shows an increasing trend that in turn reflects a that the net
profit of the company increases which indicates a better financial performance of Roast limited.
Profitability 2018 2017 Change
ROCE PBIT 127 51
Capital
employed 1443 1017 8.80% 5.01% 75.50%
ROE PAT 81 36
Shareholders
funds 860 779 9.42% 4.62% 103.81%
Gross
Margin Gross Profit 544 517
Sales Revenue 2534 2022 21.47% 25.57% -16.04%
Net
Margin Net profit 127 51
Sales Revenue 2534 2022 5.01% 2.52% 98.70%
Interpretation- The above evaluation shows that return on capital employed is seen as
increasing in the year 2018 as 8.80% from 2017 as 5.01% . This indicates that the company is
earning good amount of profits on the capital invested by it within the business and it also
reflects an efficient use of the capital is made by an entity. Return on equity of the Roast Ltd is
also showing an increasing trend as 4.62% in the year 2017 and 9.42% in the year 2018. It
clearly views that market value of Roast Ltd is increasing and has maintained for sufficient
reserves which results in generating higher returns. The gross profit margin of the company from
one accounting period to another is decreasing which states that the cost relating to sales or
production is not been controlled adequately. Moreover, net profit ratio reflects a rising trend
that is increases from 2.52% to 5.01% which indicates a better performance of the company and
has the capability in earning larger profits after payment off all the expenses and tax obligations.
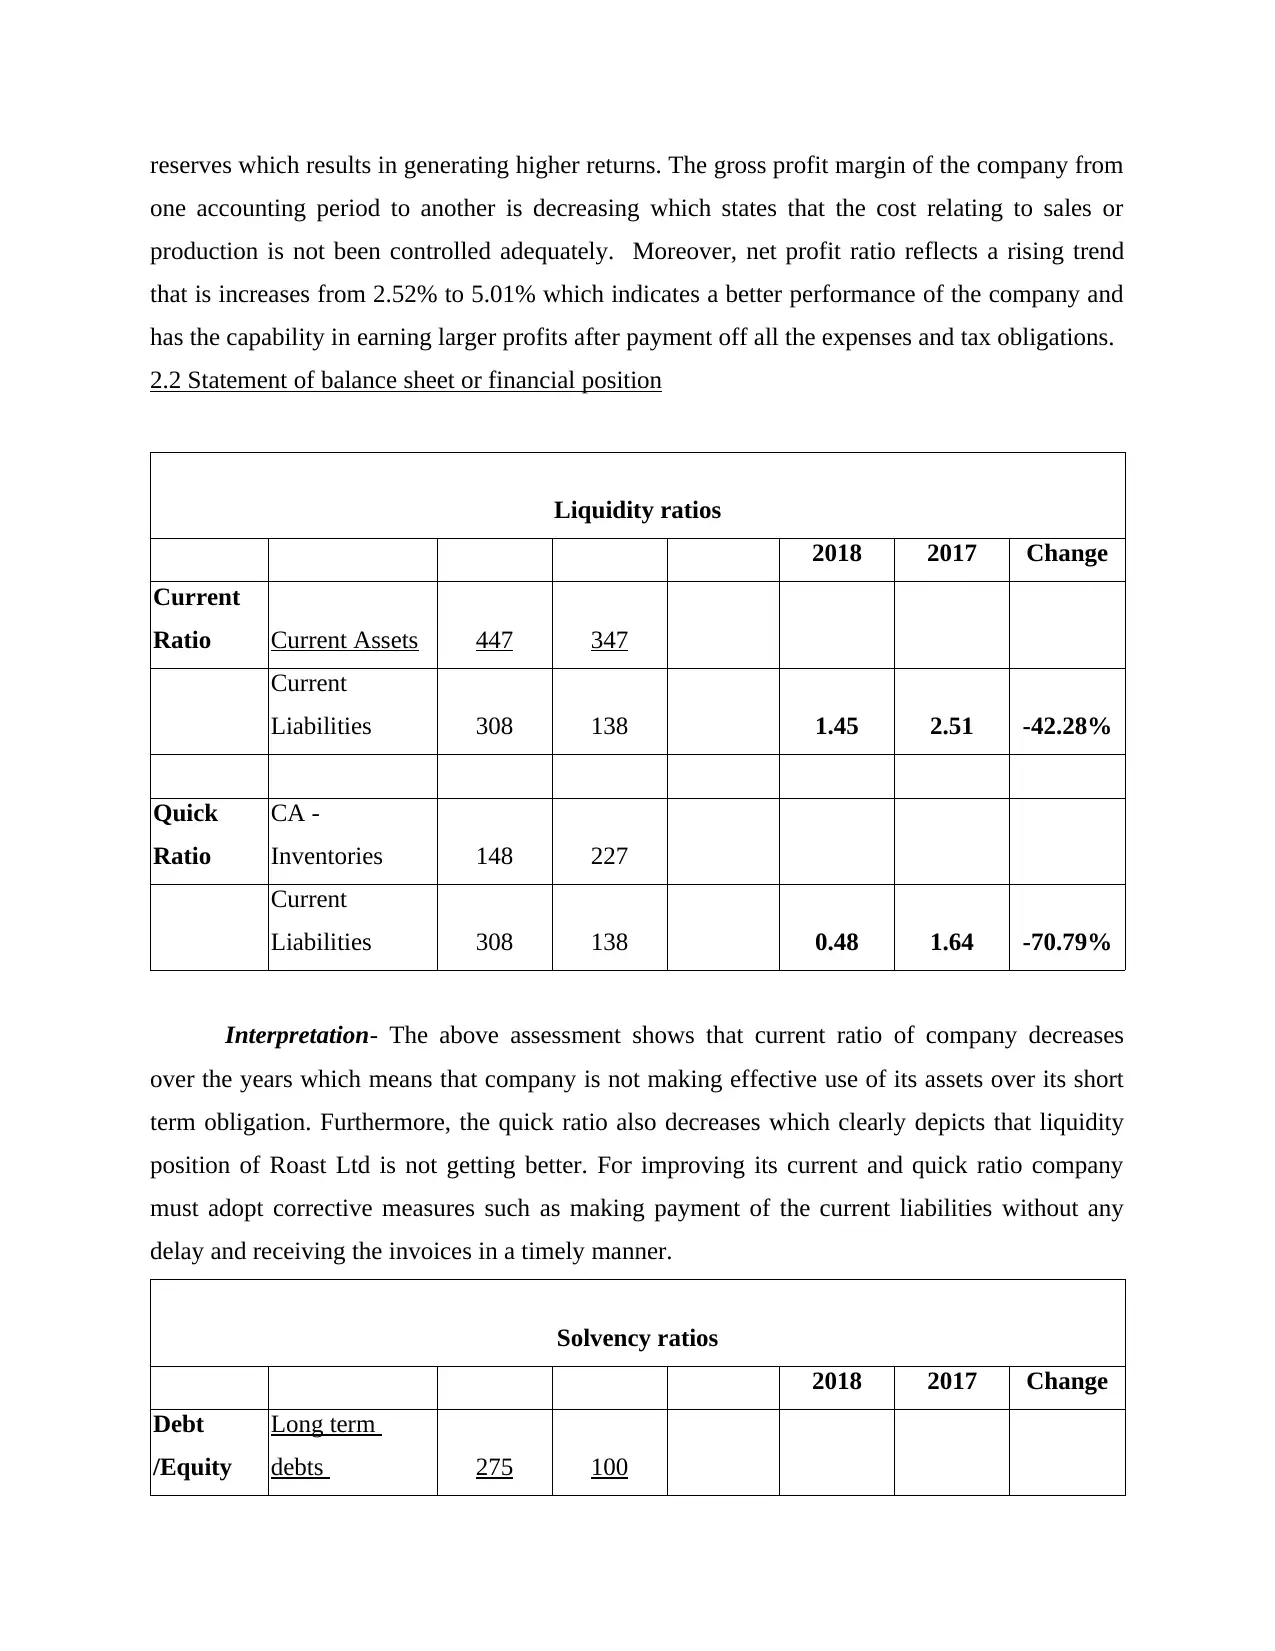
2.2 Statement of balance sheet or financial position
Liquidity ratios
2018 2017 Change
Current
Ratio Current Assets 447 347
Current
Liabilities 308 138 1.45 2.51 -42.28%
Quick
Ratio
CA -
Inventories 148 227
Current
Liabilities 308 138 0.48 1.64 -70.79%
Interpretation- The above assessment shows that current ratio of company decreases
over the years which means that company is not making effective use of its assets over its short
term obligation. Furthermore, the quick ratio also decreases which clearly depicts that liquidity
position of Roast Ltd is not getting better. For improving its current and quick ratio company
must adopt corrective measures such as making payment of the current liabilities without any
delay and receiving the invoices in a timely manner.
Solvency ratios
2018 2017 Change
Debt
/Equity
Long term
debts 275 100
one accounting period to another is decreasing which states that the cost relating to sales or
production is not been controlled adequately. Moreover, net profit ratio reflects a rising trend
that is increases from 2.52% to 5.01% which indicates a better performance of the company and
has the capability in earning larger profits after payment off all the expenses and tax obligations.
2.2 Statement of balance sheet or financial position
Liquidity ratios
2018 2017 Change
Current
Ratio Current Assets 447 347
Current
Liabilities 308 138 1.45 2.51 -42.28%
Quick
Ratio
CA -
Inventories 148 227
Current
Liabilities 308 138 0.48 1.64 -70.79%
Interpretation- The above assessment shows that current ratio of company decreases
over the years which means that company is not making effective use of its assets over its short
term obligation. Furthermore, the quick ratio also decreases which clearly depicts that liquidity
position of Roast Ltd is not getting better. For improving its current and quick ratio company
must adopt corrective measures such as making payment of the current liabilities without any
delay and receiving the invoices in a timely manner.
Solvency ratios
2018 2017 Change
Debt
/Equity
Long term
debts 275 100
⊘ This is a preview!⊘
Do you want full access?
Subscribe today to unlock all pages.
Trusted by 1+ million students worldwide
Equity 860 779 31.98% 12.84% 149.10%
Gearing
Interest bearing
debt 275 100
IBD + Equity 1135 879 24.23% 11.38% 112.97%
Interest
cover EBIT 127 51
Finance costs 26 6 4.88 8.5 -42.53%
Dividend
cover PAT 81 36 0 1.2 -
Dividend 0 30
Dividend
per share Dividend 0 30
No. of ordinary
shares 200 0.15 -
Interpretation- Overall the solvency position of Roast Ltd is getting affected adversely as
it long term debts are increasing over its equities that in turn results in rising debt equity ratio.
This shows the company is incapable in meeting its long term obligation and has funded its
projects through higher borrowings. The Interest coverage ratio is decreasing which means that
Roast Ltd does not have sufficient profits in bearing its interest obligation as it had high value of
finance cost. The Dividend coverage ratio and dividend per share resulted as 0 in 2018 which
reflects that the company had not paid or distributed dividend to its shareholders in the current
year. Thus, this clearly views that the solvency and financial position of Roast Ltd is not sound
and better over an accounting period.
2.3 cash flow analysis
Cash flow refers to the statements that represent all the cash activities carried by
organisations during the period. Cash flow statements represents all the inflow and outflow of
Paraphrase This Document
Need a fresh take? Get an instant paraphrase of this document with our AI Paraphraser
cash during the given periods. Cash flow statements are prepared as per the given standard and
guidelines of authorities. It represent the cash position of company at the end of the period.
Positive cash represents that company has managed the cash balances effectively in running the
operations where the negative balance represents that company has run out of cash. It has not
been able to manage the activities of company effectively.
Roast ltd commenced the business year with £134 of cash funds. The funds were for running the
operations successfully and at the end company had a negative cash balance of £73. Negative
balance can impact the business significantly therefore it is important to identify the reasons
behind going negative in cash. Business needs cash for running the various business operations
that are known as operating activities. Company for meeting the objectives of expansion made
high inventory purchases as the prices may rise next year. Purchases will support the spending in
initial year of outlets. Other spendings during the year were on purchasing the properties and
equipments for opening of outlets in Romania. Most of the funding for the project is done by
personal funding sources. Some of the funds were raised by Roast ltd by the banks and financial
institutions on interests. Company's negative cash balance can have negative impact in the
market served by company. Property and equipment expenditures were the major cause of
running out of cash. But roast ltd have to take considerable steps for improving its cash position.
Stakeholders have serious concerns regarding the liquidity of company therefore for avoiding
any negative consequence it should turn the negative to positive as early as possible.
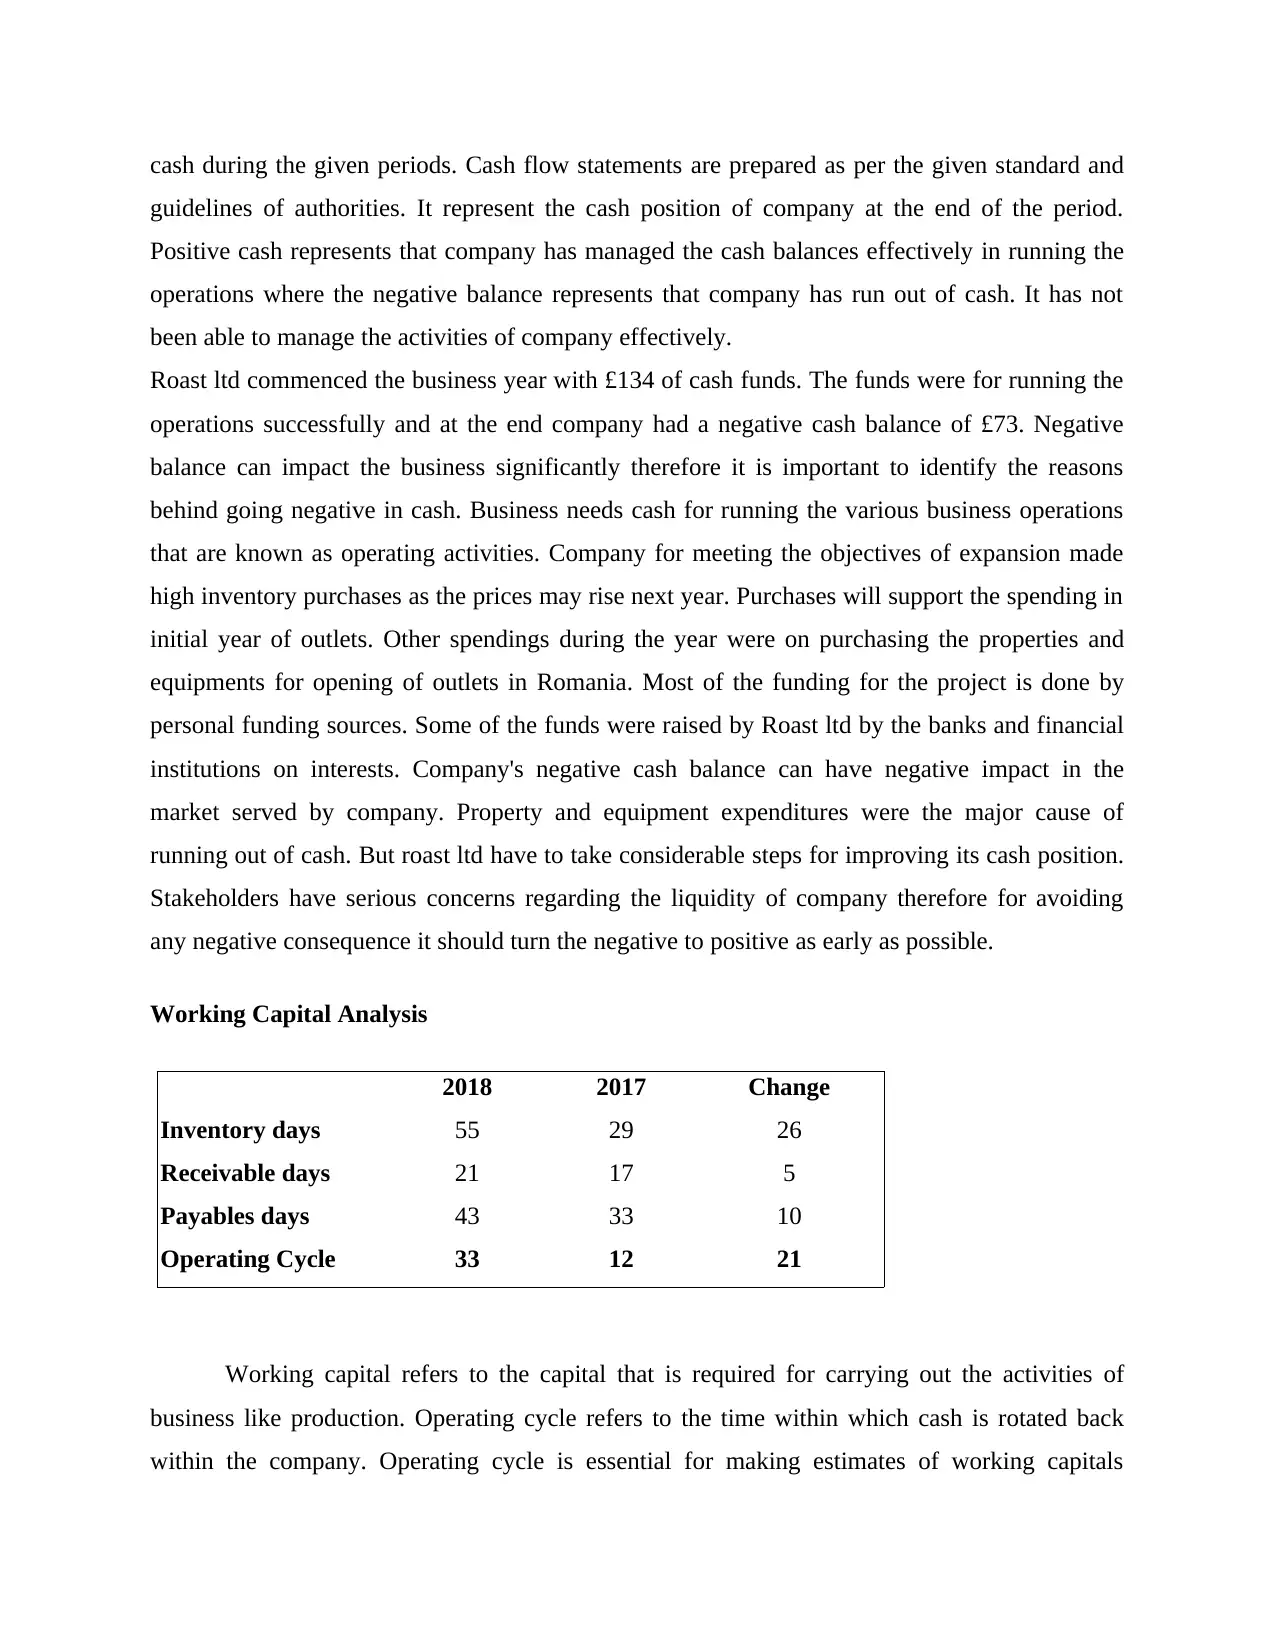
Working Capital Analysis
2018 2017 Change
Inventory days 55 29 26
Receivable days 21 17 5
Payables days 43 33 10
Operating Cycle 33 12 21
Working capital refers to the capital that is required for carrying out the activities of
business like production. Operating cycle refers to the time within which cash is rotated back
within the company. Operating cycle is essential for making estimates of working capitals
guidelines of authorities. It represent the cash position of company at the end of the period.
Positive cash represents that company has managed the cash balances effectively in running the
operations where the negative balance represents that company has run out of cash. It has not
been able to manage the activities of company effectively.
Roast ltd commenced the business year with £134 of cash funds. The funds were for running the
operations successfully and at the end company had a negative cash balance of £73. Negative
balance can impact the business significantly therefore it is important to identify the reasons
behind going negative in cash. Business needs cash for running the various business operations
that are known as operating activities. Company for meeting the objectives of expansion made
high inventory purchases as the prices may rise next year. Purchases will support the spending in
initial year of outlets. Other spendings during the year were on purchasing the properties and
equipments for opening of outlets in Romania. Most of the funding for the project is done by
personal funding sources. Some of the funds were raised by Roast ltd by the banks and financial
institutions on interests. Company's negative cash balance can have negative impact in the
market served by company. Property and equipment expenditures were the major cause of
running out of cash. But roast ltd have to take considerable steps for improving its cash position.
Stakeholders have serious concerns regarding the liquidity of company therefore for avoiding
any negative consequence it should turn the negative to positive as early as possible.
Working Capital Analysis
2018 2017 Change
Inventory days 55 29 26
Receivable days 21 17 5
Payables days 43 33 10
Operating Cycle 33 12 21
Working capital refers to the capital that is required for carrying out the activities of
business like production. Operating cycle refers to the time within which cash is rotated back
within the company. Operating cycle is essential for making estimates of working capitals
requirements of company. Company with lower operating cycle requires less cash for
maintaining the business operations.
Roast ltd has working capital of £212 and the operating cash cycle of 33 days. There is
significant increase in the operating cycle of company by 21 days. The steps should be taken by
the organisations for shortening the cash cycle. As cycle of company has increased they would
be requiring ,more of the funds for running the activities. Company has increased the receivables
days for attracting new customers for company. Though it has increased the cycle but this is
essential for dragging more business. Increase in creditors periods will give time to company in
arranging for funds for repayments. Days are increased by suppliers as it had made bulk
purchases for the inventory. The inventory of company includes purchases for new outlets that
has increased the inventory days. The bulk purchases has helped in gaining quality products at
the discounted prices.
Dividend policy decision
Dividend refers to return on investments. Dividends are paid by company when it has
adequate profits and it want to distribute proportion of profits to its shareholders. Company has
not paid dividend though profitability of company has increased to 5%a from 2.5%, which is a
significant increase. This raises question as company had paid dividend in the reduced profit
where no dividend for current year. Decision of management of not paying the dividends is right
as company though having profitability has negative cash balance. If company had paid
dividends the cash balance would have gone even more negative. Company in place of paying
dividends should use the funds for expansion plans and o turn its negative cash balance to
positive .
PART-3
3.1 Investment appraisal
Management forecast- As per the forecasting made by the managers it has been
interpreted that in the coming periods revenue of the company will he be increasing with
increase inn the variable cost and this resulted an increasing trend in the contribution. This shows
⊘ This is a preview!⊘
Do you want full access?
Subscribe today to unlock all pages.
Trusted by 1+ million students worldwide
that the profits of the company will also be increasing in the coming 5 years that in turn reflects
growing success in execution of the projects could be gained by Firm.
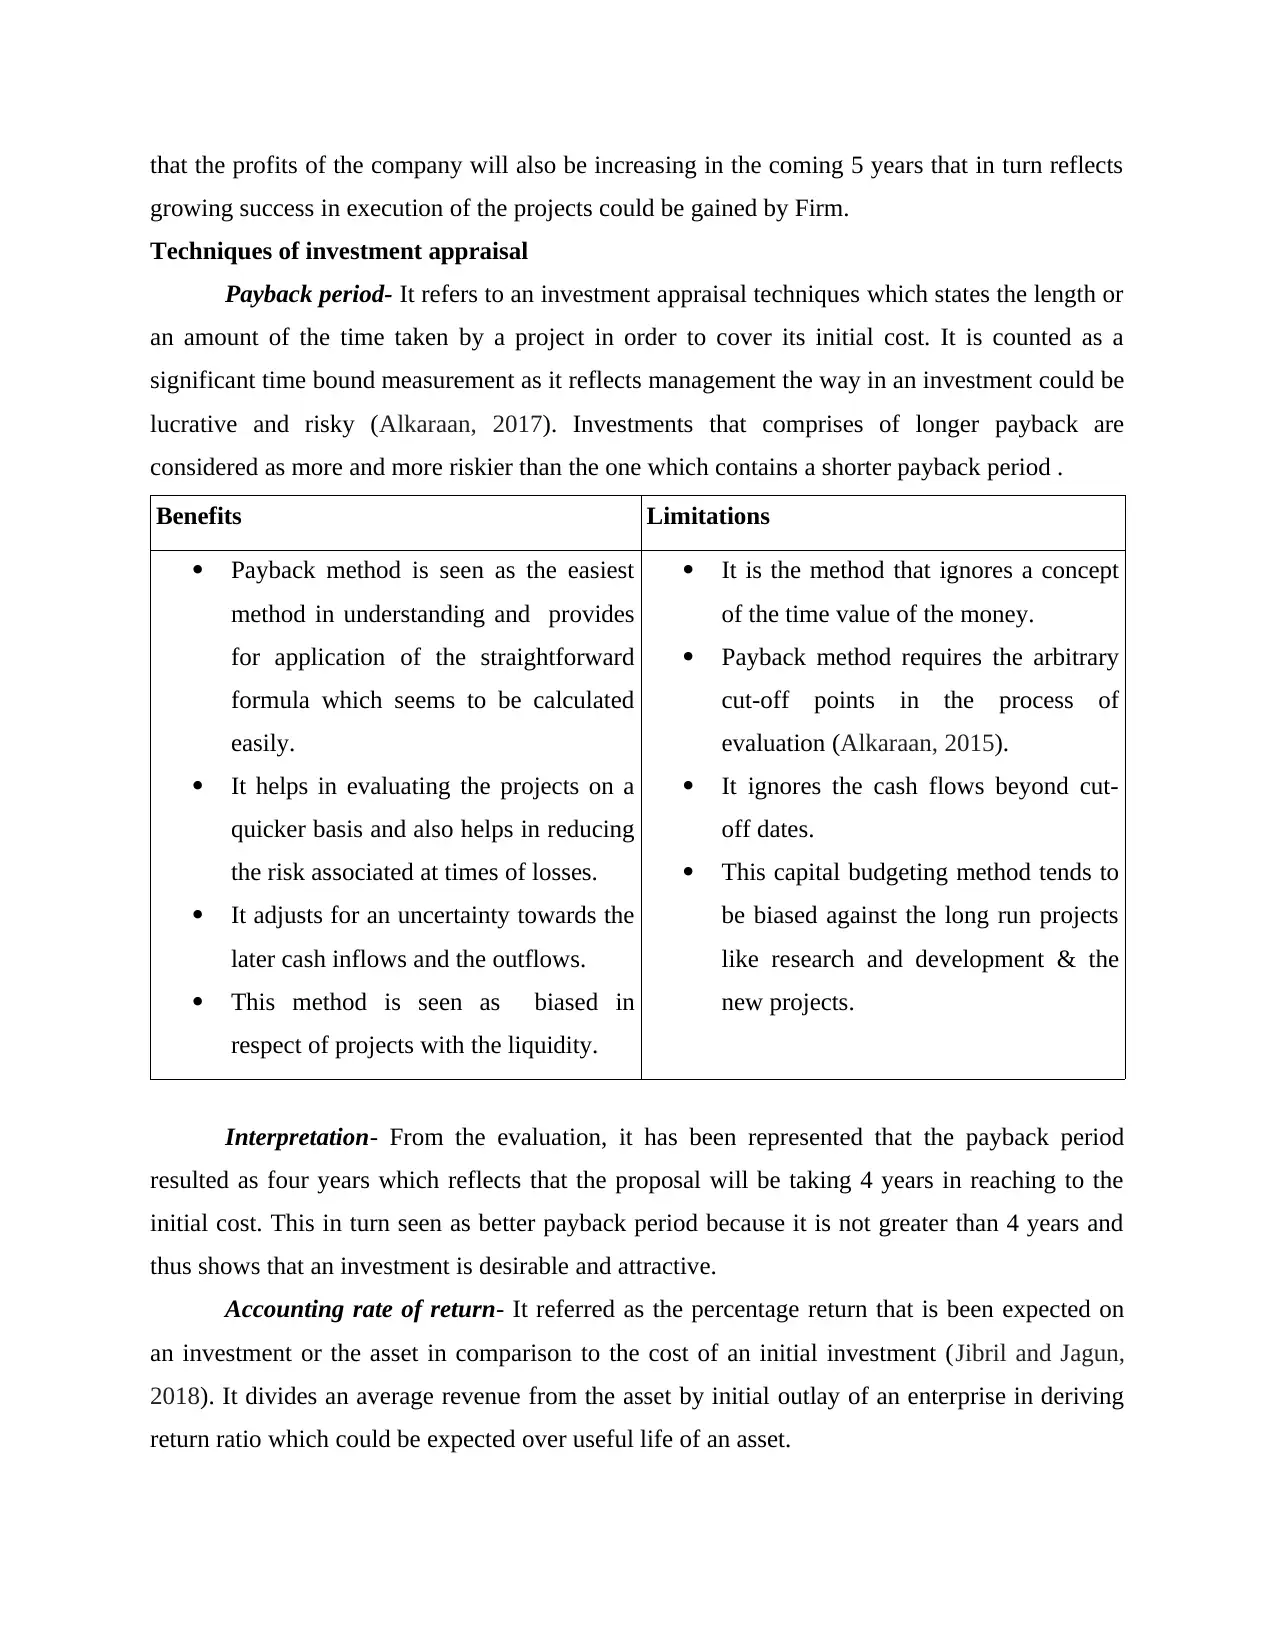
Techniques of investment appraisal
Payback period- It refers to an investment appraisal techniques which states the length or
an amount of the time taken by a project in order to cover its initial cost. It is counted as a
significant time bound measurement as it reflects management the way in an investment could be
lucrative and risky (Alkaraan, 2017). Investments that comprises of longer payback are
considered as more and more riskier than the one which contains a shorter payback period .
Benefits Limitations
Payback method is seen as the easiest
method in understanding and provides
for application of the straightforward
formula which seems to be calculated
easily.
It helps in evaluating the projects on a
quicker basis and also helps in reducing
the risk associated at times of losses.
It adjusts for an uncertainty towards the
later cash inflows and the outflows.
This method is seen as biased in
respect of projects with the liquidity.
It is the method that ignores a concept
of the time value of the money.
Payback method requires the arbitrary
cut-off points in the process of
evaluation (Alkaraan, 2015).
It ignores the cash flows beyond cut-
off dates.
This capital budgeting method tends to
be biased against the long run projects
like research and development & the
new projects.
Interpretation- From the evaluation, it has been represented that the payback period
resulted as four years which reflects that the proposal will be taking 4 years in reaching to the
initial cost. This in turn seen as better payback period because it is not greater than 4 years and
thus shows that an investment is desirable and attractive.
Accounting rate of return- It referred as the percentage return that is been expected on
an investment or the asset in comparison to the cost of an initial investment (Jibril and Jagun,
2018). It divides an average revenue from the asset by initial outlay of an enterprise in deriving
return ratio which could be expected over useful life of an asset.
growing success in execution of the projects could be gained by Firm.
Techniques of investment appraisal
Payback period- It refers to an investment appraisal techniques which states the length or
an amount of the time taken by a project in order to cover its initial cost. It is counted as a
significant time bound measurement as it reflects management the way in an investment could be
lucrative and risky (Alkaraan, 2017). Investments that comprises of longer payback are
considered as more and more riskier than the one which contains a shorter payback period .
Benefits Limitations
Payback method is seen as the easiest
method in understanding and provides
for application of the straightforward
formula which seems to be calculated
easily.
It helps in evaluating the projects on a
quicker basis and also helps in reducing
the risk associated at times of losses.
It adjusts for an uncertainty towards the
later cash inflows and the outflows.
This method is seen as biased in
respect of projects with the liquidity.
It is the method that ignores a concept
of the time value of the money.
Payback method requires the arbitrary
cut-off points in the process of
evaluation (Alkaraan, 2015).
It ignores the cash flows beyond cut-
off dates.
This capital budgeting method tends to
be biased against the long run projects
like research and development & the
new projects.
Interpretation- From the evaluation, it has been represented that the payback period
resulted as four years which reflects that the proposal will be taking 4 years in reaching to the
initial cost. This in turn seen as better payback period because it is not greater than 4 years and
thus shows that an investment is desirable and attractive.
Accounting rate of return- It referred as the percentage return that is been expected on
an investment or the asset in comparison to the cost of an initial investment (Jibril and Jagun,
2018). It divides an average revenue from the asset by initial outlay of an enterprise in deriving
return ratio which could be expected over useful life of an asset.
Paraphrase This Document
Need a fresh take? Get an instant paraphrase of this document with our AI Paraphraser
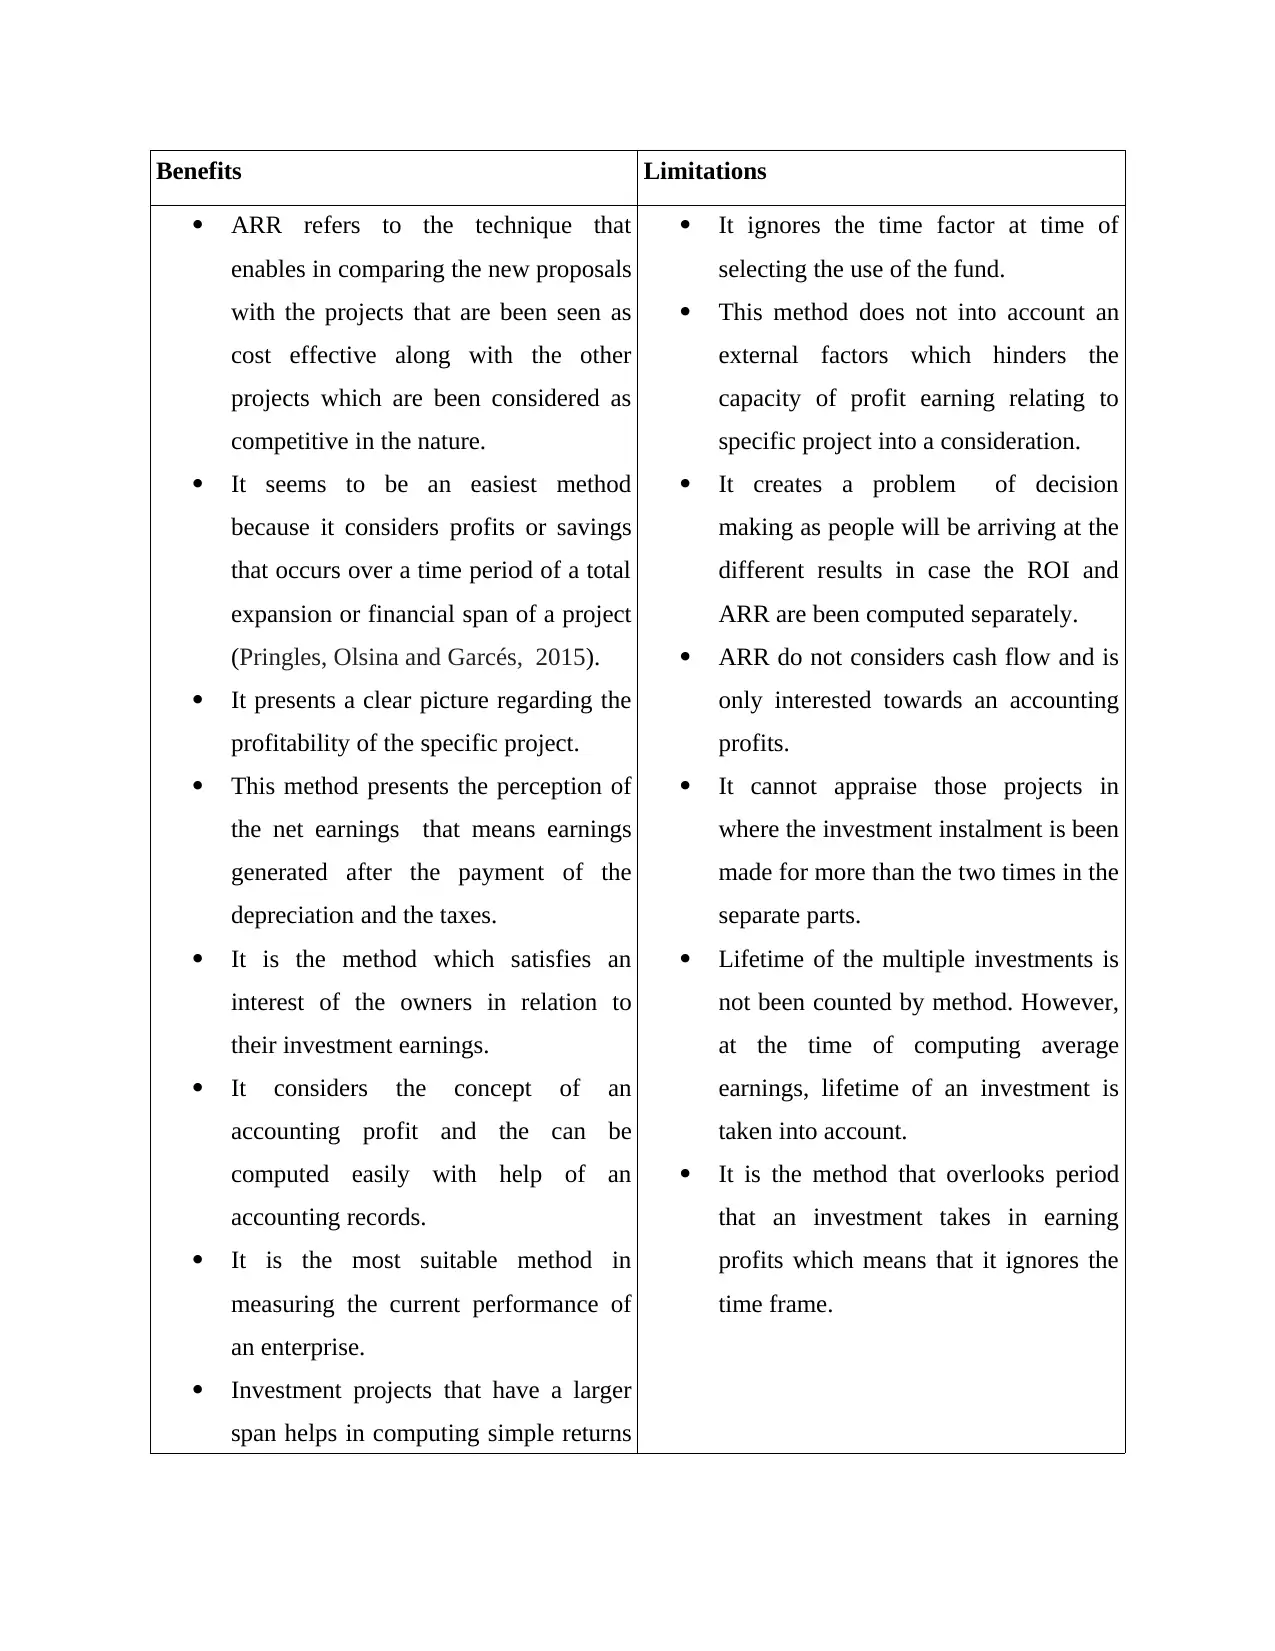
Benefits Limitations
ARR refers to the technique that
enables in comparing the new proposals
with the projects that are been seen as
cost effective along with the other
projects which are been considered as
competitive in the nature.
It seems to be an easiest method
because it considers profits or savings
that occurs over a time period of a total
expansion or financial span of a project
(Pringles, Olsina and Garcés, 2015).
It presents a clear picture regarding the
profitability of the specific project.
This method presents the perception of
the net earnings that means earnings
generated after the payment of the
depreciation and the taxes.
It is the method which satisfies an
interest of the owners in relation to
their investment earnings.
It considers the concept of an
accounting profit and the can be
computed easily with help of an
accounting records.
It is the most suitable method in
measuring the current performance of
an enterprise.
Investment projects that have a larger
span helps in computing simple returns
It ignores the time factor at time of
selecting the use of the fund.
This method does not into account an
external factors which hinders the
capacity of profit earning relating to
specific project into a consideration.
It creates a problem of decision
making as people will be arriving at the
different results in case the ROI and
ARR are been computed separately.
ARR do not considers cash flow and is
only interested towards an accounting
profits.
It cannot appraise those projects in
where the investment instalment is been
made for more than the two times in the
separate parts.
Lifetime of the multiple investments is
not been counted by method. However,
at the time of computing average
earnings, lifetime of an investment is
taken into account.
It is the method that overlooks period
that an investment takes in earning
profits which means that it ignores the
time frame.
with that of a true rate of return.
Interpretation- As stated greater the value of ARR higher earnings the project will
generate so the project with highest rate of return must be accepted (Babatunde, 2016). In this
project as per the management forecast, it has been seen that ARR resulted as 18% which
reflects that an investment tend to be highly profitable and larger returns will be gained in the
future periods.
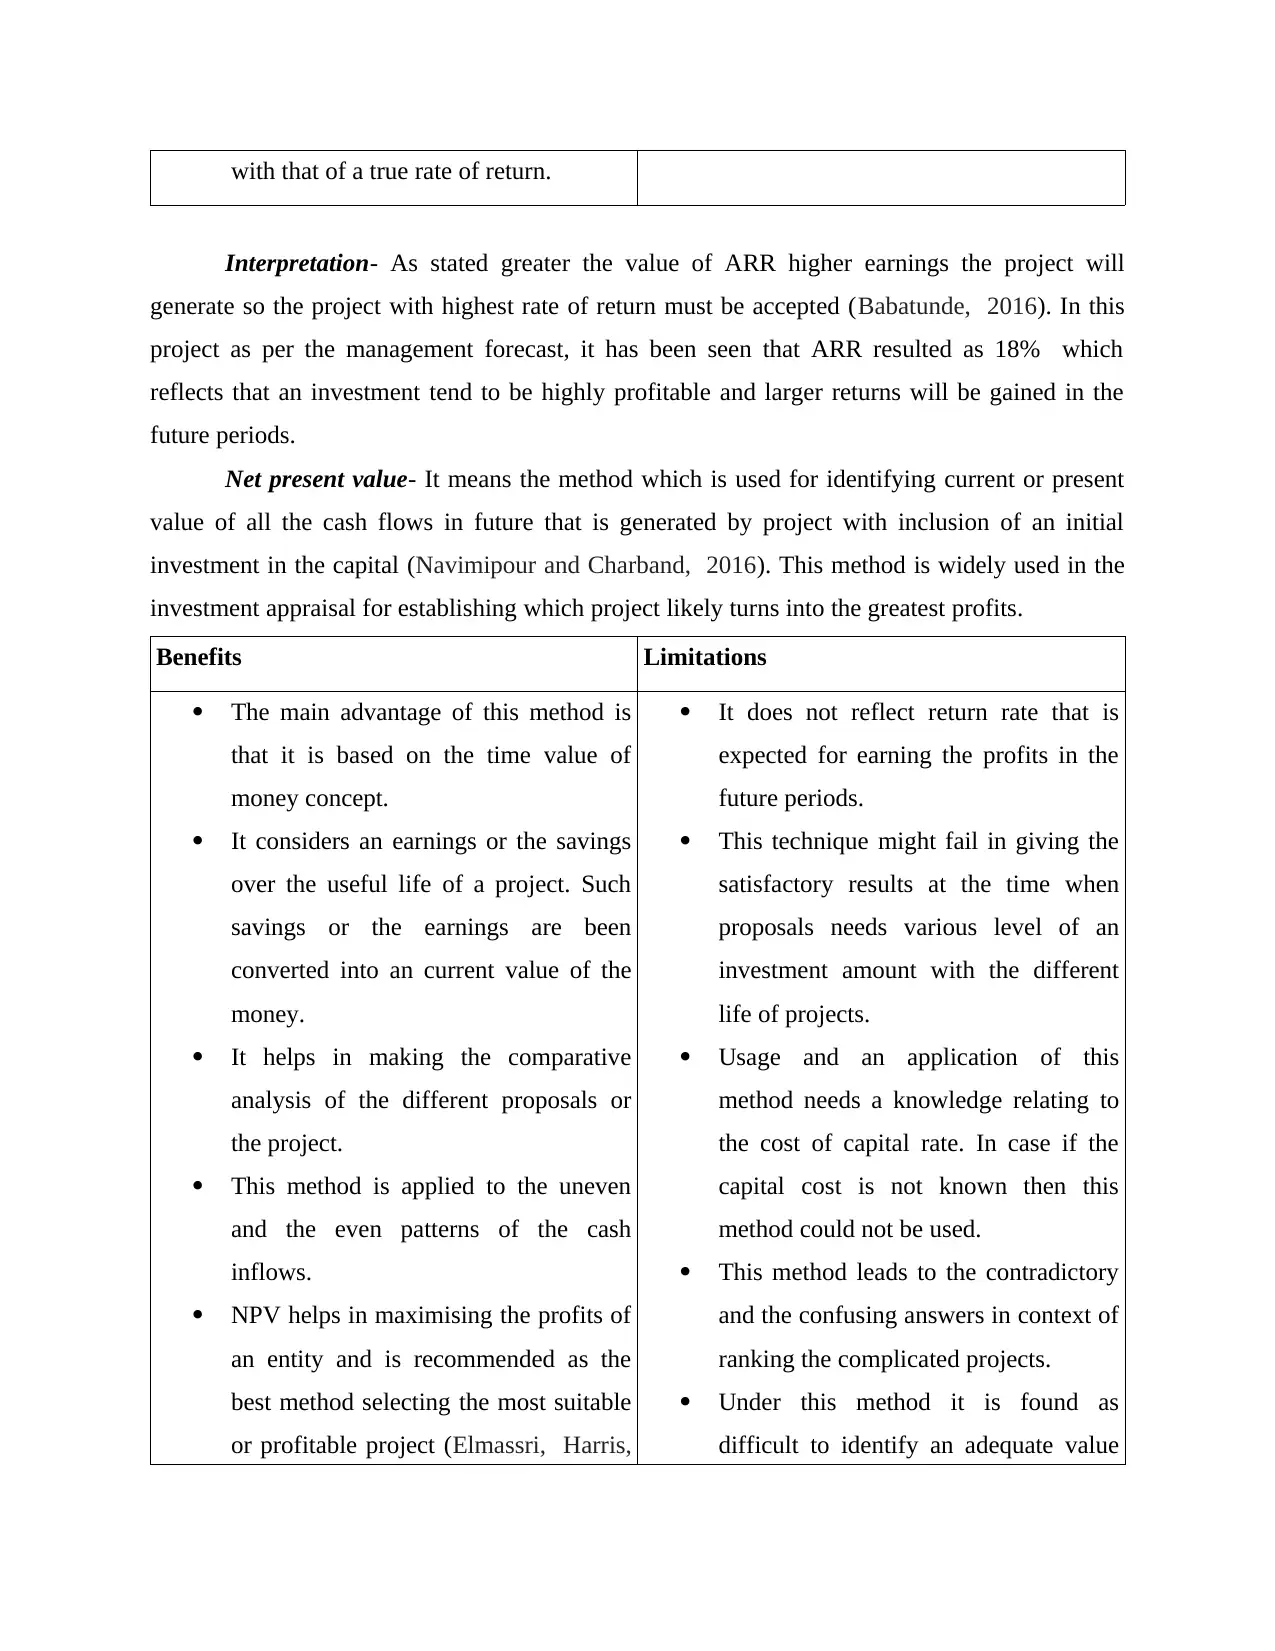
Net present value- It means the method which is used for identifying current or present
value of all the cash flows in future that is generated by project with inclusion of an initial
investment in the capital (Navimipour and Charband, 2016). This method is widely used in the
investment appraisal for establishing which project likely turns into the greatest profits.
Benefits Limitations
The main advantage of this method is
that it is based on the time value of
money concept.
It considers an earnings or the savings
over the useful life of a project. Such
savings or the earnings are been
converted into an current value of the
money.
It helps in making the comparative
analysis of the different proposals or
the project.
This method is applied to the uneven
and the even patterns of the cash
inflows.
NPV helps in maximising the profits of
an entity and is recommended as the
best method selecting the most suitable
or profitable project (Elmassri, Harris,
It does not reflect return rate that is
expected for earning the profits in the
future periods.
This technique might fail in giving the
satisfactory results at the time when
proposals needs various level of an
investment amount with the different
life of projects.
Usage and an application of this
method needs a knowledge relating to
the cost of capital rate. In case if the
capital cost is not known then this
method could not be used.
This method leads to the contradictory
and the confusing answers in context of
ranking the complicated projects.
Under this method it is found as
difficult to identify an adequate value
Interpretation- As stated greater the value of ARR higher earnings the project will
generate so the project with highest rate of return must be accepted (Babatunde, 2016). In this
project as per the management forecast, it has been seen that ARR resulted as 18% which
reflects that an investment tend to be highly profitable and larger returns will be gained in the
future periods.
Net present value- It means the method which is used for identifying current or present
value of all the cash flows in future that is generated by project with inclusion of an initial
investment in the capital (Navimipour and Charband, 2016). This method is widely used in the
investment appraisal for establishing which project likely turns into the greatest profits.
Benefits Limitations
The main advantage of this method is
that it is based on the time value of
money concept.
It considers an earnings or the savings
over the useful life of a project. Such
savings or the earnings are been
converted into an current value of the
money.
It helps in making the comparative
analysis of the different proposals or
the project.
This method is applied to the uneven
and the even patterns of the cash
inflows.
NPV helps in maximising the profits of
an entity and is recommended as the
best method selecting the most suitable
or profitable project (Elmassri, Harris,
It does not reflect return rate that is
expected for earning the profits in the
future periods.
This technique might fail in giving the
satisfactory results at the time when
proposals needs various level of an
investment amount with the different
life of projects.
Usage and an application of this
method needs a knowledge relating to
the cost of capital rate. In case if the
capital cost is not known then this
method could not be used.
This method leads to the contradictory
and the confusing answers in context of
ranking the complicated projects.
Under this method it is found as
difficult to identify an adequate value
⊘ This is a preview!⊘
Do you want full access?
Subscribe today to unlock all pages.
Trusted by 1+ million students worldwide
1 out of 17
Related Documents


Your All-in-One AI-Powered Toolkit for Academic Success.
+13062052269
info@desklib.com
Available 24*7 on WhatsApp / Email
![[object Object]](/_next/static/media/star-bottom.7253800d.svg)
Unlock your academic potential
Copyright © 2020–2026 A2Z Services. All Rights Reserved. Developed and managed by ZUCOL.