Comprehensive Financial Analysis of Actinogen Ltd. (2015-2016)
VerifiedAdded on 2020/03/23
|18
|2792
|30
Report
AI Summary
This report offers a comprehensive financial analysis of Actinogen Ltd., a biotechnology company focused on Alzheimer's and metabolic disease treatments. The analysis examines the company's financial statements for 2015 and 2016, including balance sheets, income statements, and cash flow statements. It delves into significant accounting policies, trend analysis, and key ratio analysis, including liquidity, profitability, and cash flow adequacy. The report highlights the company's strengths, such as its R&D department, while also addressing weaknesses like negative cash flows and significant losses. Recommendations are provided, and the report concludes with an overview of the company's financial position and outlook, including future plans to maximize shareholder wealth and improve market strength. The analysis underscores the importance of efficient resource management, particularly concerning the company's liquidity and profitability challenges.

Financial Statement Analysis
Paraphrase This Document
Need a fresh take? Get an instant paraphrase of this document with our AI Paraphraser
EXECUTIVE SUMMARY
The present report is conducted to analyze the financial statement of Actinogen Ltd. The cited
organization is a pharmaceutical company involved in the development of drugs that treat
Alzheimer’s disease and other diseases like type-2 diabetes. With the growing life style changes,
the pharmaceutical industry has doubled its growth from 2009-10. The financial statements do
not display a good position of the company. Huge losses, negative cash flows, low liquidity
ratios, low EPS is part of the company’s statements over the years. The only strength of the
company lies in its efficient R&D department which is committed to giving innovative drugs to
treat the disease. The company has to work on many areas like maximizing shareholder’s wealth,
improving liquidity and profitability. The losses over the years have shown a decreasing trend
and are expected to pick up in the years to come.
Table of Contents
INTRODUCTION...........................................................................................................................6
INDUSTRY ANALYSIS AND COMPANY PLANS....................................................................6
Medical industry in Australia......................................................................................................6
Future plans of Actinogen Medicals............................................................................................7
FINANCIAL STATEMENT ANALYSIS......................................................................................7
Significant Accounting Policies..................................................................................................9
Trend Analysis...........................................................................................................................10
RATIO ANALYSIS......................................................................................................................11
Liquidity Ratios.........................................................................................................................11
Strengths....................................................................................................................................14
Weakness...................................................................................................................................14
RECOMMENDATIONS AND CONCLUSIONS........................................................................14
REFERENCES..............................................................................................................................15
APPENDICES...............................................................................................................................16
⊘ This is a preview!⊘
Do you want full access?
Subscribe today to unlock all pages.
Trusted by 1+ million students worldwide
Table of figures
Figure 1: Position of revenue and loss in Actinogen Limited.......................................................11
Figure 2: Comprehensive Income Statement of Actinogen Ltd....................................................15
Figure 3: Consolidated Statement of Financial Position...............................................................16
Figure 4: Consolidated Statement of Cash flows..........................................................................16
Paraphrase This Document
Need a fresh take? Get an instant paraphrase of this document with our AI Paraphraser
List of Tables
Table 1: Common Balance Sheet for year 2016-2015.....................................................................7
Table 2: Financial Performance for the year 2015 and 2016...........................................................8
Table 3: Common Profit and Loss Statement for 2015 and 2016...................................................8
Table 4: Common Cash Flow Statement for year 2016-2015.........................................................9
Table 5: Analysis of Liquidity of Actinogen Ltd..........................................................................11
Table 6: Analysis of Profitability of Actinogen Ltd.....................................................................12
Table 7: Analysis of Cash flow adequacy of Actinogen Ltd.........................................................13
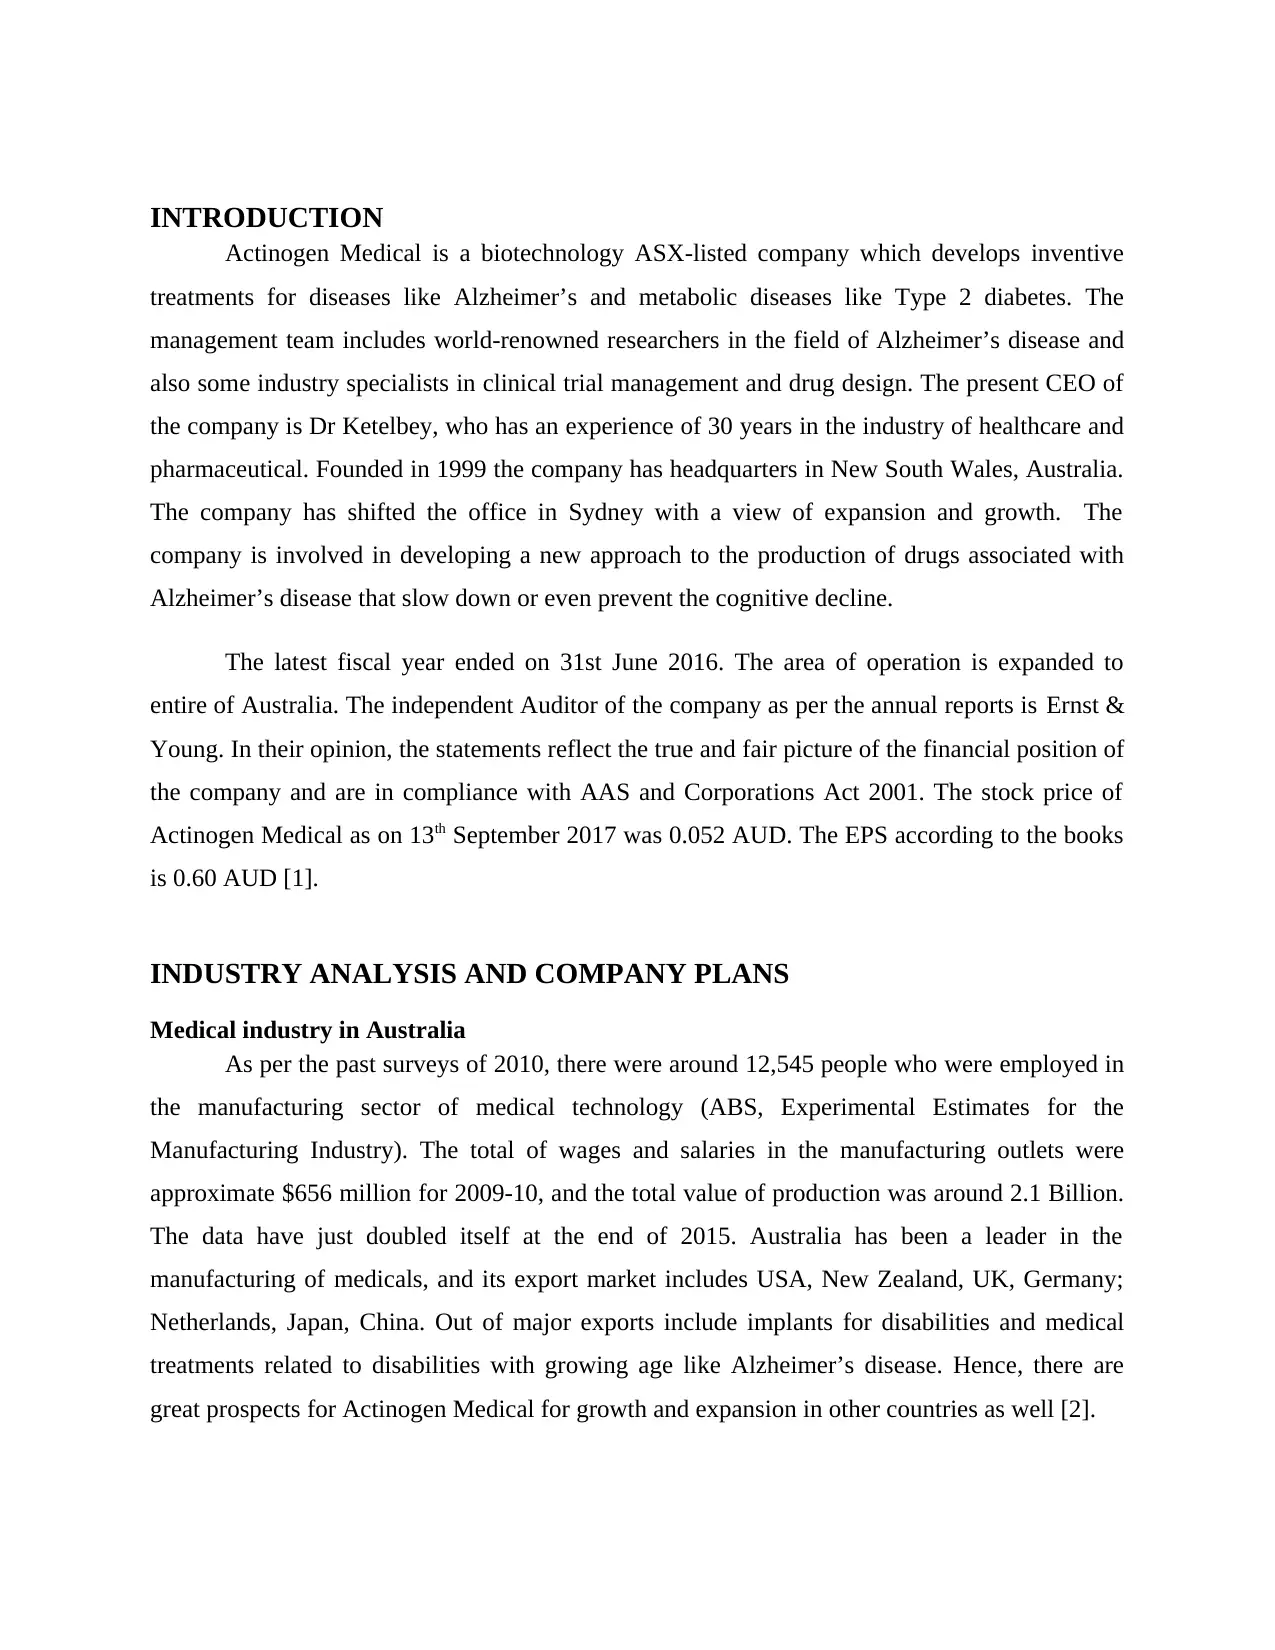
INTRODUCTION
Actinogen Medical is a biotechnology ASX-listed company which develops inventive
treatments for diseases like Alzheimer’s and metabolic diseases like Type 2 diabetes. The
management team includes world-renowned researchers in the field of Alzheimer’s disease and
also some industry specialists in clinical trial management and drug design. The present CEO of
the company is Dr Ketelbey, who has an experience of 30 years in the industry of healthcare and
pharmaceutical. Founded in 1999 the company has headquarters in New South Wales, Australia.
The company has shifted the office in Sydney with a view of expansion and growth. The
company is involved in developing a new approach to the production of drugs associated with
Alzheimer’s disease that slow down or even prevent the cognitive decline.
The latest fiscal year ended on 31st June 2016. The area of operation is expanded to
entire of Australia. The independent Auditor of the company as per the annual reports is Ernst &
Young. In their opinion, the statements reflect the true and fair picture of the financial position of
the company and are in compliance with AAS and Corporations Act 2001. The stock price of
Actinogen Medical as on 13th September 2017 was 0.052 AUD. The EPS according to the books
is 0.60 AUD [1].
INDUSTRY ANALYSIS AND COMPANY PLANS
Medical industry in Australia
As per the past surveys of 2010, there were around 12,545 people who were employed in
the manufacturing sector of medical technology (ABS, Experimental Estimates for the
Manufacturing Industry). The total of wages and salaries in the manufacturing outlets were
approximate $656 million for 2009-10, and the total value of production was around 2.1 Billion.
The data have just doubled itself at the end of 2015. Australia has been a leader in the
manufacturing of medicals, and its export market includes USA, New Zealand, UK, Germany;
Netherlands, Japan, China. Out of major exports include implants for disabilities and medical
treatments related to disabilities with growing age like Alzheimer’s disease. Hence, there are
great prospects for Actinogen Medical for growth and expansion in other countries as well [2].
⊘ This is a preview!⊘
Do you want full access?
Subscribe today to unlock all pages.
Trusted by 1+ million students worldwide
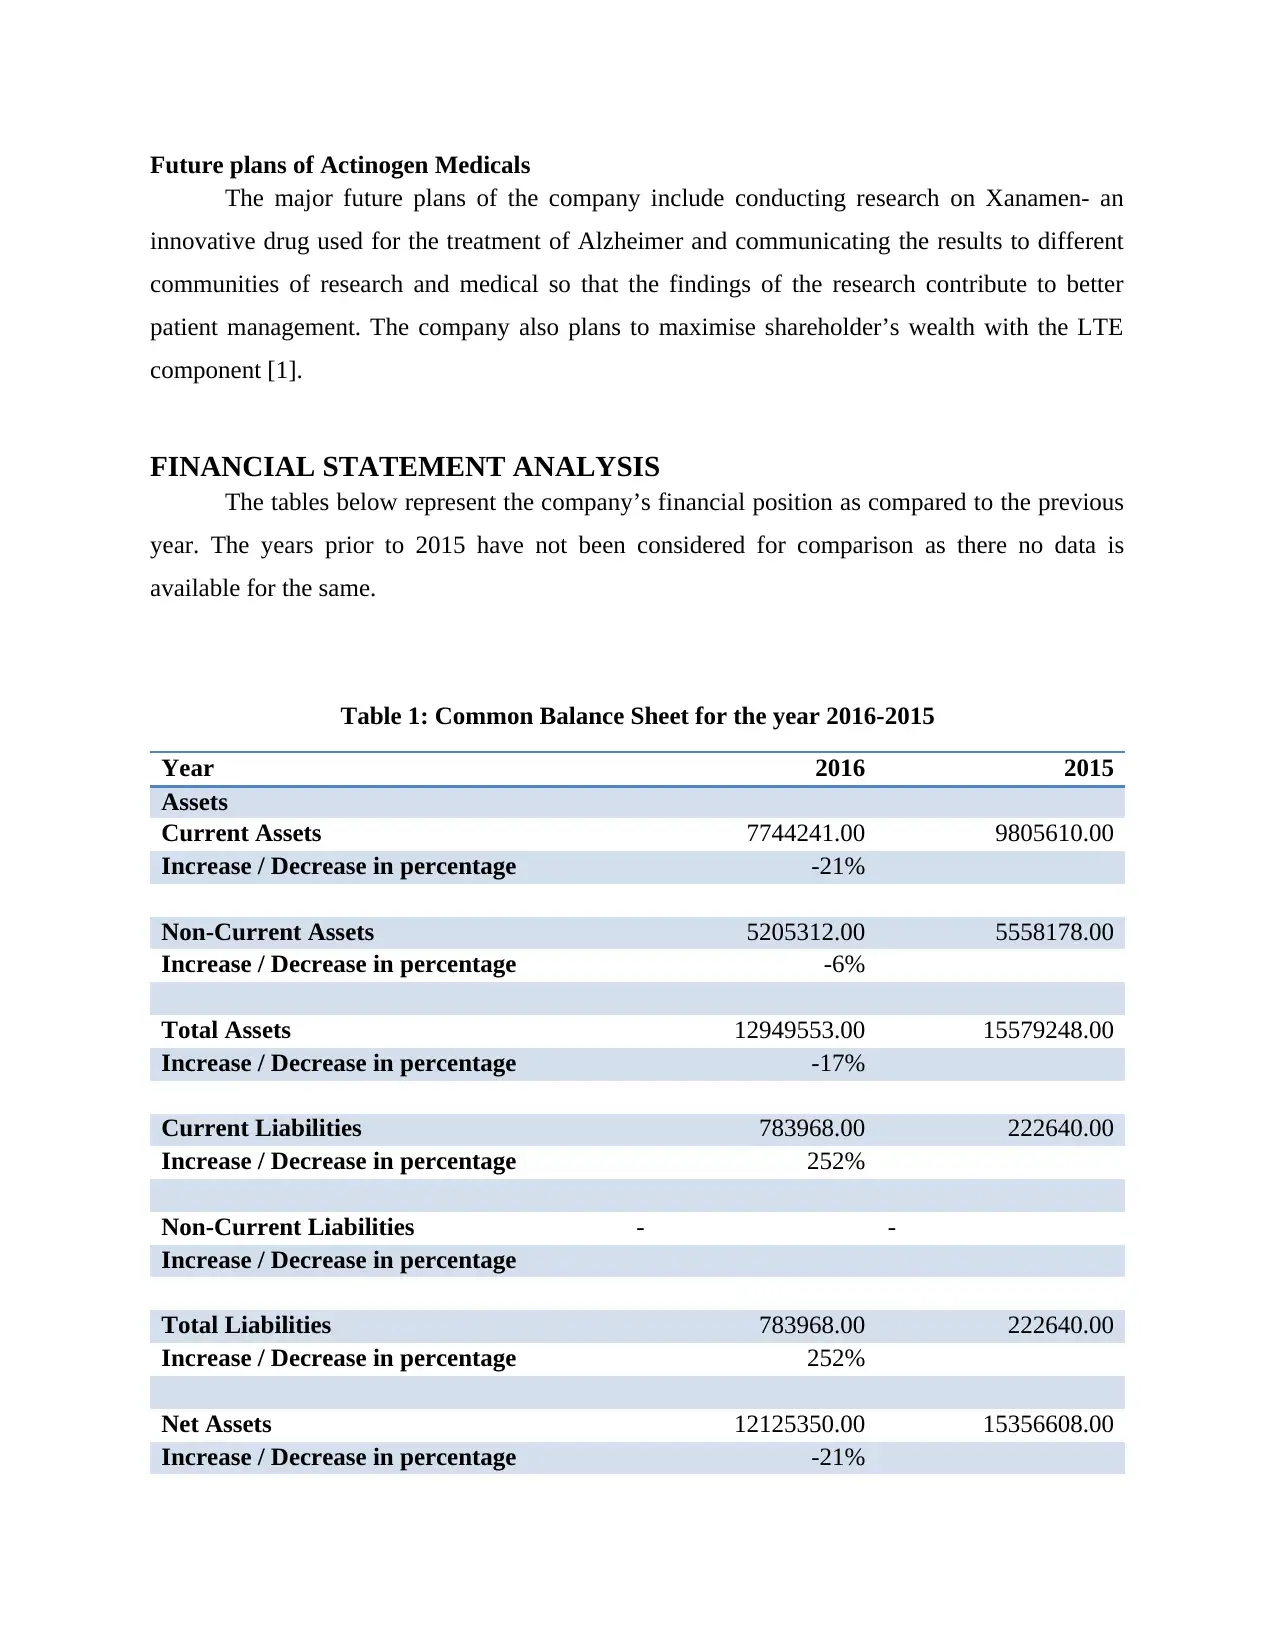
Future plans of Actinogen Medicals
The major future plans of the company include conducting research on Xanamen- an
innovative drug used for the treatment of Alzheimer and communicating the results to different
communities of research and medical so that the findings of the research contribute to better
patient management. The company also plans to maximise shareholder’s wealth with the LTE
component [1].
FINANCIAL STATEMENT ANALYSIS
The tables below represent the company’s financial position as compared to the previous
year. The years prior to 2015 have not been considered for comparison as there no data is
available for the same.
Table 1: Common Balance Sheet for the year 2016-2015
Year 2016 2015
Assets
Current Assets 7744241.00 9805610.00
Increase / Decrease in percentage -21%
Non-Current Assets 5205312.00 5558178.00
Increase / Decrease in percentage -6%
Total Assets 12949553.00 15579248.00
Increase / Decrease in percentage -17%
Current Liabilities 783968.00 222640.00
Increase / Decrease in percentage 252%
Non-Current Liabilities - -
Increase / Decrease in percentage
Total Liabilities 783968.00 222640.00
Increase / Decrease in percentage 252%
Net Assets 12125350.00 15356608.00
Increase / Decrease in percentage -21%
Paraphrase This Document
Need a fresh take? Get an instant paraphrase of this document with our AI Paraphraser
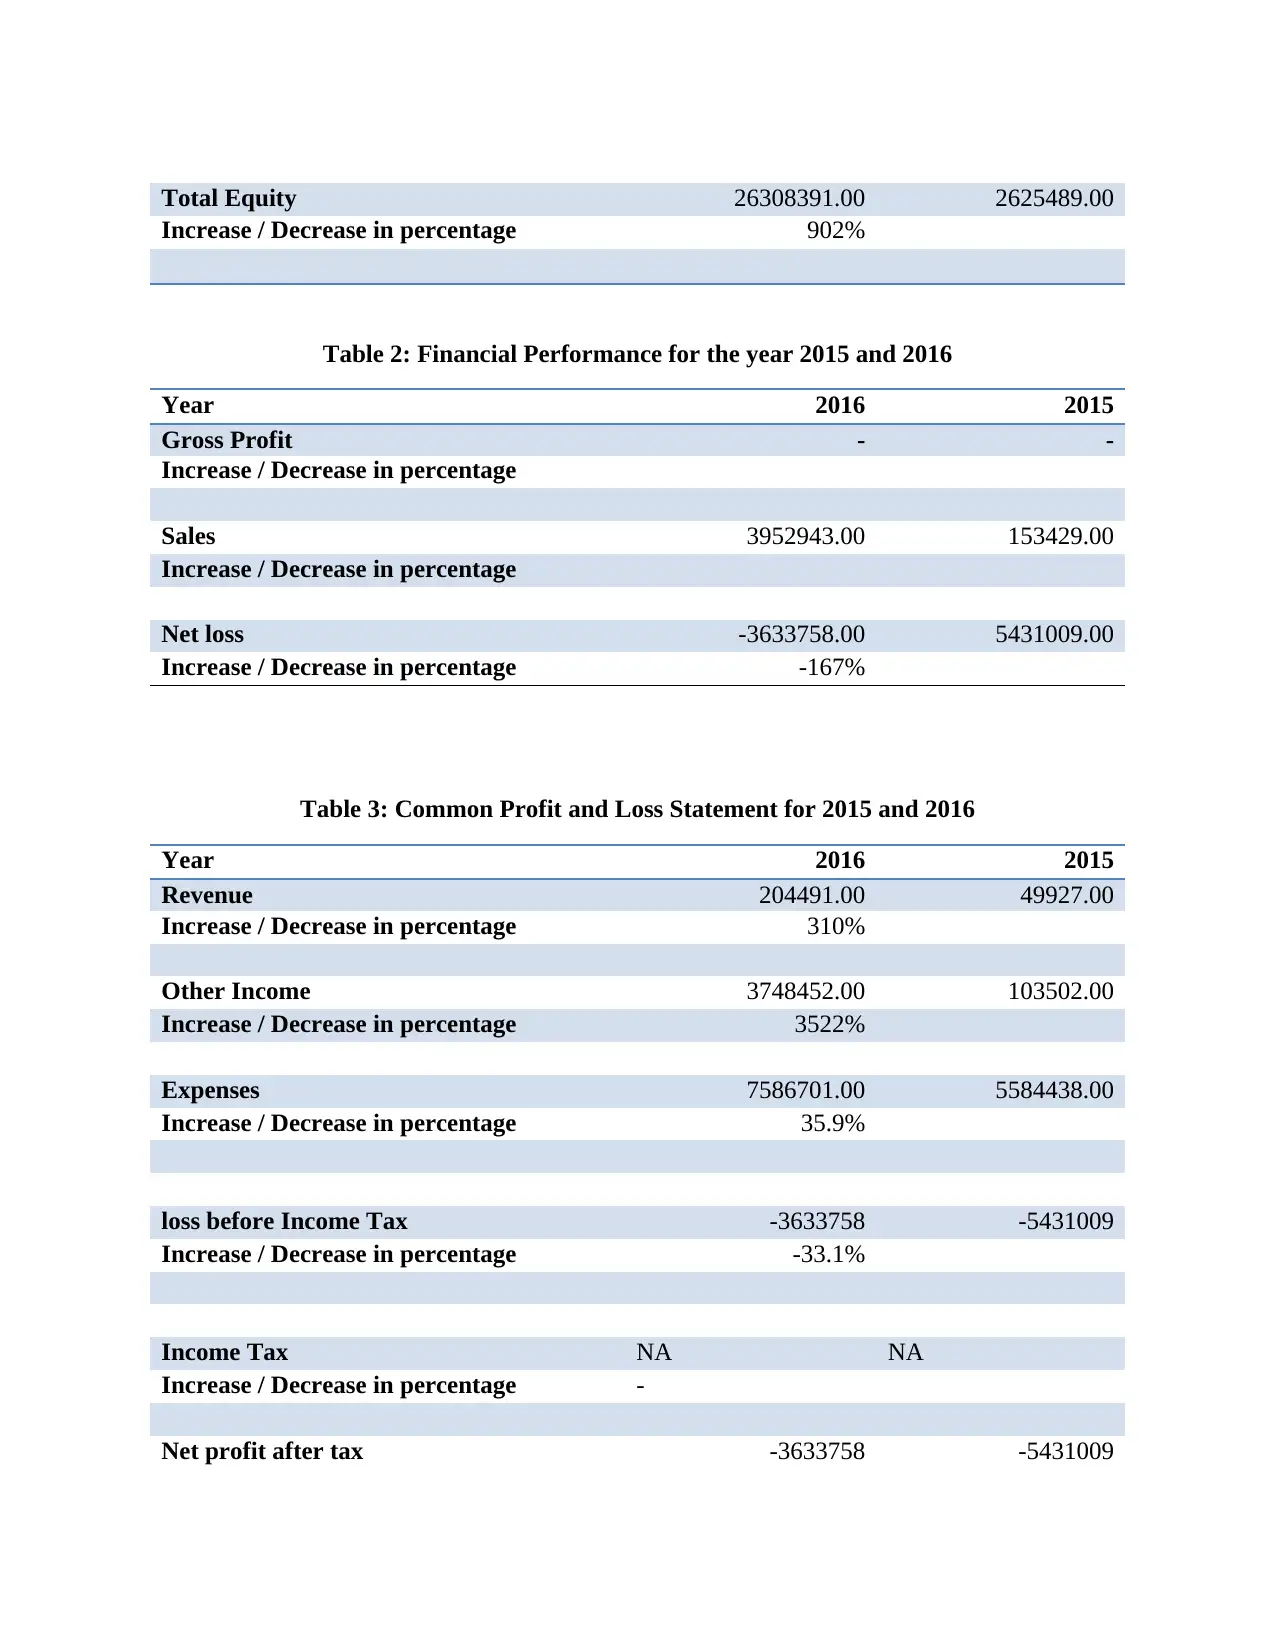
Total Equity 26308391.00 2625489.00
Increase / Decrease in percentage 902%
Table 2: Financial Performance for the year 2015 and 2016
Year 2016 2015
Gross Profit - -
Increase / Decrease in percentage
Sales 3952943.00 153429.00
Increase / Decrease in percentage
Net loss -3633758.00 5431009.00
Increase / Decrease in percentage -167%
Table 3: Common Profit and Loss Statement for 2015 and 2016
Year 2016 2015
Revenue 204491.00 49927.00
Increase / Decrease in percentage 310%
Other Income 3748452.00 103502.00
Increase / Decrease in percentage 3522%
Expenses 7586701.00 5584438.00
Increase / Decrease in percentage 35.9%
loss before Income Tax -3633758 -5431009
Increase / Decrease in percentage -33.1%
Income Tax NA NA
Increase / Decrease in percentage -
Net profit after tax -3633758 -5431009
Increase / Decrease in percentage -33.1%
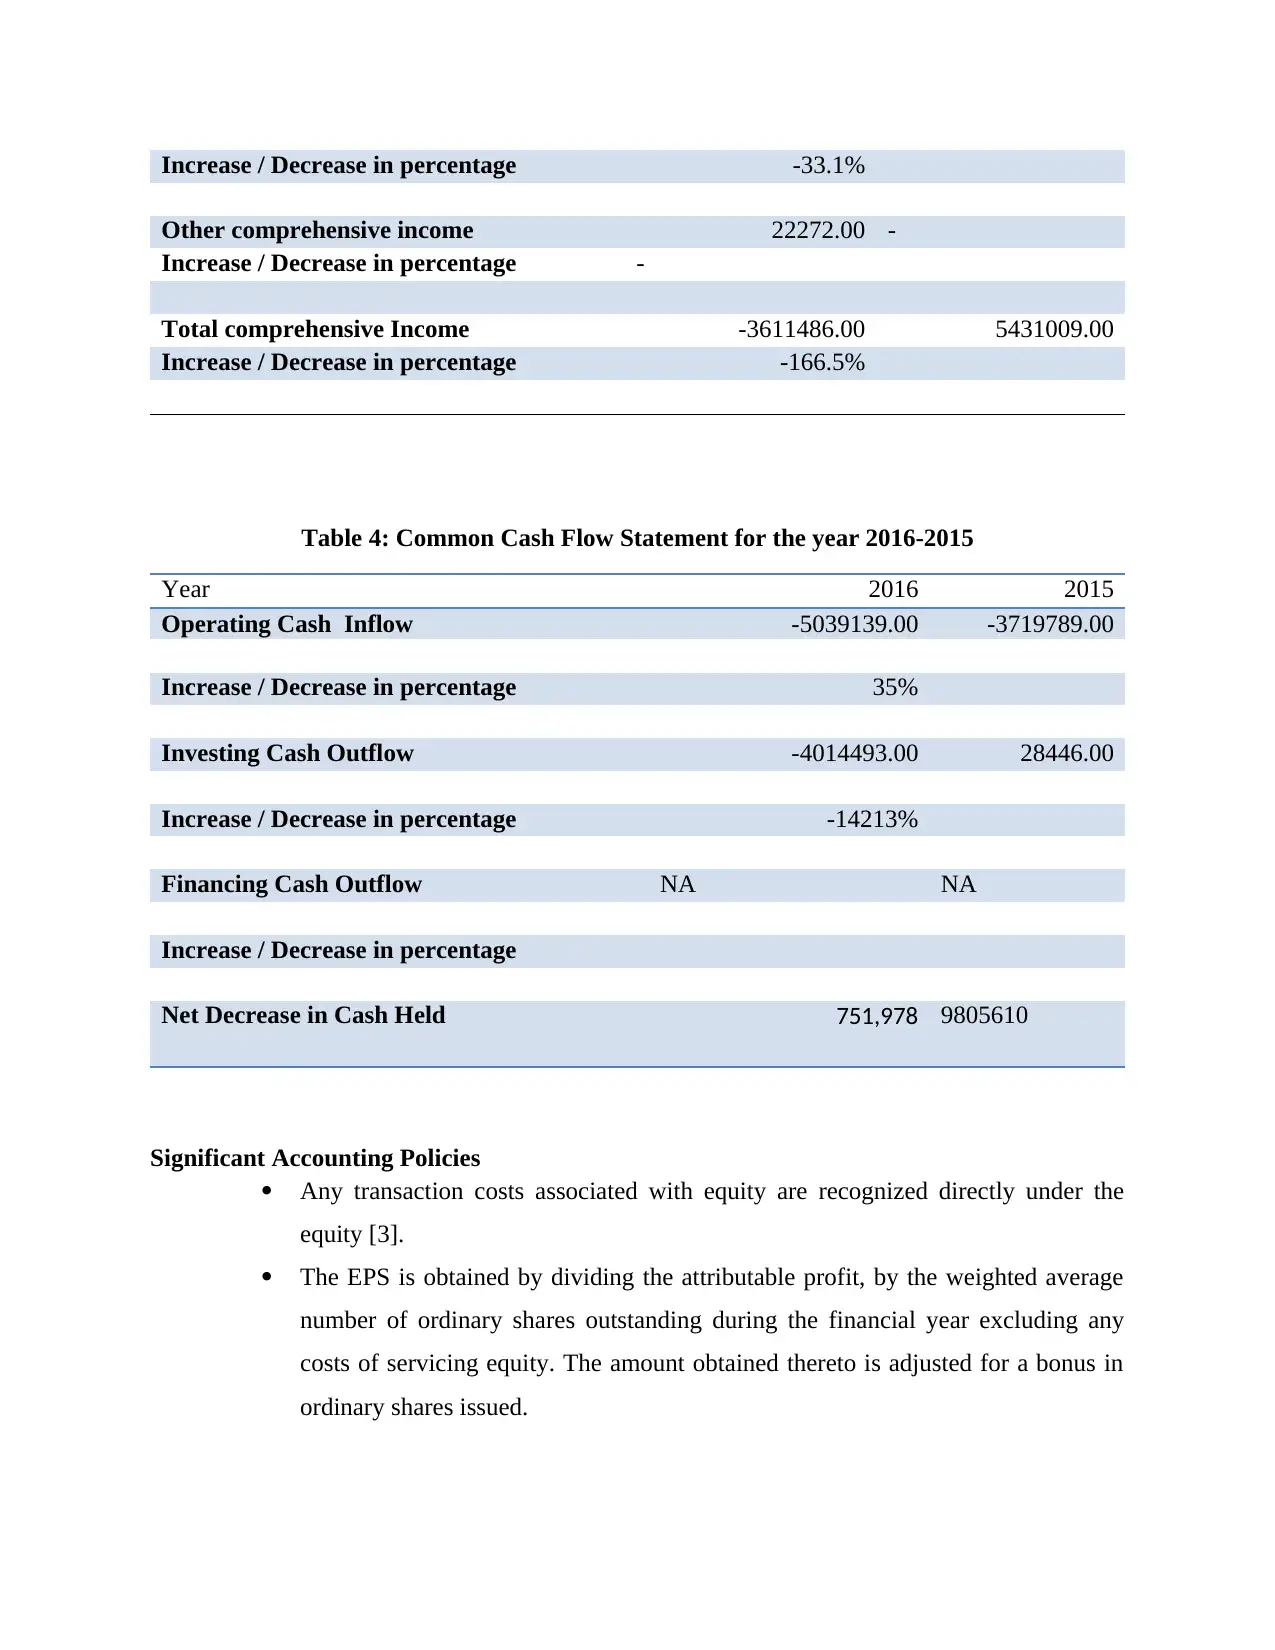
Other comprehensive income 22272.00 -
Increase / Decrease in percentage -
Total comprehensive Income -3611486.00 5431009.00
Increase / Decrease in percentage -166.5%
Table 4: Common Cash Flow Statement for the year 2016-2015
Year 2016 2015
Operating Cash Inflow -5039139.00 -3719789.00
Increase / Decrease in percentage 35%
Investing Cash Outflow -4014493.00 28446.00
Increase / Decrease in percentage -14213%
Financing Cash Outflow NA NA
Increase / Decrease in percentage
Net Decrease in Cash Held 751,978 9805610
Significant Accounting Policies
Any transaction costs associated with equity are recognized directly under the
equity [3].
The EPS is obtained by dividing the attributable profit, by the weighted average
number of ordinary shares outstanding during the financial year excluding any
costs of servicing equity. The amount obtained thereto is adjusted for a bonus in
ordinary shares issued.
⊘ This is a preview!⊘
Do you want full access?
Subscribe today to unlock all pages.
Trusted by 1+ million students worldwide
Other significant accounting policies like revenue recognition are accounted on
the basis of Effective Interest Rate Method in order to measure the values as
realizable over time.
Current assets are measured initially at fair value and later at an amortized cost
[3].
The trade receivables are due generally for the duration of 30 days after the
settlement.
Trend Analysis
The sales of the company have although increased to a great extent. However, Actinogen
still suffers from huge losses. There has not been any gross profit to the company. The
accumulated losses also include part of R&D activities, up to the extent of $2,605,395. Hence the
losses up to this amount can be justified. The other losses required to be assessed by the Board in
detail and appropriate manner. A downfall in the assets has been seen, and on the other hand,
there is an increase in liabilities as well. The company’s assets do not provide an adequate
backup to discharge any debts arising on account of the company.
The year 2016 has also seen a reduction in equity. This indicates that the company has
made cancellations of shares or repurchased its own shares in order to maximise shareholder’s
value. This provides a more efficient capital structure to the company and balances many ratios
which are currently not controllable by the management [4]. There were no financial inflows and
outflows of the company in 2016. However, the cash flow from financing activity also displayed
negative results in the previous year. The investing and operating cash flow remain negative;
however, the figures have seen major improvements, which are expected to rise further in the
coming years.
Paraphrase This Document
Need a fresh take? Get an instant paraphrase of this document with our AI Paraphraser
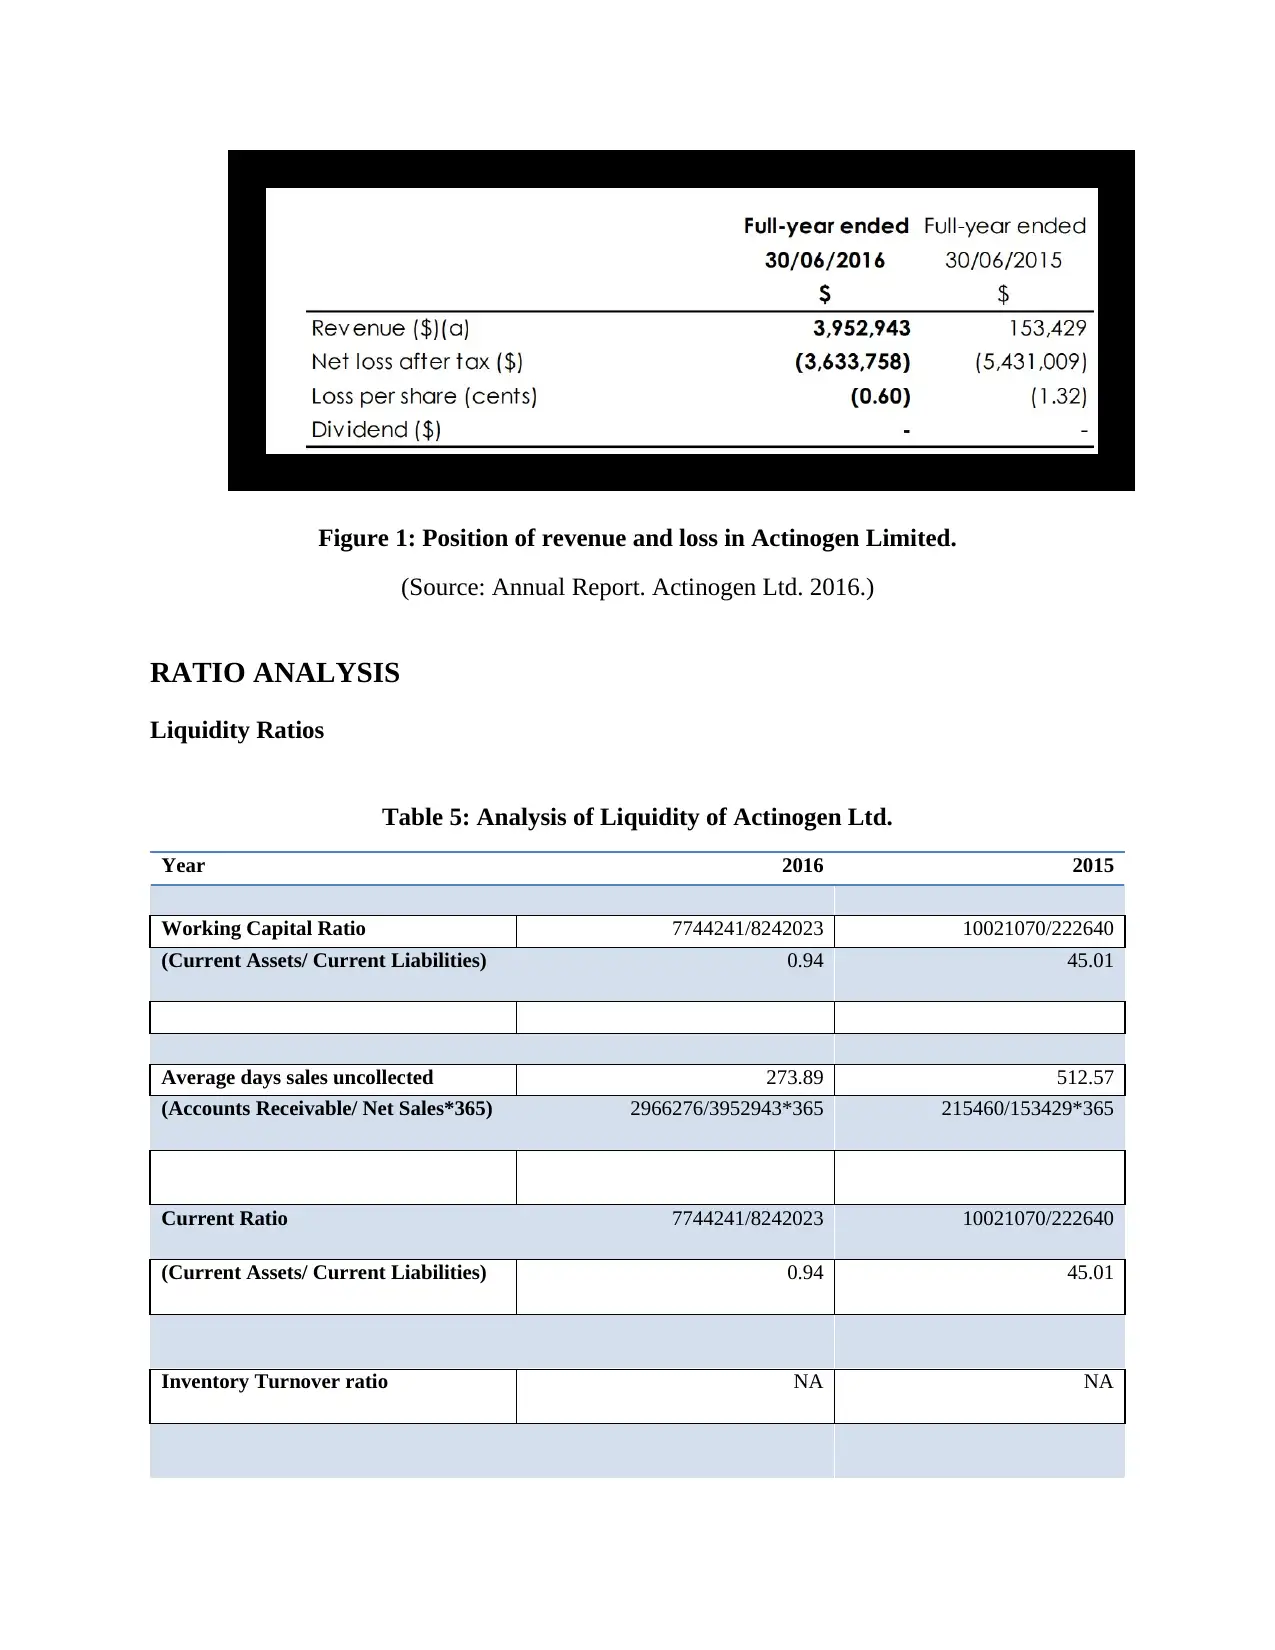
Figure 1: Position of revenue and loss in Actinogen Limited.
(Source: Annual Report. Actinogen Ltd. 2016.)
RATIO ANALYSIS
Liquidity Ratios
Table 5: Analysis of Liquidity of Actinogen Ltd.
Year 2016 2015
Working Capital Ratio 7744241/8242023 10021070/222640
(Current Assets/ Current Liabilities) 0.94 45.01
Average days sales uncollected 273.89 512.57
(Accounts Receivable/ Net Sales*365) 2966276/3952943*365 215460/153429*365
Current Ratio 7744241/8242023 10021070/222640
(Current Assets/ Current Liabilities) 0.94 45.01
Inventory Turnover ratio NA NA
Receivable turnover ratio NA NA
Avg Days Inventory in Hand NA NA
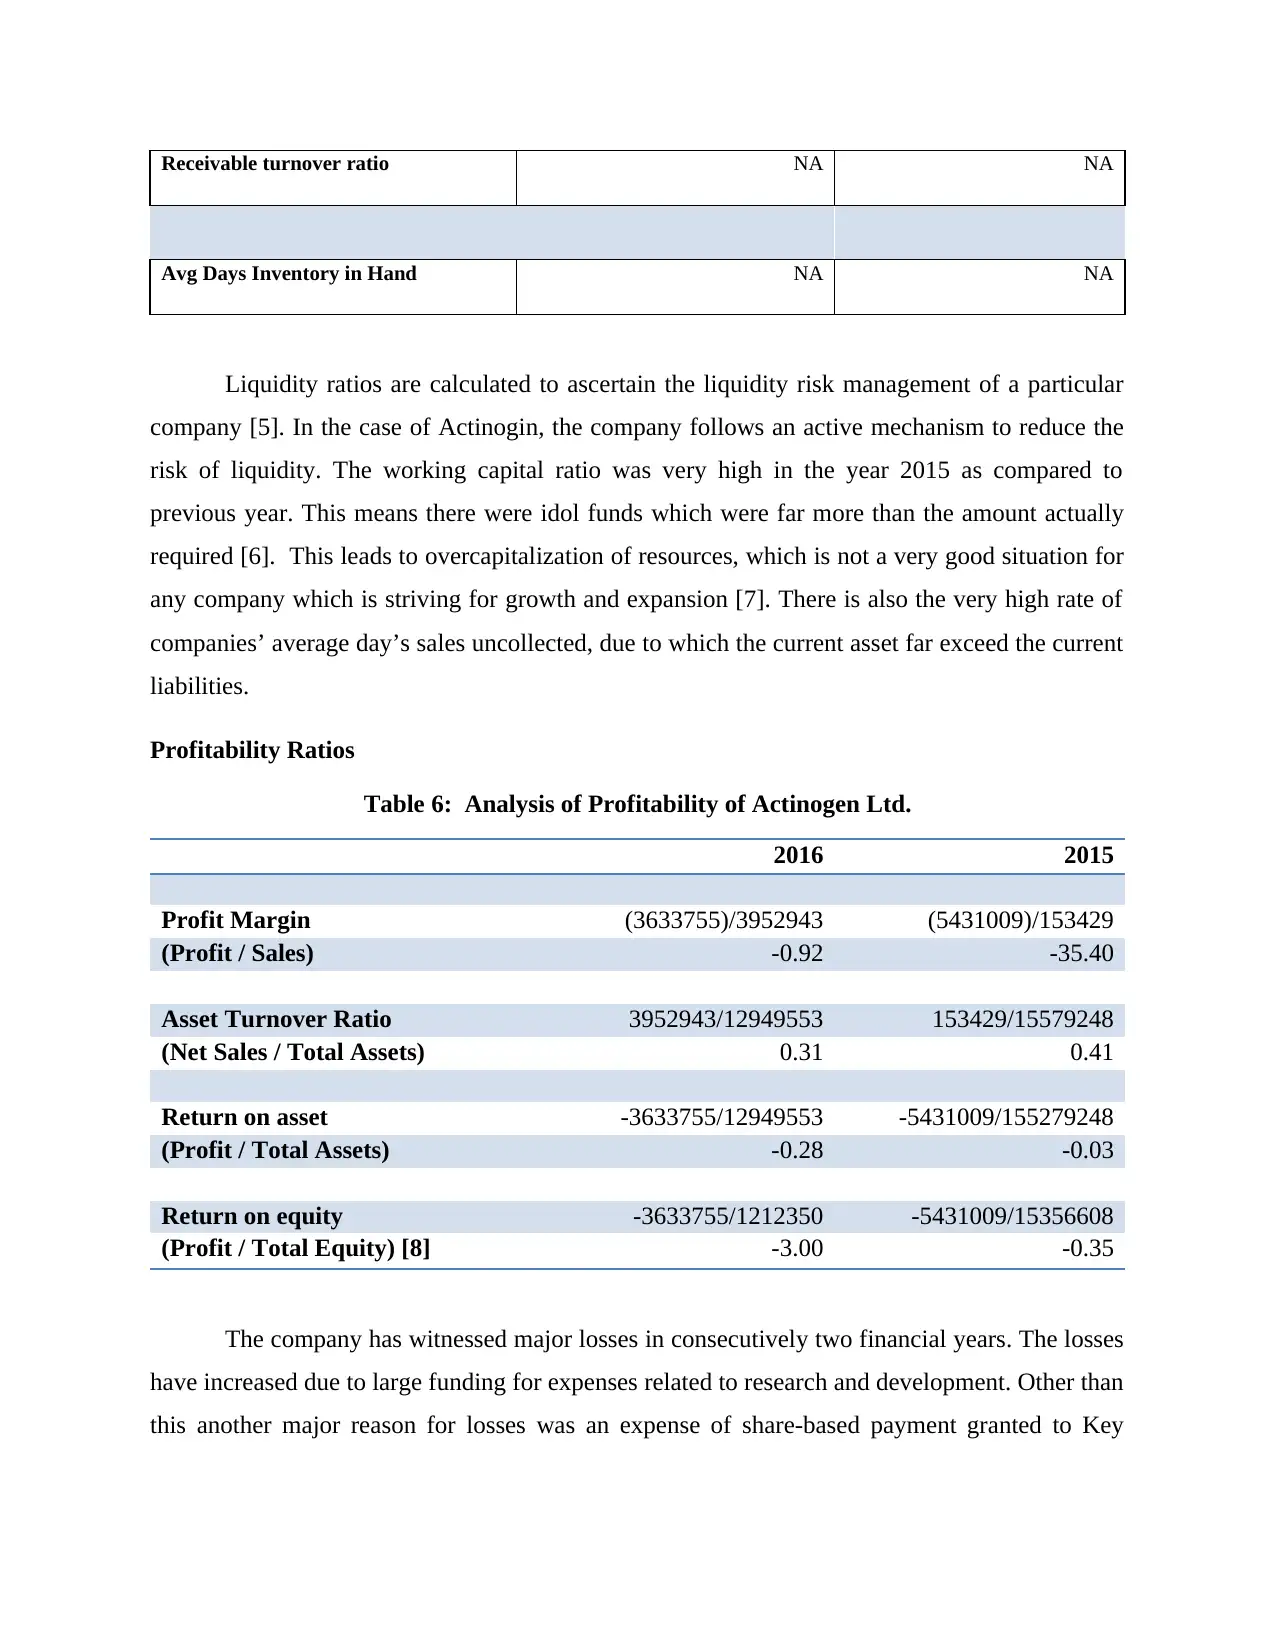
Liquidity ratios are calculated to ascertain the liquidity risk management of a particular
company [5]. In the case of Actinogin, the company follows an active mechanism to reduce the
risk of liquidity. The working capital ratio was very high in the year 2015 as compared to
previous year. This means there were idol funds which were far more than the amount actually
required [6]. This leads to overcapitalization of resources, which is not a very good situation for
any company which is striving for growth and expansion [7]. There is also the very high rate of
companies’ average day’s sales uncollected, due to which the current asset far exceed the current
liabilities.
Profitability Ratios
Table 6: Analysis of Profitability of Actinogen Ltd.
2016 2015
Profit Margin (3633755)/3952943 (5431009)/153429
(Profit / Sales) -0.92 -35.40
Asset Turnover Ratio 3952943/12949553 153429/15579248
(Net Sales / Total Assets) 0.31 0.41
Return on asset -3633755/12949553 -5431009/155279248
(Profit / Total Assets) -0.28 -0.03
Return on equity -3633755/1212350 -5431009/15356608
(Profit / Total Equity) [8] -3.00 -0.35
The company has witnessed major losses in consecutively two financial years. The losses
have increased due to large funding for expenses related to research and development. Other than
this another major reason for losses was an expense of share-based payment granted to Key
Avg Days Inventory in Hand NA NA
Liquidity ratios are calculated to ascertain the liquidity risk management of a particular
company [5]. In the case of Actinogin, the company follows an active mechanism to reduce the
risk of liquidity. The working capital ratio was very high in the year 2015 as compared to
previous year. This means there were idol funds which were far more than the amount actually
required [6]. This leads to overcapitalization of resources, which is not a very good situation for
any company which is striving for growth and expansion [7]. There is also the very high rate of
companies’ average day’s sales uncollected, due to which the current asset far exceed the current
liabilities.
Profitability Ratios
Table 6: Analysis of Profitability of Actinogen Ltd.
2016 2015
Profit Margin (3633755)/3952943 (5431009)/153429
(Profit / Sales) -0.92 -35.40
Asset Turnover Ratio 3952943/12949553 153429/15579248
(Net Sales / Total Assets) 0.31 0.41
Return on asset -3633755/12949553 -5431009/155279248
(Profit / Total Assets) -0.28 -0.03
Return on equity -3633755/1212350 -5431009/15356608
(Profit / Total Equity) [8] -3.00 -0.35
The company has witnessed major losses in consecutively two financial years. The losses
have increased due to large funding for expenses related to research and development. Other than
this another major reason for losses was an expense of share-based payment granted to Key
⊘ This is a preview!⊘
Do you want full access?
Subscribe today to unlock all pages.
Trusted by 1+ million students worldwide
1 out of 18
Related Documents


Your All-in-One AI-Powered Toolkit for Academic Success.
+13062052269
info@desklib.com
Available 24*7 on WhatsApp / Email
![[object Object]](/_next/static/media/star-bottom.7253800d.svg)
Unlock your academic potential
Copyright © 2020–2026 A2Z Services. All Rights Reserved. Developed and managed by ZUCOL.