Financial Analysis Report: Adidas and Puma (Course Name, Semester)
VerifiedAdded on 2023/03/17
|21
|4893
|82
Report
AI Summary
This report provides a comprehensive financial analysis comparing Adidas and Puma, employing the CORE approach to evaluate their business performance. The analysis examines the external and internal environments of both companies, focusing on the footwear and accessories industry, market trends, and competitive landscapes. The report delves into revenue figures, employee data, and detailed financial statements, including balance sheet summaries, to assess their financial health and efficiency. Key metrics such as revenue growth, asset and liability management, and horizontal analysis are used to draw comparisons and identify performance trends. The conclusion offers investment recommendations based on the findings, suggesting that Adidas demonstrates a more appreciable performance compared to Puma, making it a more favorable addition to an investment portfolio. The appendices section includes all the calculations and supporting data used in the analysis.
Accounting financial analysis report
[Type the author name]
[Type the author name]
Paraphrase This Document
Need a fresh take? Get an instant paraphrase of this document with our AI Paraphraser
Contents
Executive Summary...............................................................................................................................2
INTRODUCTION.....................................................................................................................................2
Core Analysis of Adidas and Puma.........................................................................................................2
Conclusion...........................................................................................................................................13
References...........................................................................................................................................14
Appendix.............................................................................................................................................15
1
Executive Summary
This report is prepared to analyse two companies that is Adidas and Puma in order to arrive at
a better investment decision. The approach used for studying and evaluating the overall
business and performance of both the companies includes the CORE Approach. Every
calculation can be found in the appendices section. The result drawn from the approach says
that the performance of Adidas is more appreciable than Puma. As a result, it will be
advisable to add Adidas in the investment portfolio.
INTRODUCTION
In today’s scenario making an investment decision has become a very crucial as well as a
complicated task. Companies have enough funds but where to invest the available funds
becomes a big question mark. In this report we had studied the business of two very famous
companies that is ADIDAS and PUMA for which we used the CORE approach. With the
help of this approach we tried to analyse the external and internal environment of the both the
business and had even studied the financial position of both the companies. The ratio analysis
is also conducted to evaluate the efficiency of both the companies in order to draw a better
conclusion for decision making.
Core Analysis of Adidas and Puma
1. Stage-1 (Context)
Context: External Profile
2
⊘ This is a preview!⊘
Do you want full access?
Subscribe today to unlock all pages.
Trusted by 1+ million students worldwide
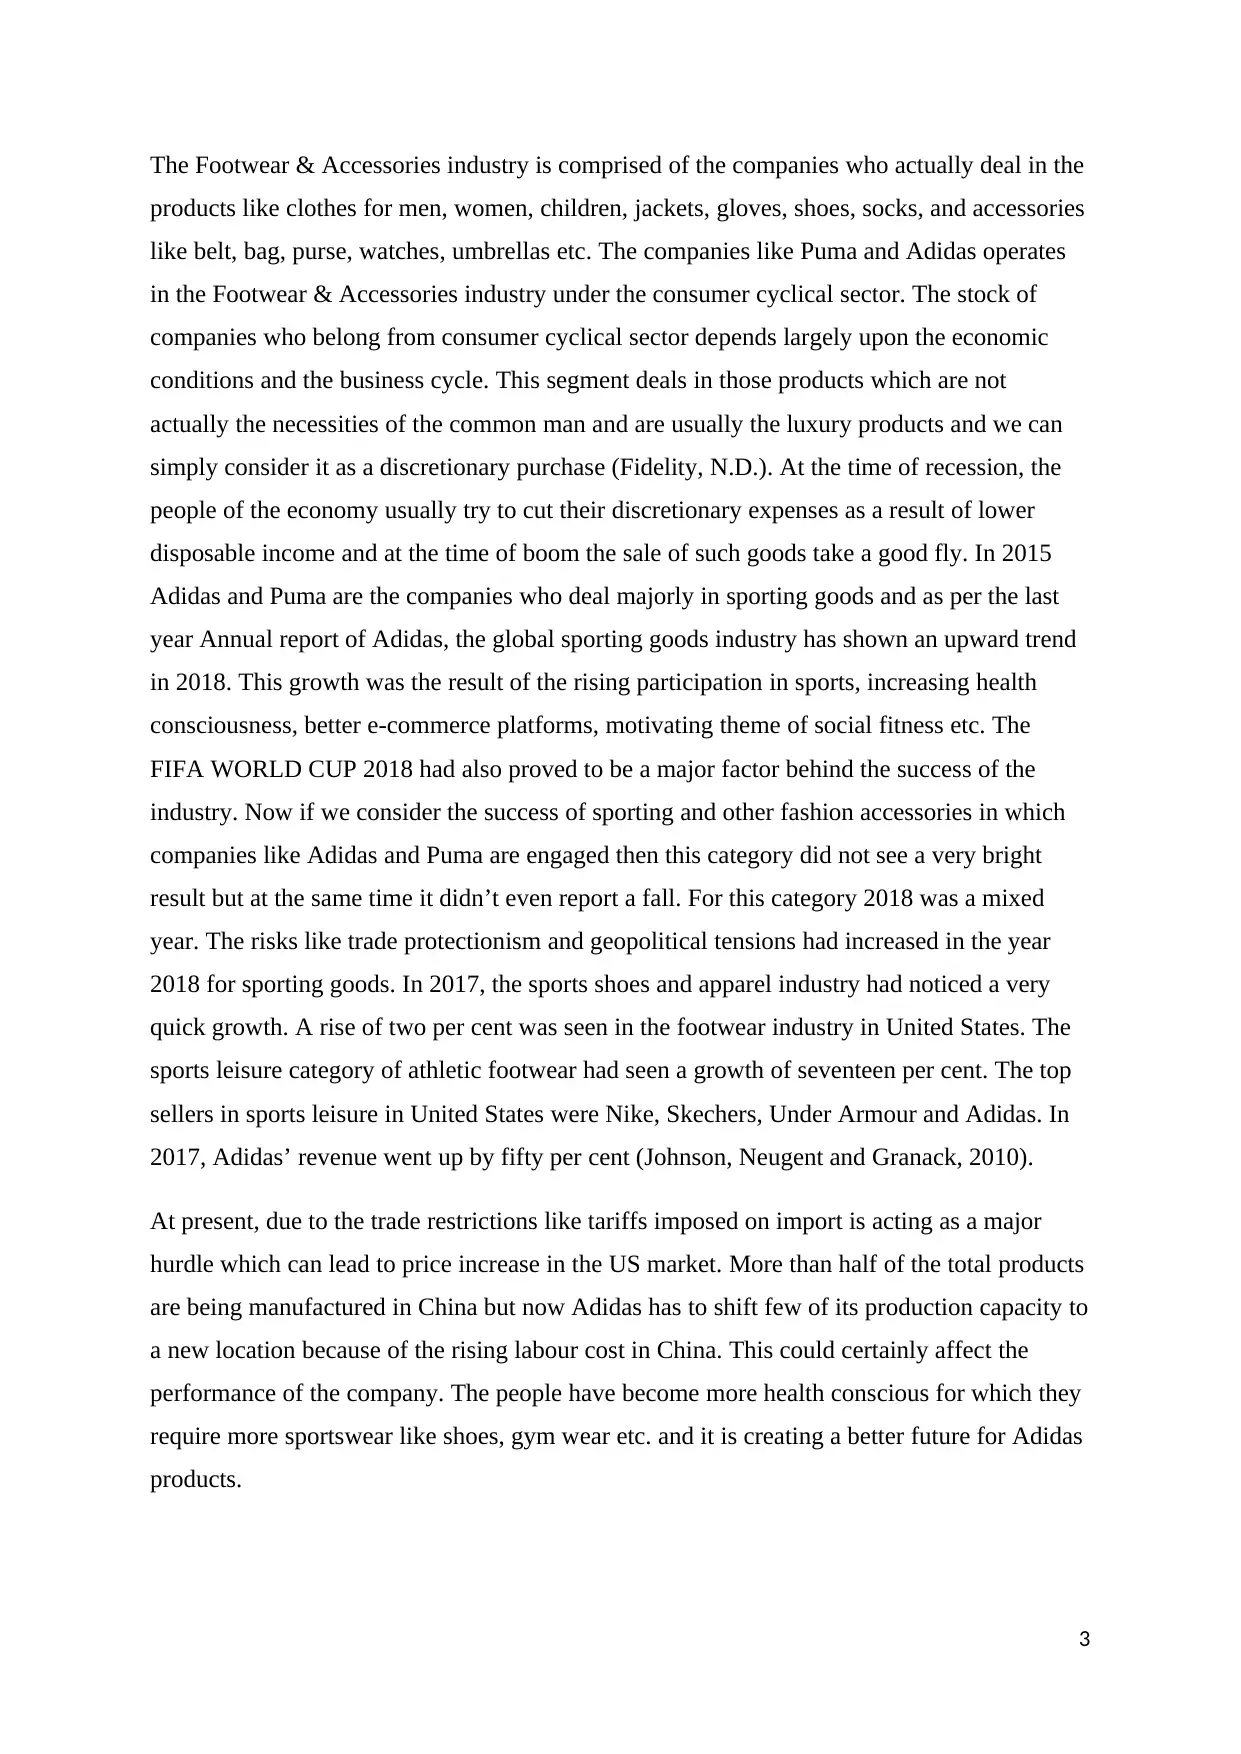
The Footwear & Accessories industry is comprised of the companies who actually deal in the
products like clothes for men, women, children, jackets, gloves, shoes, socks, and accessories
like belt, bag, purse, watches, umbrellas etc. The companies like Puma and Adidas operates
in the Footwear & Accessories industry under the consumer cyclical sector. The stock of
companies who belong from consumer cyclical sector depends largely upon the economic
conditions and the business cycle. This segment deals in those products which are not
actually the necessities of the common man and are usually the luxury products and we can
simply consider it as a discretionary purchase (Fidelity, N.D.). At the time of recession, the
people of the economy usually try to cut their discretionary expenses as a result of lower
disposable income and at the time of boom the sale of such goods take a good fly. In 2015
Adidas and Puma are the companies who deal majorly in sporting goods and as per the last
year Annual report of Adidas, the global sporting goods industry has shown an upward trend
in 2018. This growth was the result of the rising participation in sports, increasing health
consciousness, better e-commerce platforms, motivating theme of social fitness etc. The
FIFA WORLD CUP 2018 had also proved to be a major factor behind the success of the
industry. Now if we consider the success of sporting and other fashion accessories in which
companies like Adidas and Puma are engaged then this category did not see a very bright
result but at the same time it didn’t even report a fall. For this category 2018 was a mixed
year. The risks like trade protectionism and geopolitical tensions had increased in the year
2018 for sporting goods. In 2017, the sports shoes and apparel industry had noticed a very
quick growth. A rise of two per cent was seen in the footwear industry in United States. The
sports leisure category of athletic footwear had seen a growth of seventeen per cent. The top
sellers in sports leisure in United States were Nike, Skechers, Under Armour and Adidas. In
2017, Adidas’ revenue went up by fifty per cent (Johnson, Neugent and Granack, 2010).
At present, due to the trade restrictions like tariffs imposed on import is acting as a major
hurdle which can lead to price increase in the US market. More than half of the total products
are being manufactured in China but now Adidas has to shift few of its production capacity to
a new location because of the rising labour cost in China. This could certainly affect the
performance of the company. The people have become more health conscious for which they
require more sportswear like shoes, gym wear etc. and it is creating a better future for Adidas
products.
3
Paraphrase This Document
Need a fresh take? Get an instant paraphrase of this document with our AI Paraphraser
In the world of digitalization there are many concerns which relate to the security issues.
(Puma, 2018)In order to meet the rising securities concern Puma had invested a good amount
on maintaining IT infrastructure where main attention is given to business intelligence.
Overall, the footwear & Accessories industry is performing well as a result of increased
health consciousness, improved channels of e-commerce etc. whereas the factors like trade
protectionism, labour cost etc. may affect the performance of the industry.
Context: Internal Profile
Adidas started its journey in the year 1924 which was established by two brothers, Rudolf
and Adolf Dassler and it was founded in the year 1949. At present the company carries out its
operations in ten segments which include Europe, North America Adidas, Asia-Pacific, North
America Reebok, Latin America, Emerging Markets, Russia/CIS, Adidas Golf, Runtastic,
and other centrally managed businesses. The company deals in apparel, footwear and
accessories fitness equipment, golf clubs and hockey sticks etc.
Adidas is following Brand Leadership as their operating model which focuses on building a
consumer obsessed organisational structure which performs with good speed, agility as well
as empowerment. From 2015 ADIDAS is using Net Promoter Score (NPS) in order to get an
idea about the perception of consumers relating to brand and the factors which motivate them
to recommend the brand to their friends and relatives. The company was able to improve its
market share in their focussed market that is North America and Greater China. As a result of
excellent sustainability performance Adidas secured Gold class distinction and was declared
as a leader in Textiles, Apparel & Luxury Goods industry (Annual Report, 2018).
(Puma, N.D.) In 1948 the two brothers got separated and Rudolf dassler started a new
company named as PUMA Schuhfabrik Rudolf Dassler. Though the company was new but
its success remained remarkable. Their first football boot was a great hit. As a result in 1950
many of the members of West Germany national team wore them in the football match which
was to be played against Switzerland, the first match after the war.
The designers of Puma design create the most desirable products that set the trend for future
and all these are carried out under the guidance of Torsten Hochstetter who is the PUMA’s
Global Creative Director. Puma has partnered with the elite ambassadors like Lewis
4
Hamilton, Bryson DeChambeau, Sergio Agüero, Antoine Griezmann, Borussia Dortmund,
Olympique de Marseille and AC Milan which has strengthen its position as a sport brand.
The company had also made connection with the women by signing Adriana Lima, a
supermodel as an ambassador for women’s training.
2. Stage-2 (Overview)
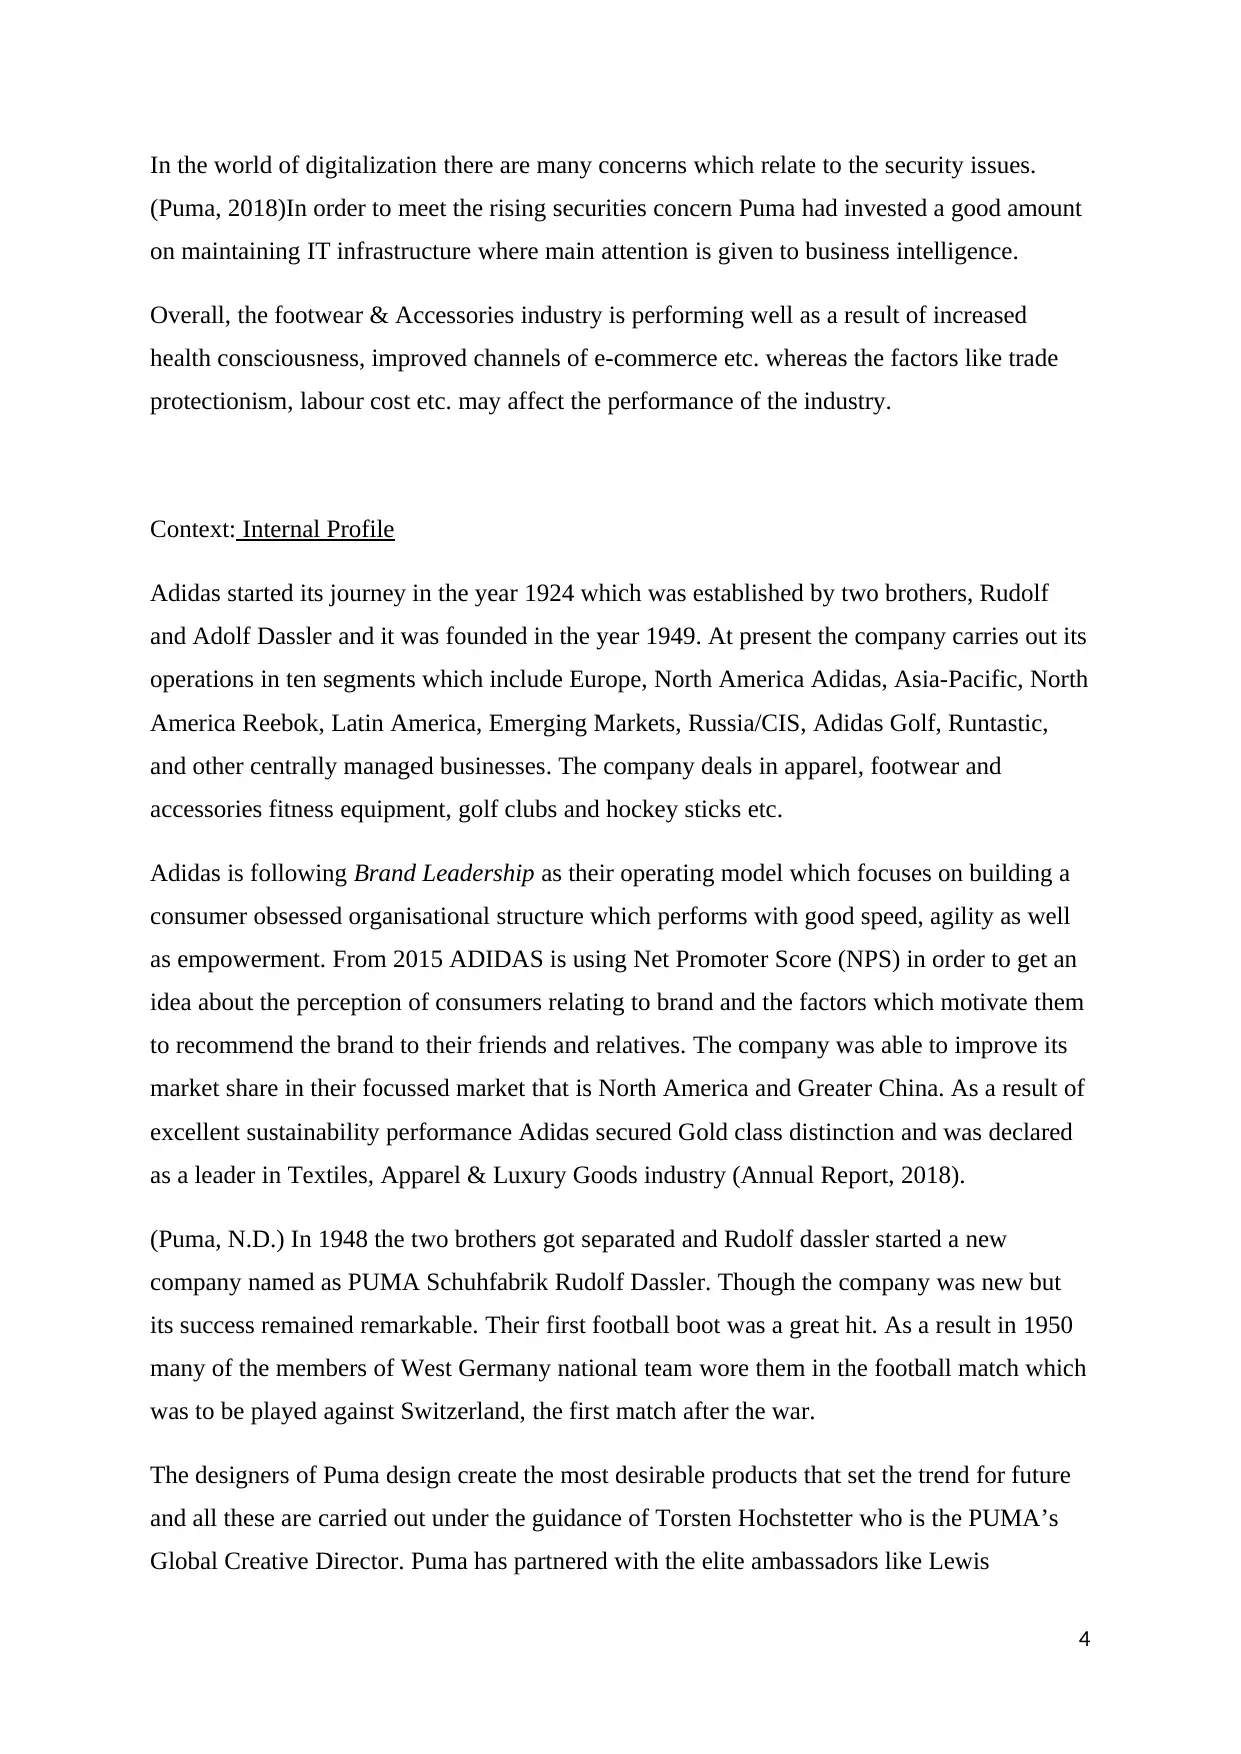
Now if we look at the revenue figure or the net sales of Adidas and Puma then in Figure A we
could easily identify that Adidas had always enjoyed a supreme position over Puma in the
past 12 years (2006-2018).
Source: (Statista, 2019)
Fig A Revenue during 2006-2018
In Europe Adidas stands as the largest sportswear manufacturer whereas in the whole world it
enjoys the second position. Puma does not enjoys first, second or third position but still it is
also one of the leading brands in the world and it operates with the aim of becoming the most
desirable sports lifestyle company. Around seventy-five per cent of Puma’s sales come from
Europe and America. In the year 2018, with the motive of broadening the market share Puma
collaborated with Ergio Rossi, singer Rihanna and Alexander McQueen (Statista, 2019).
5
Olympique de Marseille and AC Milan which has strengthen its position as a sport brand.
The company had also made connection with the women by signing Adriana Lima, a
supermodel as an ambassador for women’s training.
2. Stage-2 (Overview)
Now if we look at the revenue figure or the net sales of Adidas and Puma then in Figure A we
could easily identify that Adidas had always enjoyed a supreme position over Puma in the
past 12 years (2006-2018).
Source: (Statista, 2019)
Fig A Revenue during 2006-2018
In Europe Adidas stands as the largest sportswear manufacturer whereas in the whole world it
enjoys the second position. Puma does not enjoys first, second or third position but still it is
also one of the leading brands in the world and it operates with the aim of becoming the most
desirable sports lifestyle company. Around seventy-five per cent of Puma’s sales come from
Europe and America. In the year 2018, with the motive of broadening the market share Puma
collaborated with Ergio Rossi, singer Rihanna and Alexander McQueen (Statista, 2019).
5
⊘ This is a preview!⊘
Do you want full access?
Subscribe today to unlock all pages.
Trusted by 1+ million students worldwide
Source: (Puma Annual Report, 2015)
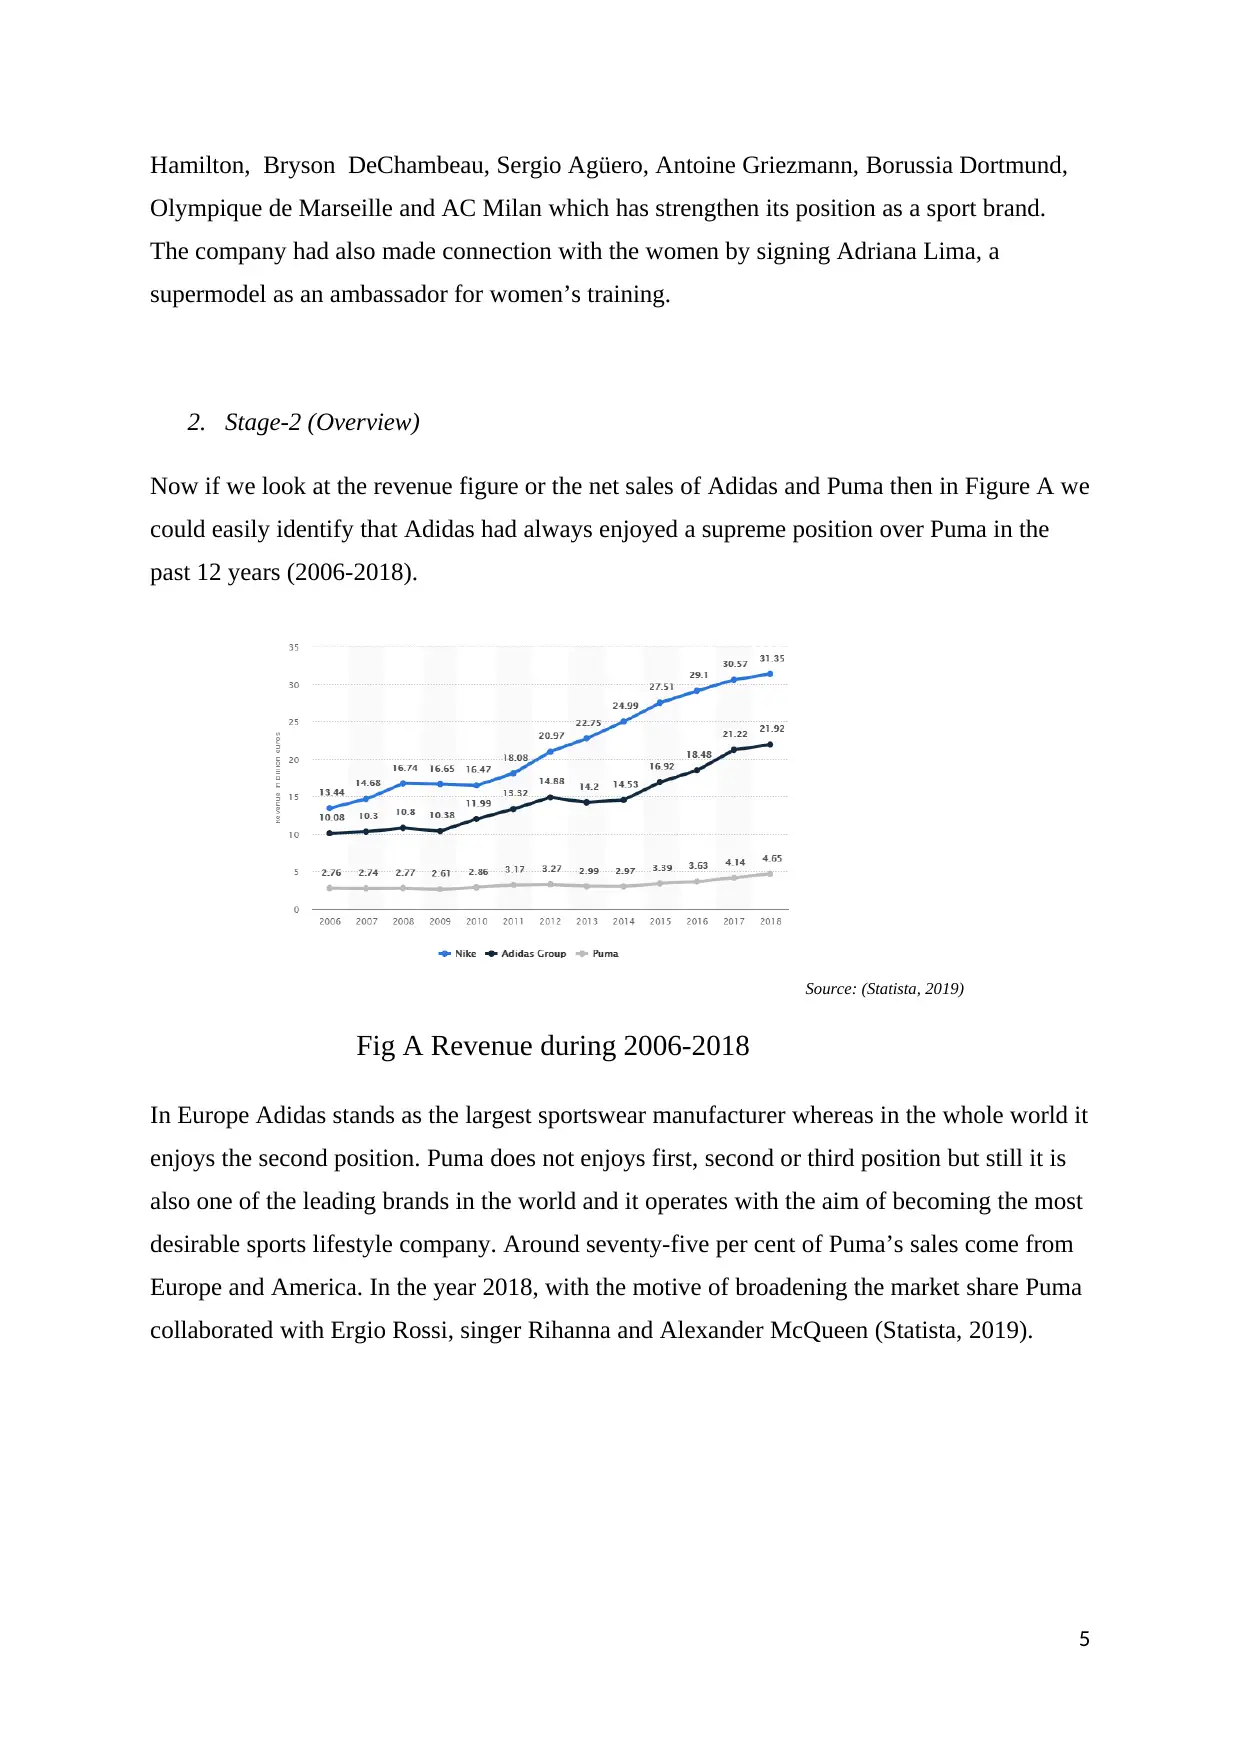
Fig: B Number of Employees in Puma
Table- A
Source: (Annual Reports, N.D.)
Now if we analyse the decrease or increase in number of employees the two companies had
hired then in case of Puma the number had increased by ten per cent and in case of Adidas it
had increased by 18.6%. So here too we could easily interpret that the business of Adidas has
expanded more over the period of five years than Puma.
6
Year Number of employees
2011 46824
2012 46306
2013 49808
2014 53731
2015 55555
Paraphrase This Document
Need a fresh take? Get an instant paraphrase of this document with our AI Paraphraser
2014 2015 2016 2017 2018
0
50
100
150
200
250
Puma Revenue ( € million)
Revenue ( € million)
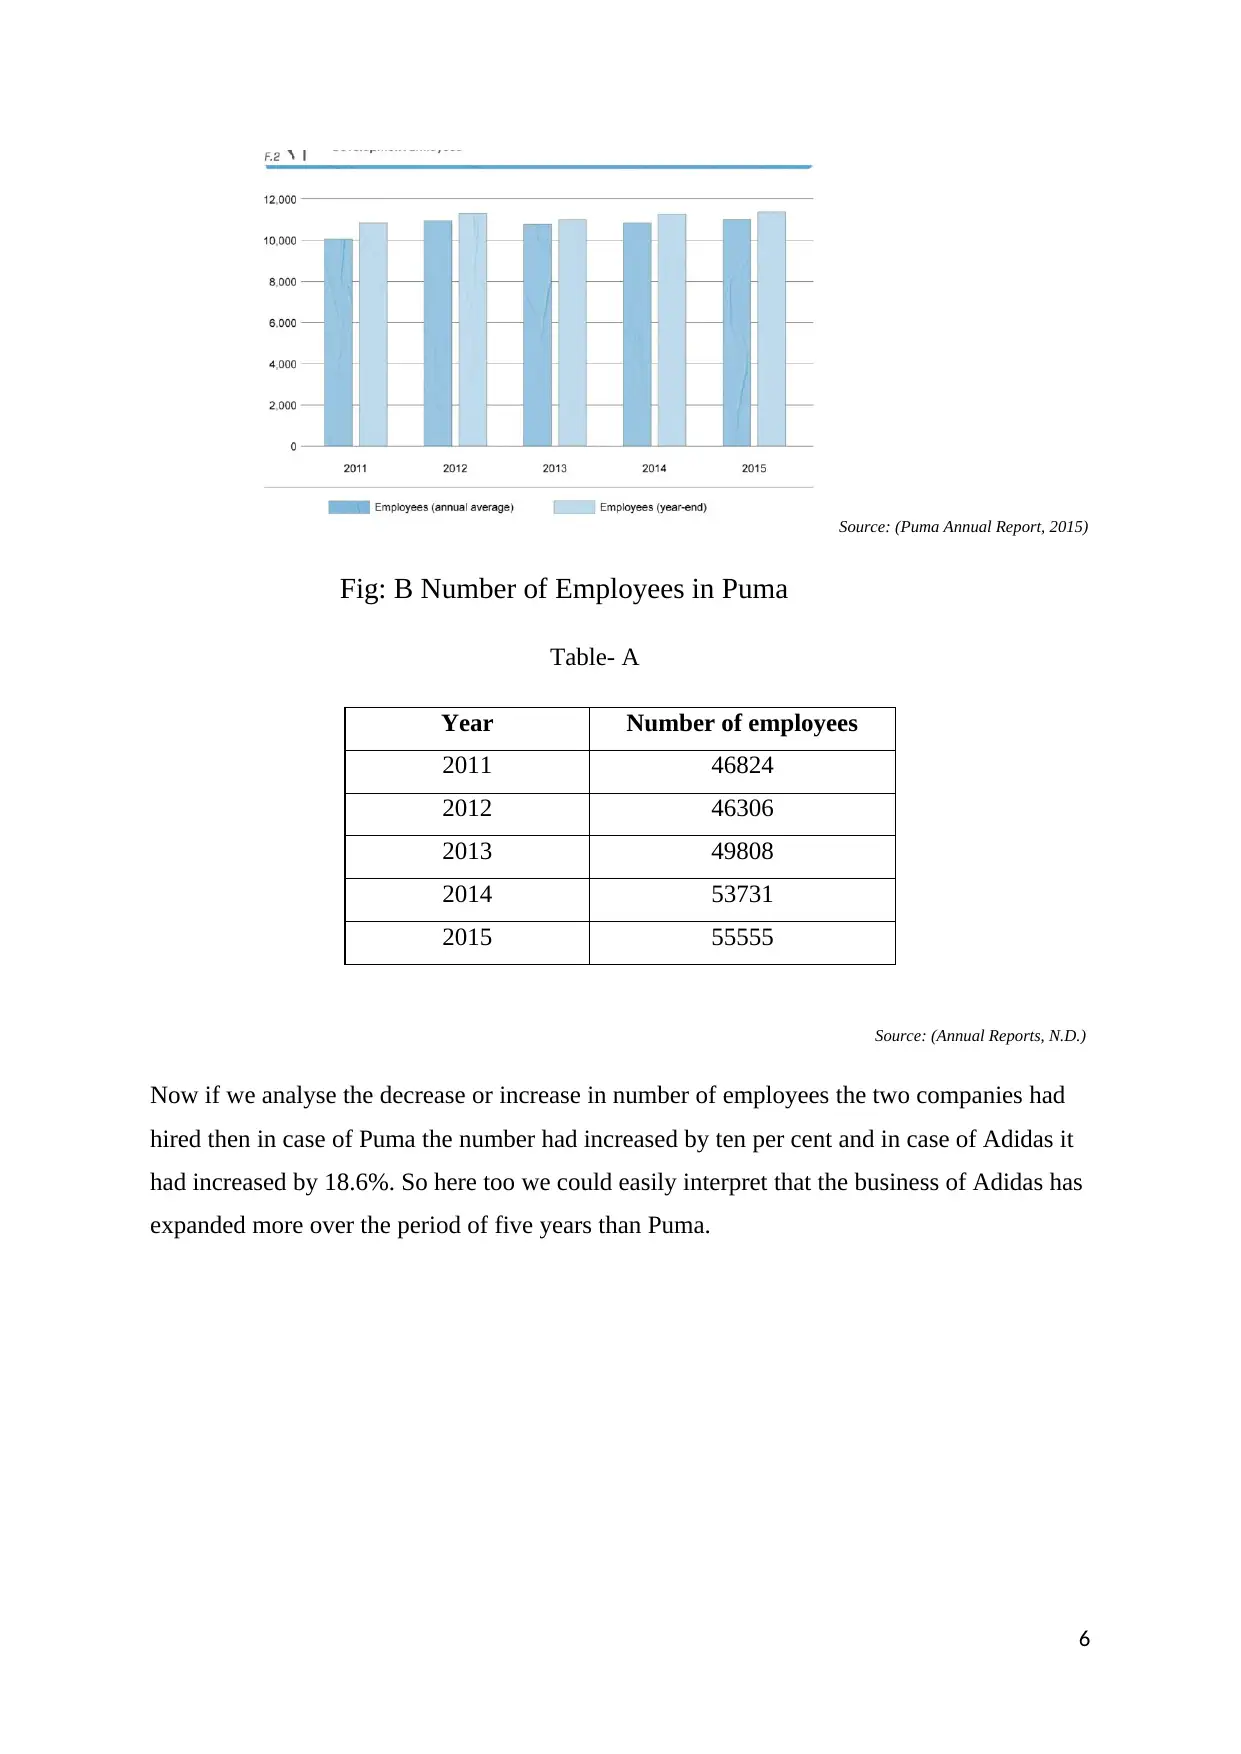
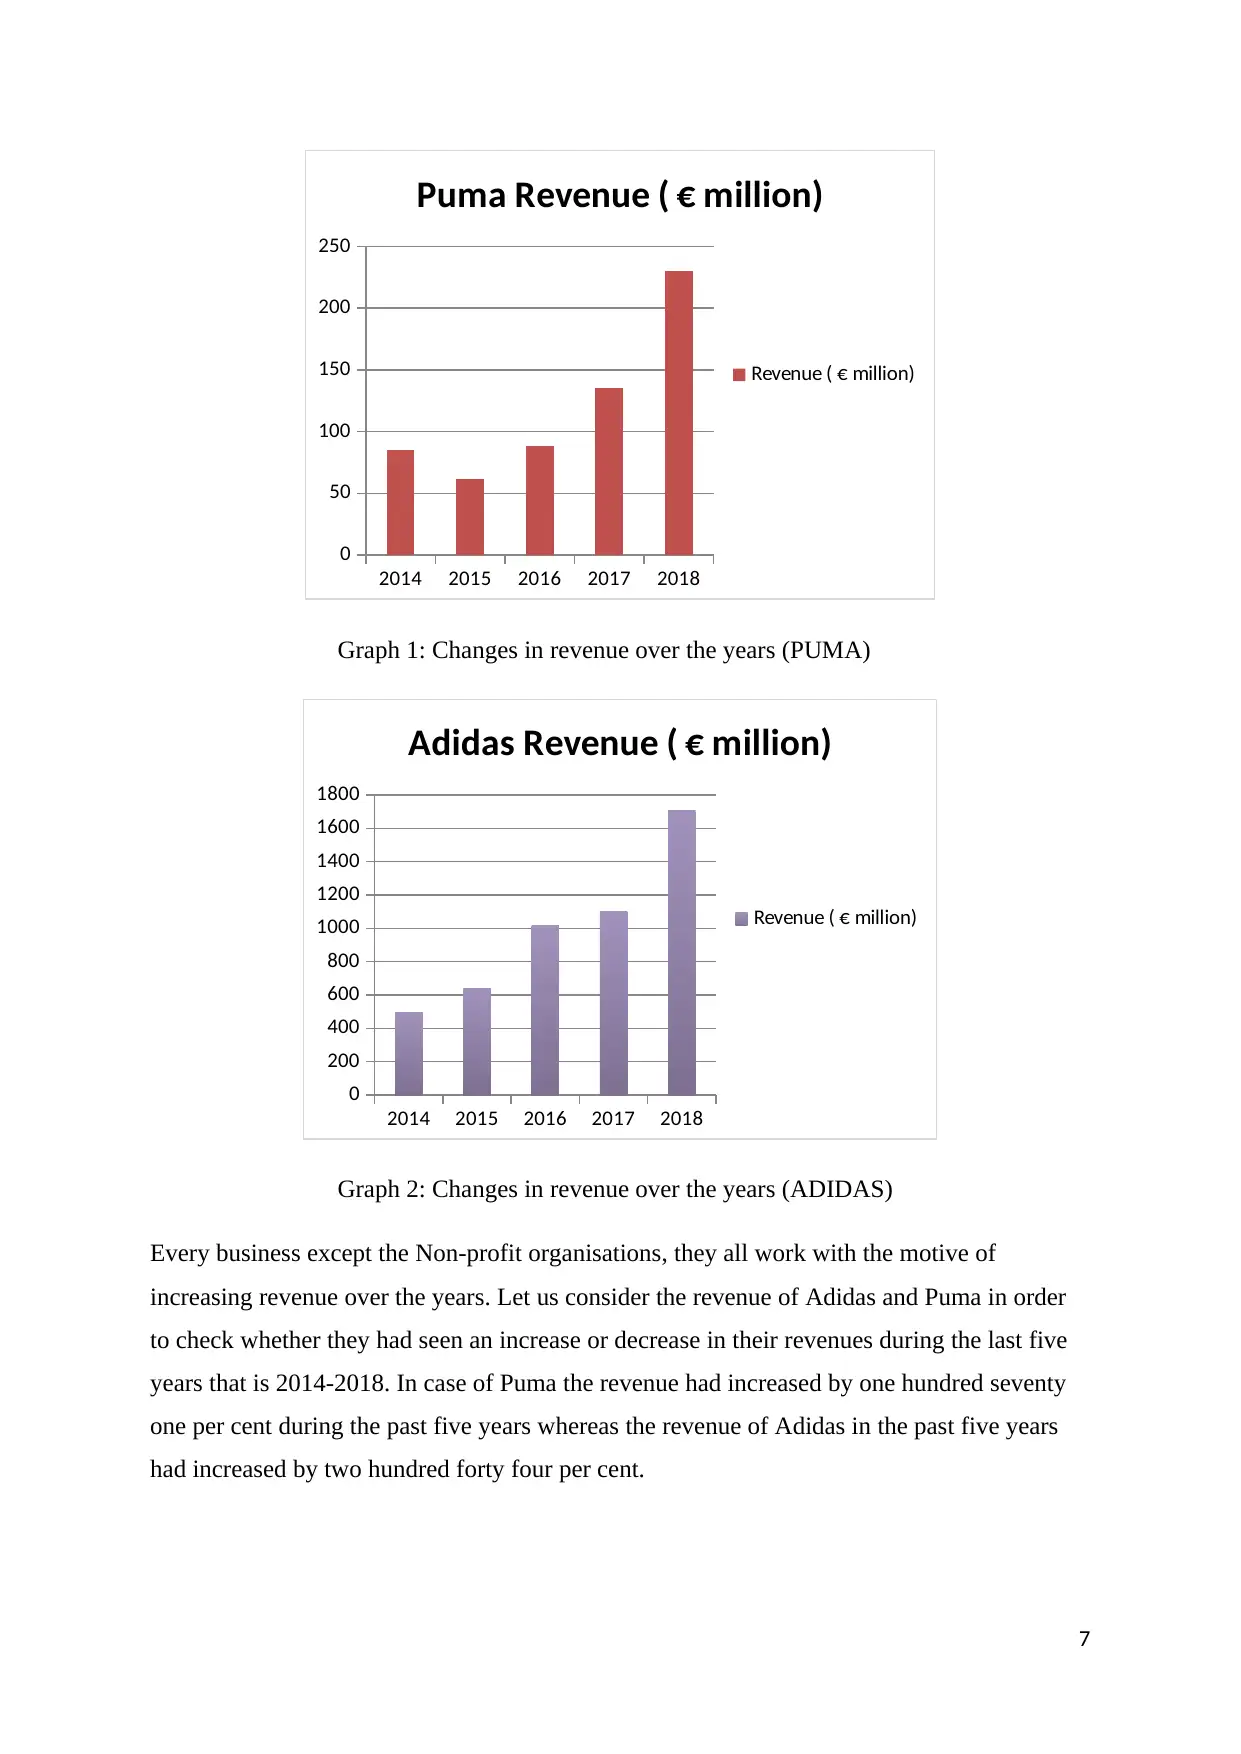
Graph 1: Changes in revenue over the years (PUMA)
2014 2015 2016 2017 2018
0
200
400
600
800
1000
1200
1400
1600
1800
Adidas Revenue ( € million)
Revenue ( € million)
Graph 2: Changes in revenue over the years (ADIDAS)
Every business except the Non-profit organisations, they all work with the motive of
increasing revenue over the years. Let us consider the revenue of Adidas and Puma in order
to check whether they had seen an increase or decrease in their revenues during the last five
years that is 2014-2018. In case of Puma the revenue had increased by one hundred seventy
one per cent during the past five years whereas the revenue of Adidas in the past five years
had increased by two hundred forty four per cent.
7
0
50
100
150
200
250
Puma Revenue ( € million)
Revenue ( € million)
Graph 1: Changes in revenue over the years (PUMA)
2014 2015 2016 2017 2018
0
200
400
600
800
1000
1200
1400
1600
1800
Adidas Revenue ( € million)
Revenue ( € million)
Graph 2: Changes in revenue over the years (ADIDAS)
Every business except the Non-profit organisations, they all work with the motive of
increasing revenue over the years. Let us consider the revenue of Adidas and Puma in order
to check whether they had seen an increase or decrease in their revenues during the last five
years that is 2014-2018. In case of Puma the revenue had increased by one hundred seventy
one per cent during the past five years whereas the revenue of Adidas in the past five years
had increased by two hundred forty four per cent.
7
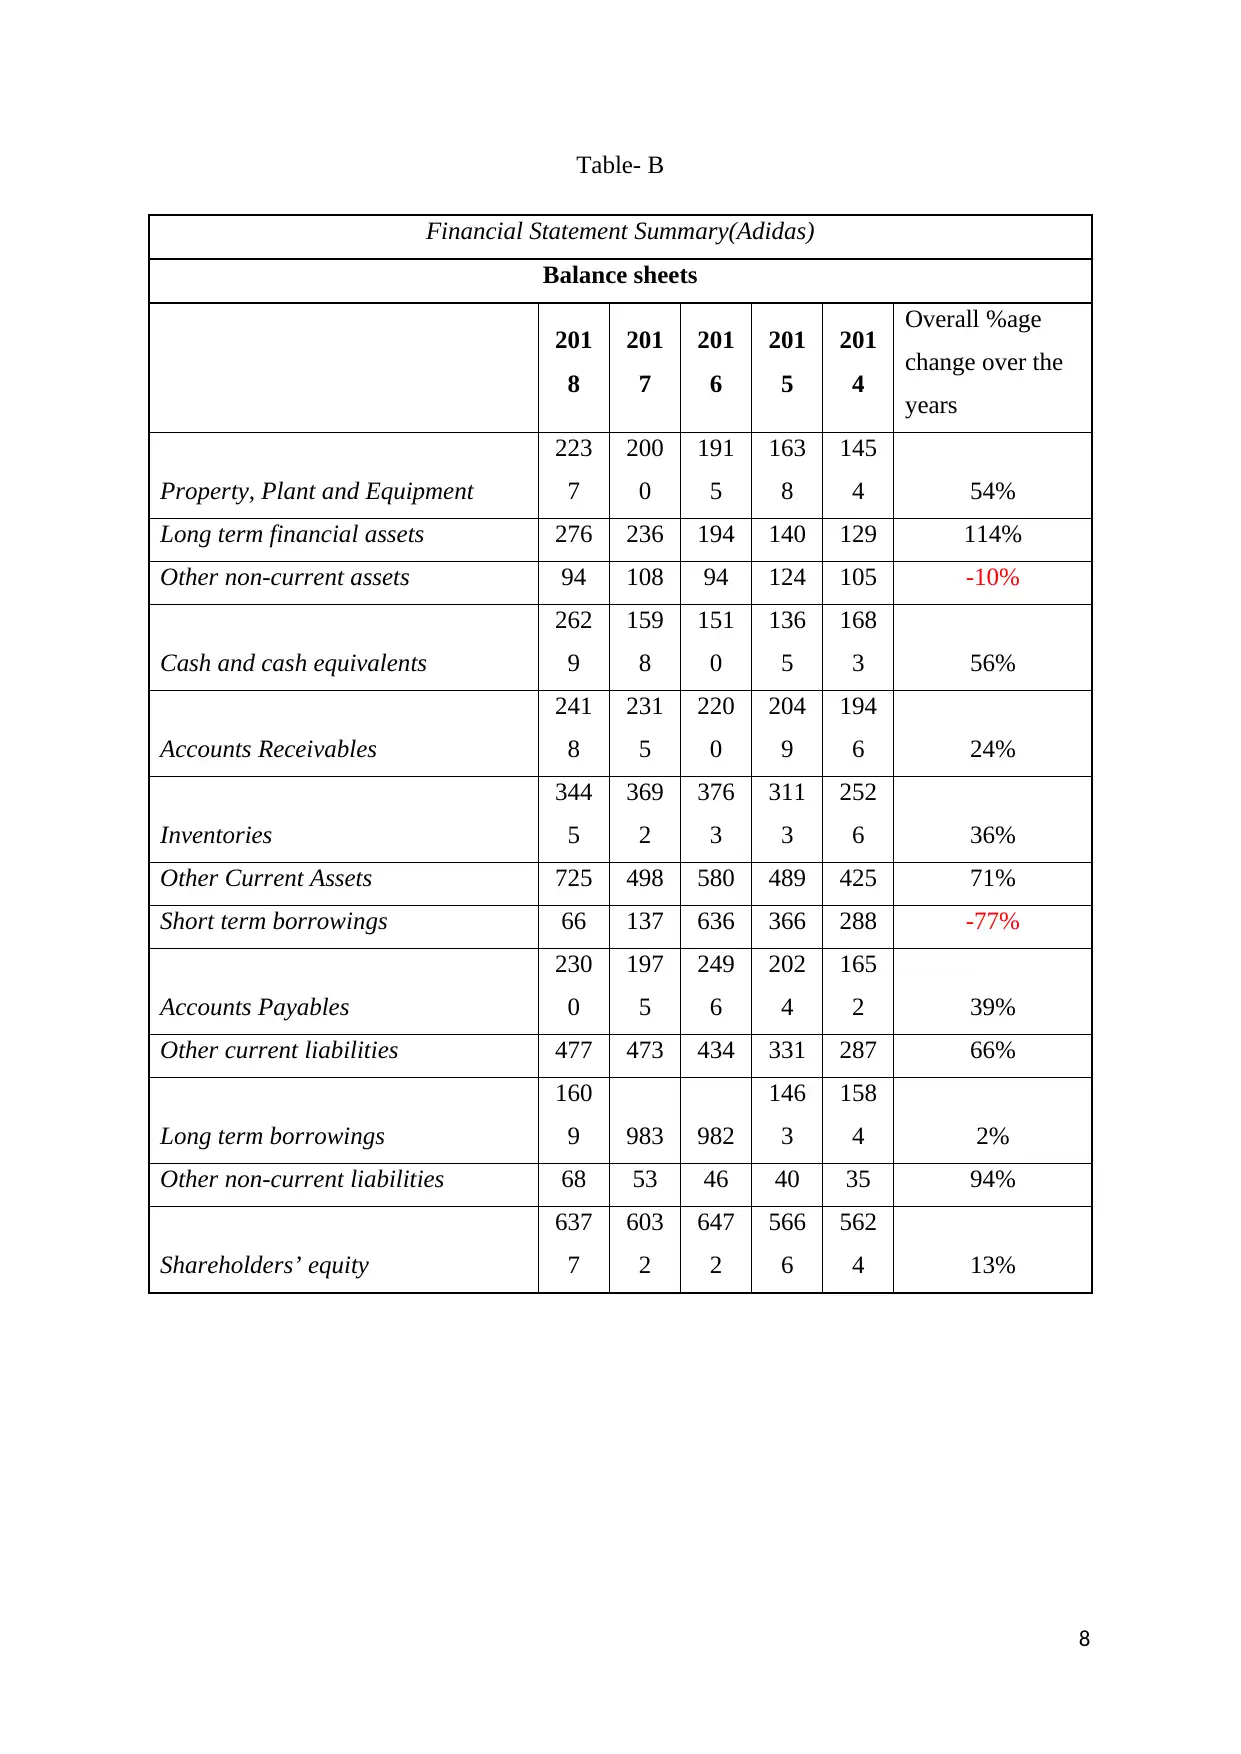
Table- B
Financial Statement Summary(Adidas)
Balance sheets
201
8
201
7
201
6
201
5
201
4
Overall %age
change over the
years
Property, Plant and Equipment
223
7
200
0
191
5
163
8
145
4 54%
Long term financial assets 276 236 194 140 129 114%
Other non-current assets 94 108 94 124 105 -10%
Cash and cash equivalents
262
9
159
8
151
0
136
5
168
3 56%
Accounts Receivables
241
8
231
5
220
0
204
9
194
6 24%
Inventories
344
5
369
2
376
3
311
3
252
6 36%
Other Current Assets 725 498 580 489 425 71%
Short term borrowings 66 137 636 366 288 -77%
Accounts Payables
230
0
197
5
249
6
202
4
165
2 39%
Other current liabilities 477 473 434 331 287 66%
Long term borrowings
160
9 983 982
146
3
158
4 2%
Other non-current liabilities 68 53 46 40 35 94%
Shareholders’ equity
637
7
603
2
647
2
566
6
562
4 13%
8
⊘ This is a preview!⊘
Do you want full access?
Subscribe today to unlock all pages.
Trusted by 1+ million students worldwide
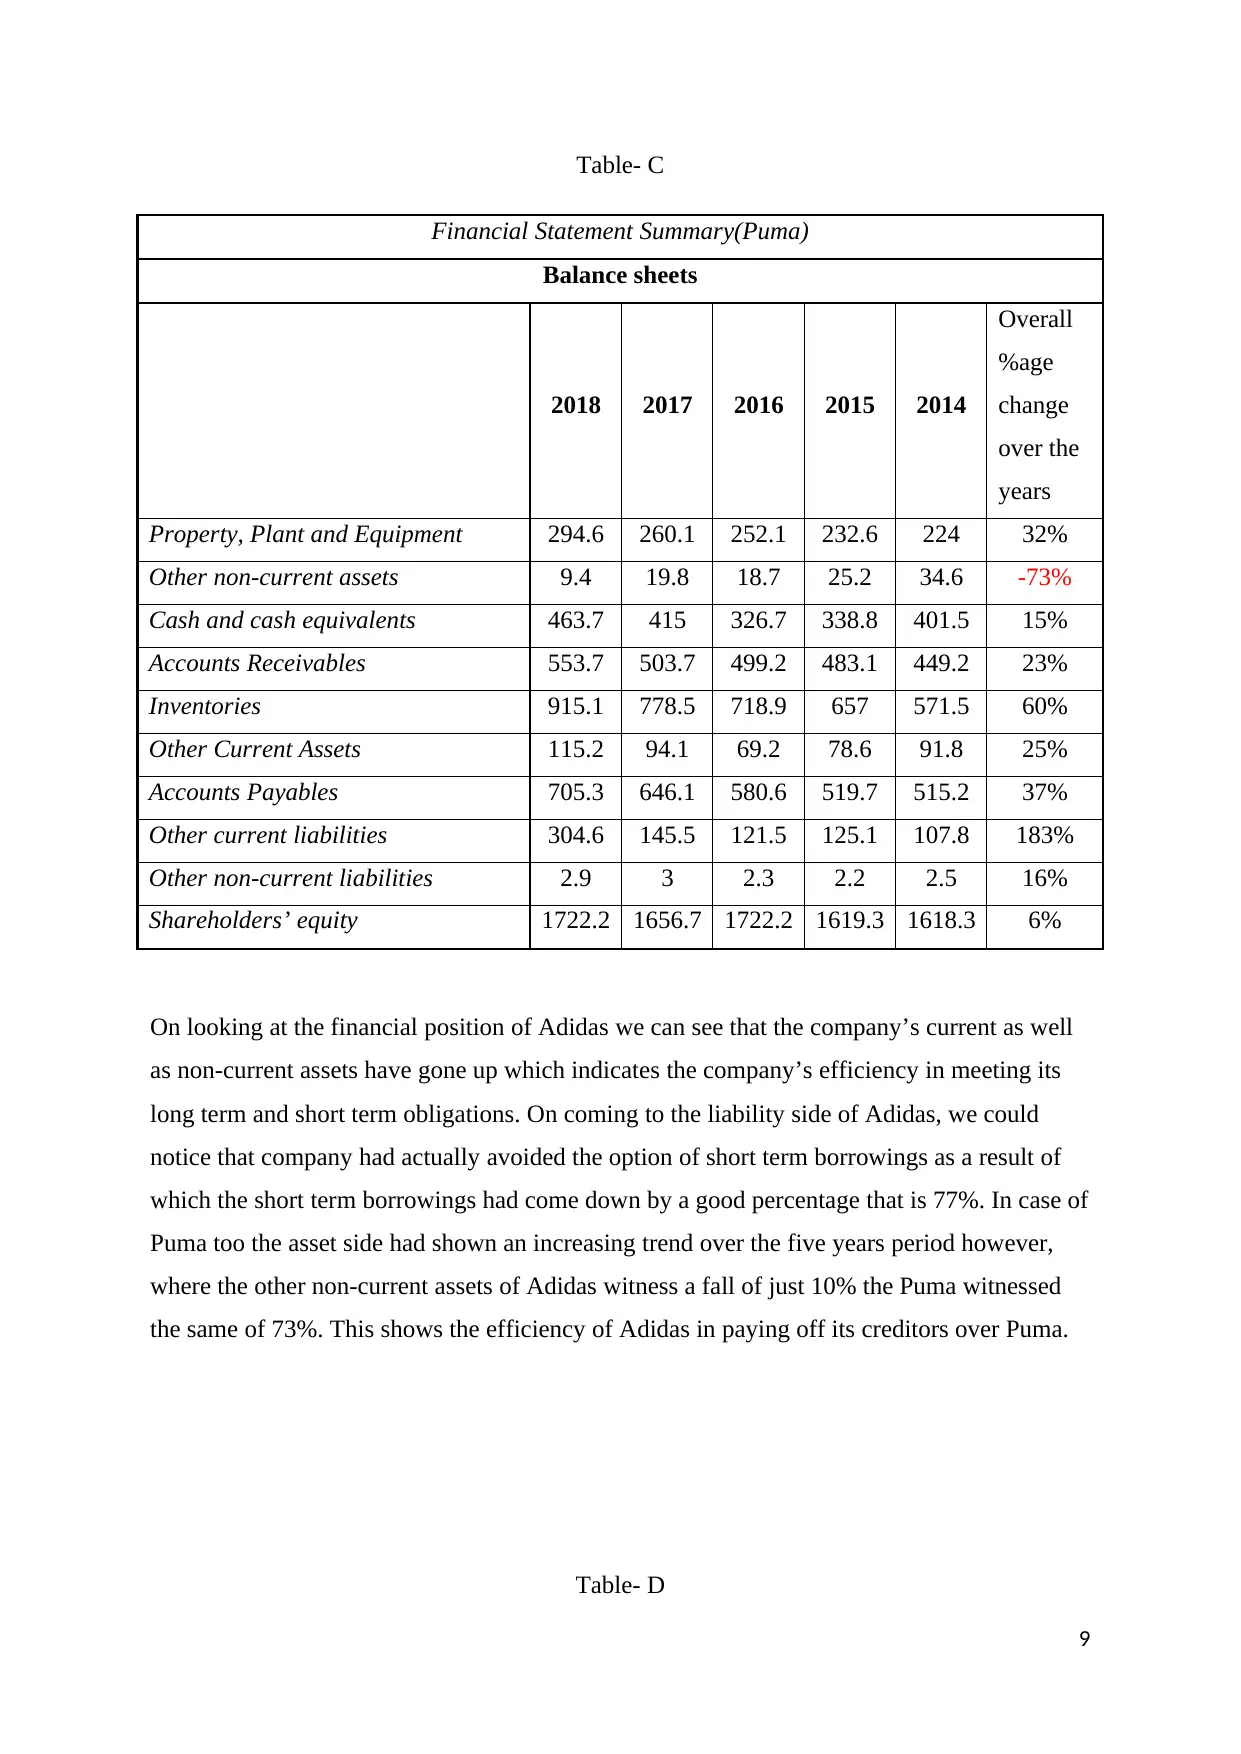
Table- C
Financial Statement Summary(Puma)
Balance sheets
2018 2017 2016 2015 2014
Overall
%age
change
over the
years
Property, Plant and Equipment 294.6 260.1 252.1 232.6 224 32%
Other non-current assets 9.4 19.8 18.7 25.2 34.6 -73%
Cash and cash equivalents 463.7 415 326.7 338.8 401.5 15%
Accounts Receivables 553.7 503.7 499.2 483.1 449.2 23%
Inventories 915.1 778.5 718.9 657 571.5 60%
Other Current Assets 115.2 94.1 69.2 78.6 91.8 25%
Accounts Payables 705.3 646.1 580.6 519.7 515.2 37%
Other current liabilities 304.6 145.5 121.5 125.1 107.8 183%
Other non-current liabilities 2.9 3 2.3 2.2 2.5 16%
Shareholders’ equity 1722.2 1656.7 1722.2 1619.3 1618.3 6%
On looking at the financial position of Adidas we can see that the company’s current as well
as non-current assets have gone up which indicates the company’s efficiency in meeting its
long term and short term obligations. On coming to the liability side of Adidas, we could
notice that company had actually avoided the option of short term borrowings as a result of
which the short term borrowings had come down by a good percentage that is 77%. In case of
Puma too the asset side had shown an increasing trend over the five years period however,
where the other non-current assets of Adidas witness a fall of just 10% the Puma witnessed
the same of 73%. This shows the efficiency of Adidas in paying off its creditors over Puma.
Table- D
9
Paraphrase This Document
Need a fresh take? Get an instant paraphrase of this document with our AI Paraphraser
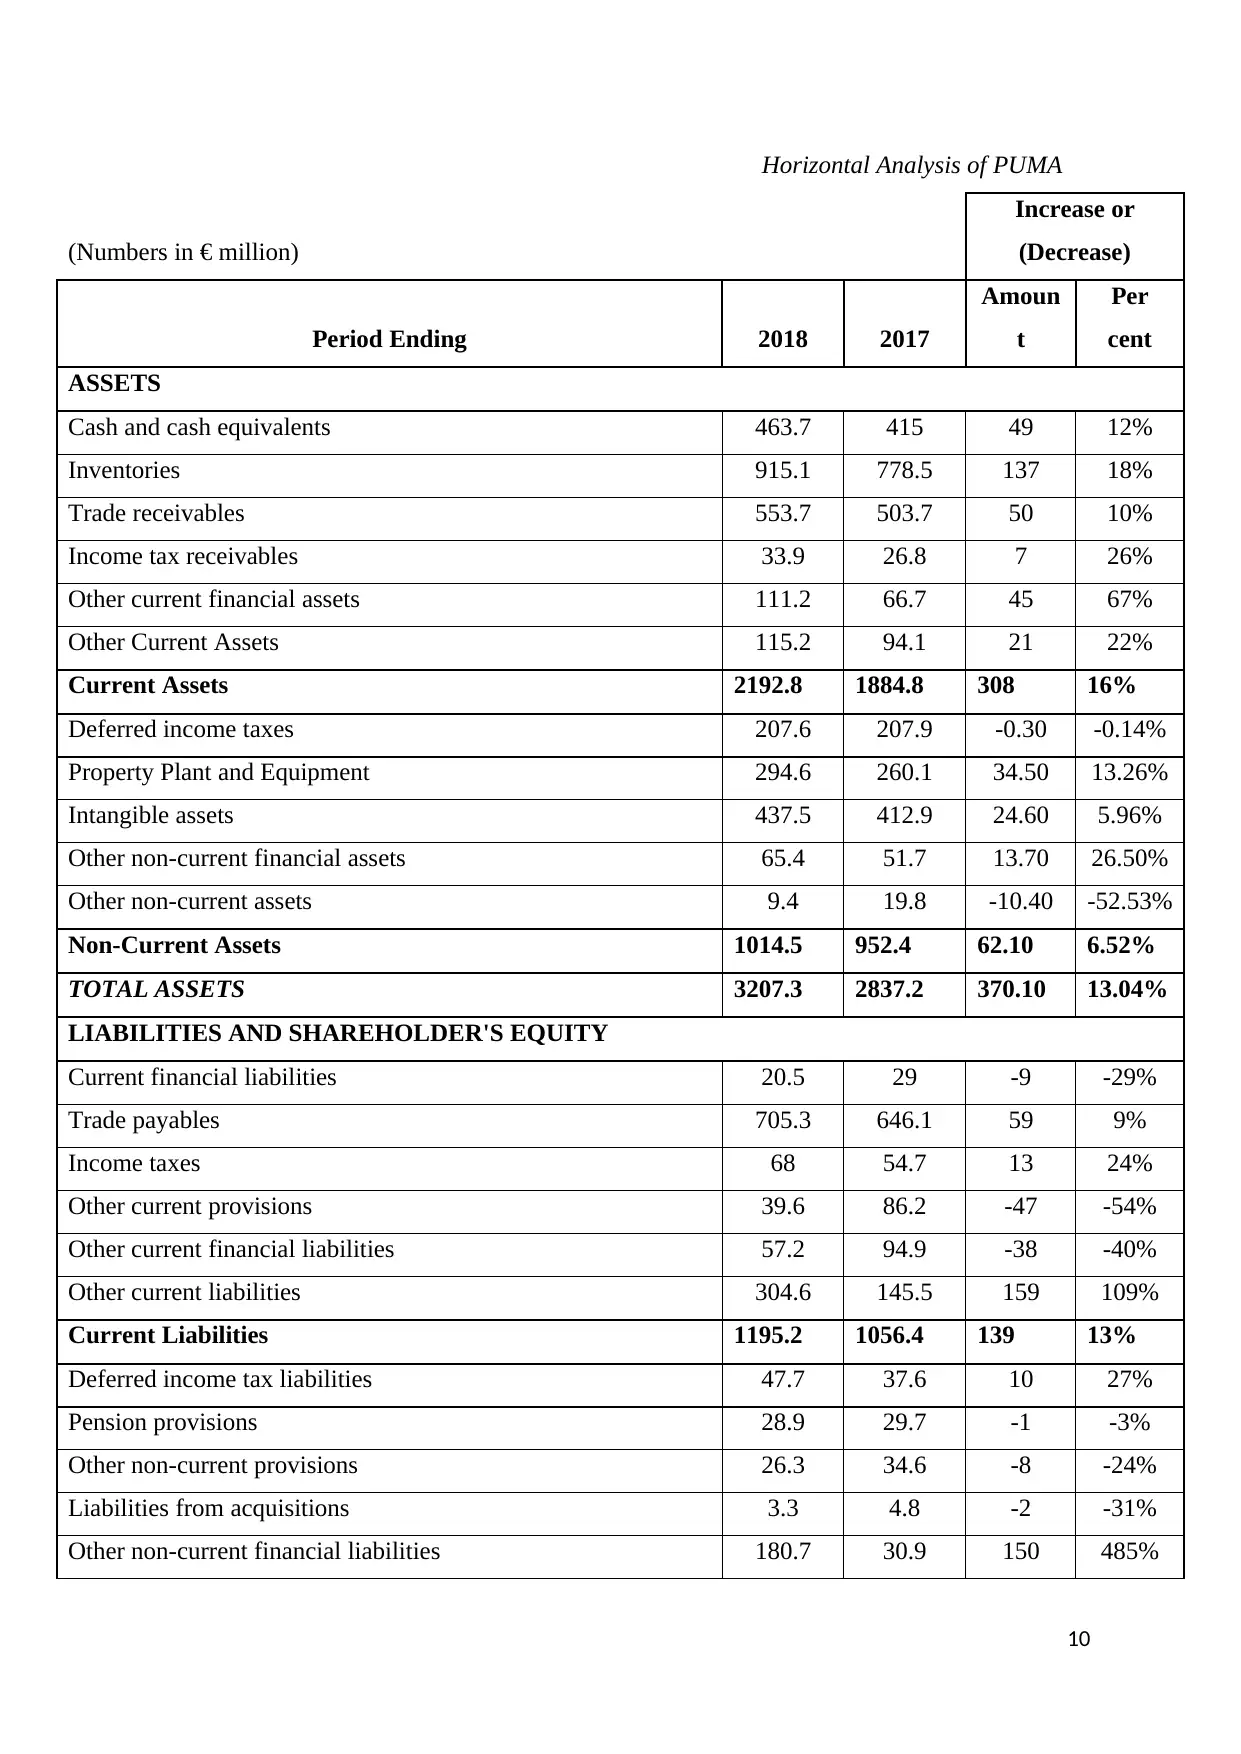
Horizontal Analysis of PUMA
(Numbers in € million)
Increase or
(Decrease)
Period Ending 2018 2017
Amoun
t
Per
cent
ASSETS
Cash and cash equivalents 463.7 415 49 12%
Inventories 915.1 778.5 137 18%
Trade receivables 553.7 503.7 50 10%
Income tax receivables 33.9 26.8 7 26%
Other current financial assets 111.2 66.7 45 67%
Other Current Assets 115.2 94.1 21 22%
Current Assets 2192.8 1884.8 308 16%
Deferred income taxes 207.6 207.9 -0.30 -0.14%
Property Plant and Equipment 294.6 260.1 34.50 13.26%
Intangible assets 437.5 412.9 24.60 5.96%
Other non-current financial assets 65.4 51.7 13.70 26.50%
Other non-current assets 9.4 19.8 -10.40 -52.53%
Non-Current Assets 1014.5 952.4 62.10 6.52%
TOTAL ASSETS 3207.3 2837.2 370.10 13.04%
LIABILITIES AND SHAREHOLDER'S EQUITY
Current financial liabilities 20.5 29 -9 -29%
Trade payables 705.3 646.1 59 9%
Income taxes 68 54.7 13 24%
Other current provisions 39.6 86.2 -47 -54%
Other current financial liabilities 57.2 94.9 -38 -40%
Other current liabilities 304.6 145.5 159 109%
Current Liabilities 1195.2 1056.4 139 13%
Deferred income tax liabilities 47.7 37.6 10 27%
Pension provisions 28.9 29.7 -1 -3%
Other non-current provisions 26.3 34.6 -8 -24%
Liabilities from acquisitions 3.3 4.8 -2 -31%
Other non-current financial liabilities 180.7 30.9 150 485%
10
Other non-current liabilities 2.9 3 0 -3%
Non-Current Liabilities 289.8 140.6 149 106%
Shareholders‘ equity 1,722.20 1,656.70 66 4%
TOTAL LIABILITIES AND SHAREHOLDERS' EQUITY 3,207.20 2,853.70 354 12%
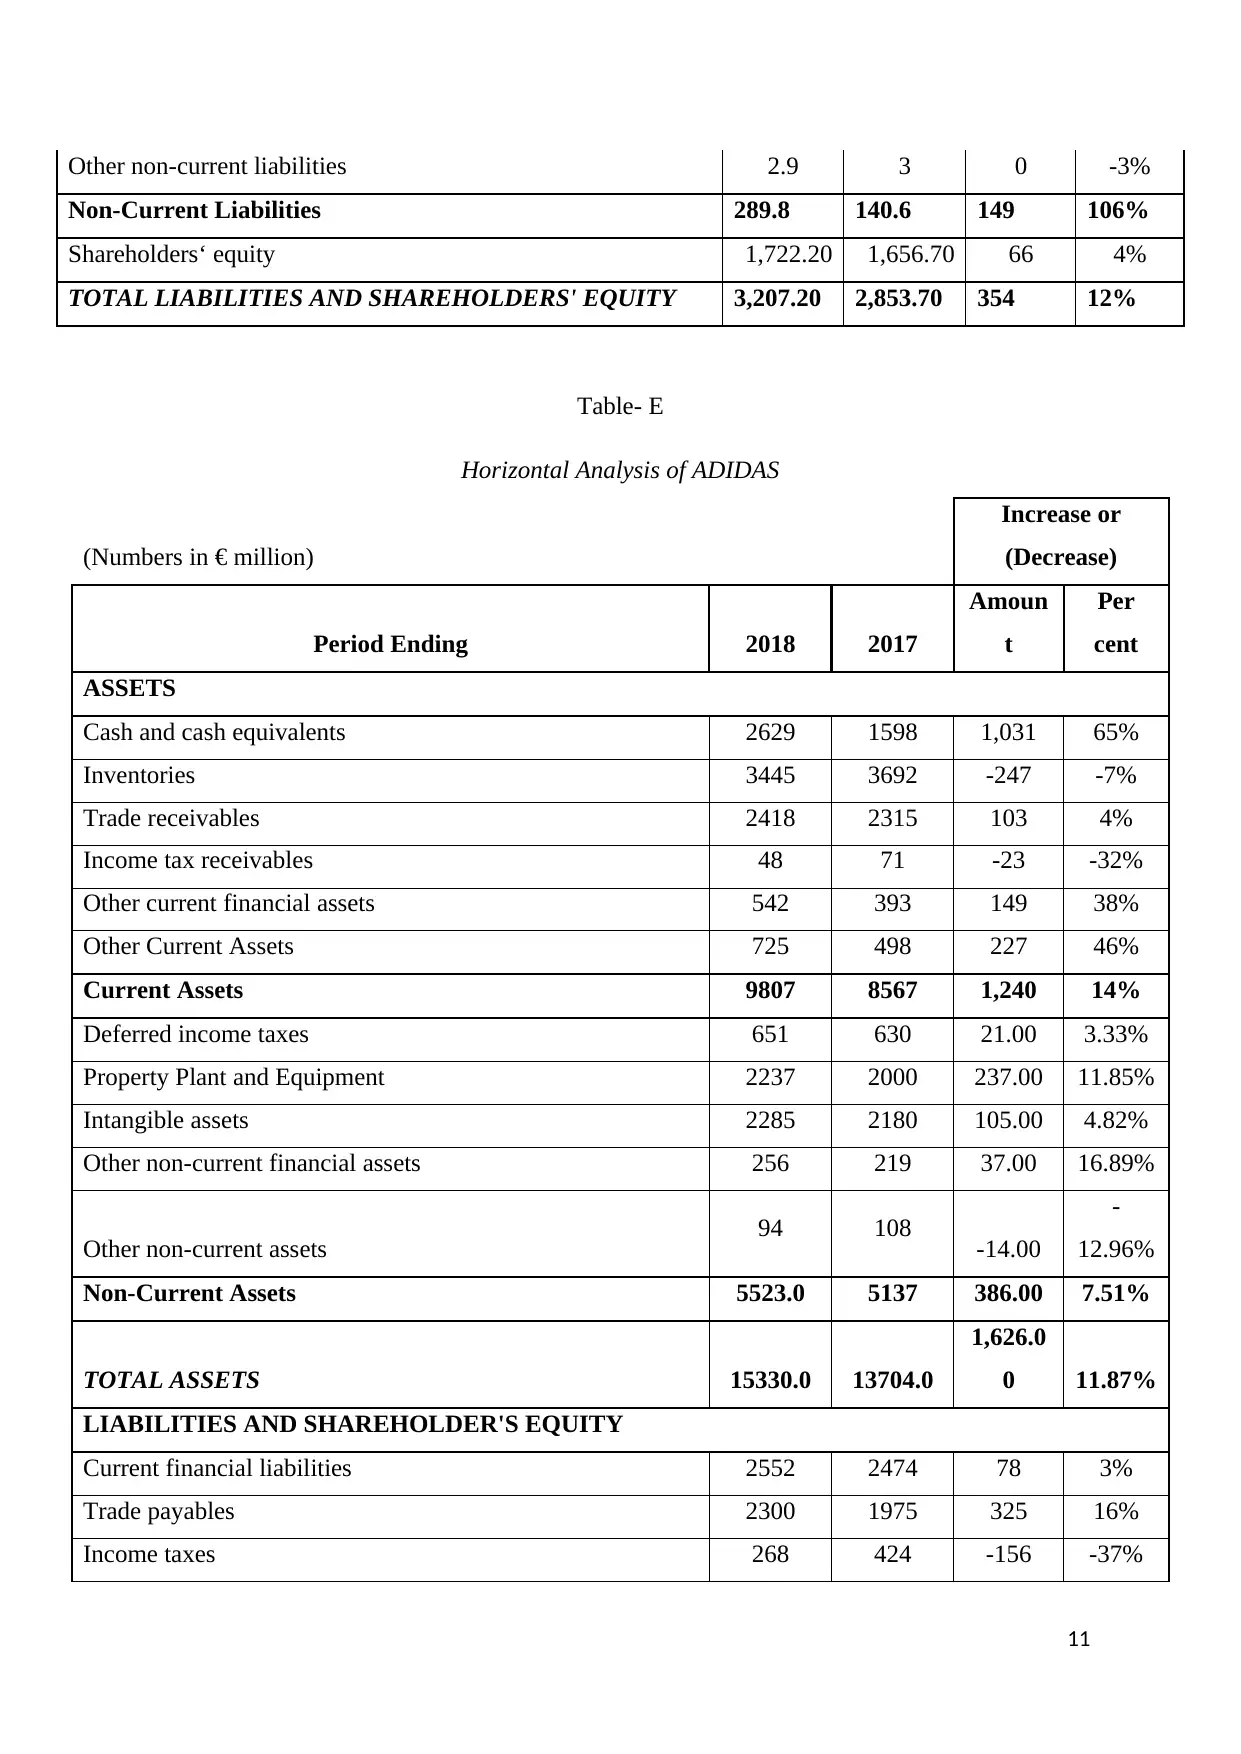
Table- E
Horizontal Analysis of ADIDAS
(Numbers in € million)
Increase or
(Decrease)
Period Ending 2018 2017
Amoun
t
Per
cent
ASSETS
Cash and cash equivalents 2629 1598 1,031 65%
Inventories 3445 3692 -247 -7%
Trade receivables 2418 2315 103 4%
Income tax receivables 48 71 -23 -32%
Other current financial assets 542 393 149 38%
Other Current Assets 725 498 227 46%
Current Assets 9807 8567 1,240 14%
Deferred income taxes 651 630 21.00 3.33%
Property Plant and Equipment 2237 2000 237.00 11.85%
Intangible assets 2285 2180 105.00 4.82%
Other non-current financial assets 256 219 37.00 16.89%
Other non-current assets 94 108 -14.00
-
12.96%
Non-Current Assets 5523.0 5137 386.00 7.51%
TOTAL ASSETS 15330.0 13704.0
1,626.0
0 11.87%
LIABILITIES AND SHAREHOLDER'S EQUITY
Current financial liabilities 2552 2474 78 3%
Trade payables 2300 1975 325 16%
Income taxes 268 424 -156 -37%
11
Non-Current Liabilities 289.8 140.6 149 106%
Shareholders‘ equity 1,722.20 1,656.70 66 4%
TOTAL LIABILITIES AND SHAREHOLDERS' EQUITY 3,207.20 2,853.70 354 12%
Table- E
Horizontal Analysis of ADIDAS
(Numbers in € million)
Increase or
(Decrease)
Period Ending 2018 2017
Amoun
t
Per
cent
ASSETS
Cash and cash equivalents 2629 1598 1,031 65%
Inventories 3445 3692 -247 -7%
Trade receivables 2418 2315 103 4%
Income tax receivables 48 71 -23 -32%
Other current financial assets 542 393 149 38%
Other Current Assets 725 498 227 46%
Current Assets 9807 8567 1,240 14%
Deferred income taxes 651 630 21.00 3.33%
Property Plant and Equipment 2237 2000 237.00 11.85%
Intangible assets 2285 2180 105.00 4.82%
Other non-current financial assets 256 219 37.00 16.89%
Other non-current assets 94 108 -14.00
-
12.96%
Non-Current Assets 5523.0 5137 386.00 7.51%
TOTAL ASSETS 15330.0 13704.0
1,626.0
0 11.87%
LIABILITIES AND SHAREHOLDER'S EQUITY
Current financial liabilities 2552 2474 78 3%
Trade payables 2300 1975 325 16%
Income taxes 268 424 -156 -37%
11
⊘ This is a preview!⊘
Do you want full access?
Subscribe today to unlock all pages.
Trusted by 1+ million students worldwide
1 out of 21
Related Documents


Your All-in-One AI-Powered Toolkit for Academic Success.
+13062052269
info@desklib.com
Available 24*7 on WhatsApp / Email
![[object Object]](/_next/static/media/star-bottom.7253800d.svg)
Unlock your academic potential
Copyright © 2020–2026 A2Z Services. All Rights Reserved. Developed and managed by ZUCOL.