Accounting & Finance for Managers: AG Barr, Britvic, Coca Cola
VerifiedAdded on 2023/06/18
|19
|3523
|126
Report
AI Summary
This report provides a comparative financial analysis of AG Barr Plc, Britvic Plc, and Coca Cola Plc, evaluating their strategic plans, financial goals, and performance using financial ratios and non-financial data from the past three years. It assesses profitability, liquidity, financial leverage, efficiency, and market test ratios to rank the companies and determine the best performing one. The report also explores whether investing in the top-performing company, AG Barr Plc, would be a positive investment opportunity, considering its ability to meet financial obligations. Furthermore, it briefly discusses the long-term sources of finance available to the company. Desklib offers a wealth of similar solved assignments and past papers to aid students in their studies.

Accounting & Finance for
Managers
Managers
Paraphrase This Document
Need a fresh take? Get an instant paraphrase of this document with our AI Paraphraser
Table of Contents
INTRODUCTION...........................................................................................................................3
Section A..........................................................................................................................................3
Question 1....................................................................................................................................3
1a Strategic Plans of AG Barr Plc., Britvic Plc. and Coca Cola Plc............................................3
1b Critical evaluation of the performance of the companies using latest three year financial
and non-financial data..................................................................................................................5
1c Why best performing company would/ would not be a positive investment opportunity....14
SECTION B...................................................................................................................................15
Question 2..................................................................................................................................15
2a. Critical evaluation of long term sources of finance.............................................................15
2b. ..............................................................................................................................................16
CONCLUSION..............................................................................................................................16
REFERENCES................................................................................................................................1
INTRODUCTION
Business finance refers to the funds which is availed by the business owners to meet its
operational as well as financial goals. The report will discuss the strategic plan, financial goals
and ratio analysis of three company i.e., AG Barr Plc., Britvic Plc and Coca Cola Plc in order to
rank company between first to third. Further, the report will also discuss why investing in best
performing company is would or would not be a positive investment opportunities. The report
will also discuss the long-term finance sources available to company.
Section A
Question 1
1a Strategic Plans of AG Barr Plc., Britvic Plc. and Coca Cola Plc
Strategic Plan of AG Barr Plc.
Financial Goals of company:
The company wants to launch new flavour of soft drinks in order to increase the organic
revenue from 4% to 6%. The company also looking forward to saving funds to pay off retirement liabilities of
employee s (Islami and Rio, 2019).
Measurable success indicator
The company will use financial ratios such as Earning per share to measure its financial
growth.
In order to measure the financial sustainability, the company will analyse its current ratio. The company uses net profit margin to measure financial performance of company.
Nature of Decision The financial goals of the AG Barr company require both short-term and long-term
decision.
Impact of decision on both financial goals and performance
The short-term decision regarding launching of new flavour of products help the
company to increase revenue percentage.
The long-term decision regarding creation of saving fund account help the company to
achieve its retirement liabilities goals (Guo and Wang, 2019).
⊘ This is a preview!⊘
Do you want full access?
Subscribe today to unlock all pages.
Trusted by 1+ million students worldwide
This decision increases the gross and net profit margin of the company which is currently
46.52% and 14.52% and also reduces the earning per share of the company.
Strategic Plan of Britvic Plc.
Financial Goals of company: The Britvic company wants to expand its business worldwide and for this they want to
restructure its capital sources.
Measurable success indicator
The Britvic company benchmark their own company against competitors to measure its
financial growth.
Operating surplus ratio is used by the company for measuring financial sustainability. In order to measure financial performance, the company will use debt to equity ratio to
which is 163.8 in the year 2019 (Cashwell, Copley and Dugan, 2019).
Nature of Decision In order to achieve the expansion and capital restructuring financial goal the company
require long-term decision.
Impact of decision on both financial goals and performance
This decision regarding analysing and restructuring capital sources helps the company to
achieve its expansion goals.
The impact of this decision over the business is that their debt-equity ratio get change
which may be higher or lower when compared to current year ratio of 163.8 (Krauß and
Vetter, 2020).
Strategic Plan of Coca Cola Plc.
Financial Goals of company:
Coca cola aims to maximize their profits from 12% to 15% and also the earnings per
share from 12 to 20 while maintaining a long-term sustainability growth within beverage
industry. In order to do so, the company will allow discounts to customers on drinks for the period
of winter which further increase its sales.
Measurable success indicator
Paraphrase This Document
Need a fresh take? Get an instant paraphrase of this document with our AI Paraphraser
Coca cola company basically uses profitability ratio such as return on capital employed
and net profit margin along with the earning per share to measure financial growth and
performance. The company measure its financial sustainability by using the total debt service cover
ratio and assets sustainability ratio (Taous and et.al., 2020).
Nature of Decision The coca cola company required short-term decisions to achieve its financial goals of
profit maximization and high earning per share.
Impact of decision on both financial goals and performance
Currently, the coco cola company net profit margin and return on capital employed is
12.1 and 10.9% while its earning per share is 12.
The short-term decision regarding allowing discount on product will help the company to
increase its profit and earning per share financial goals and performance (Perini and et.al.,
2019).
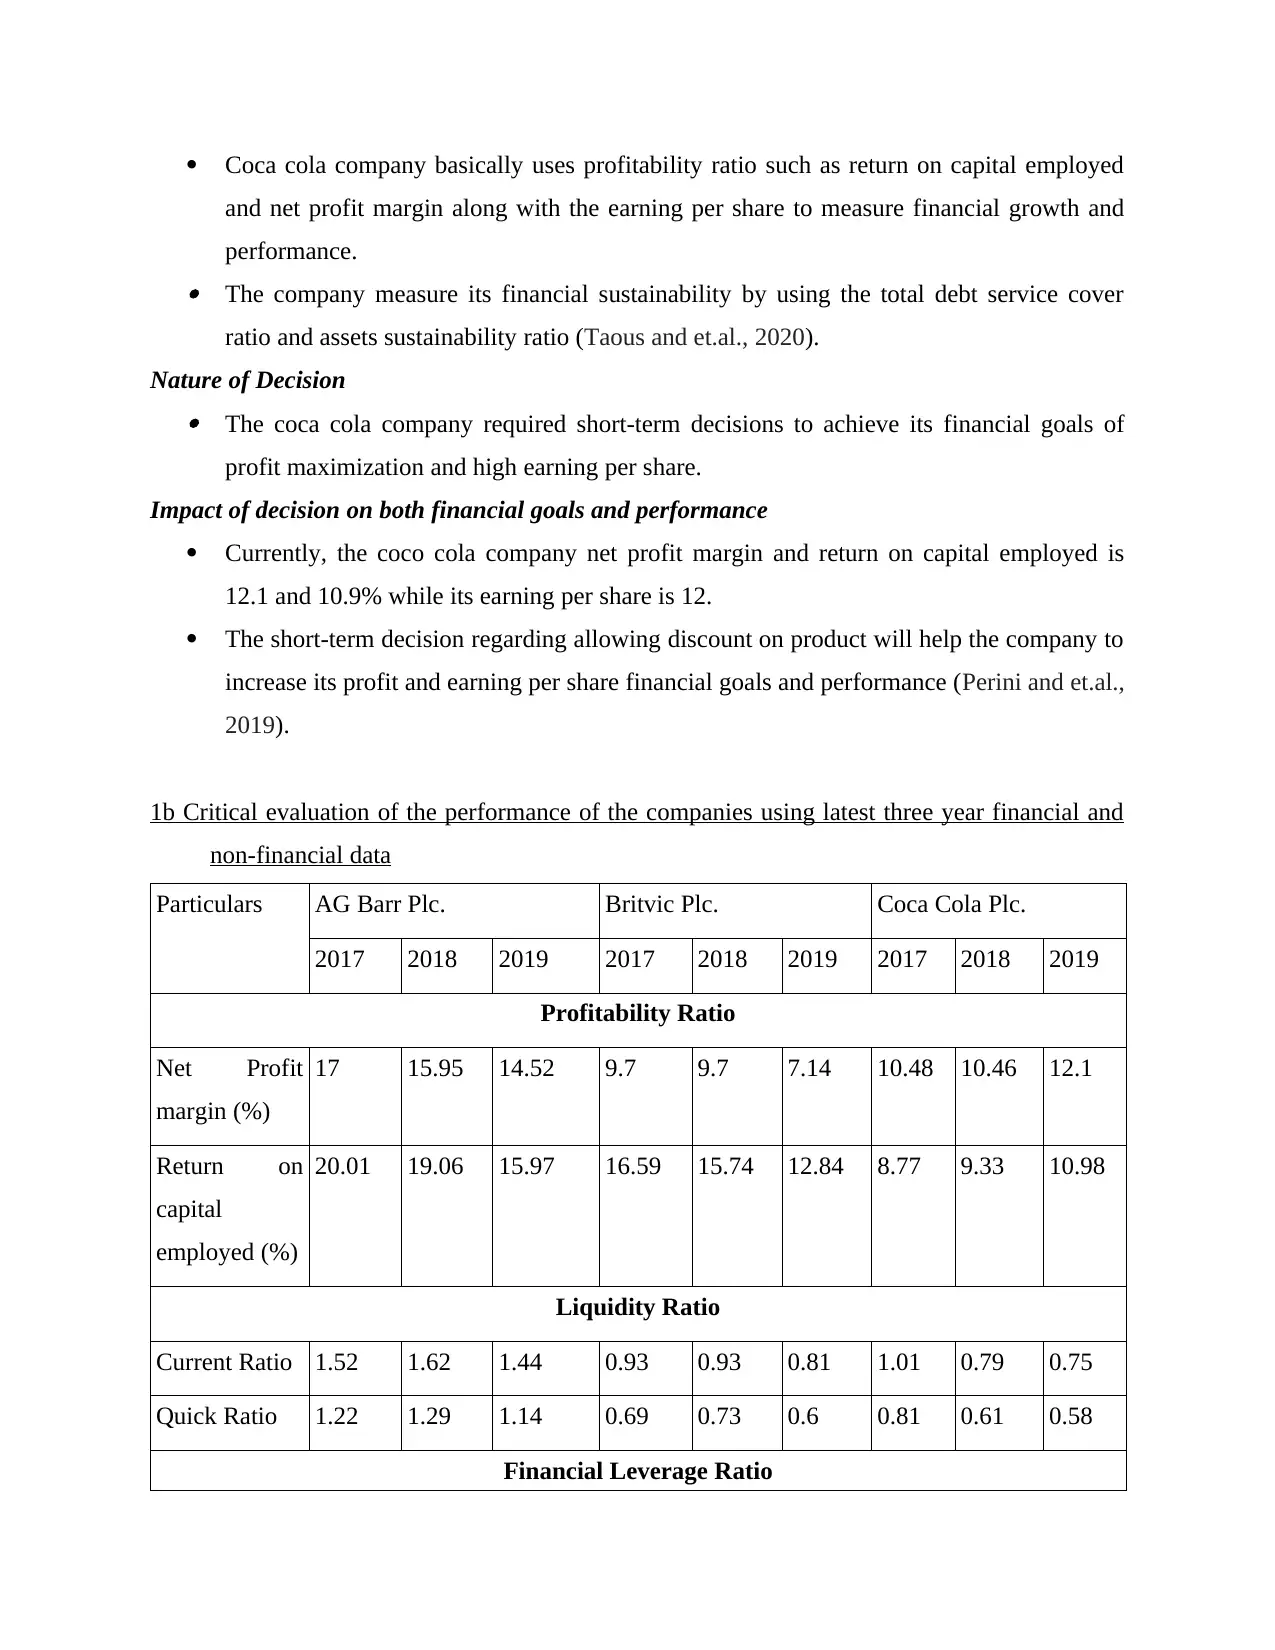
1b Critical evaluation of the performance of the companies using latest three year financial and
non-financial data
Particulars AG Barr Plc. Britvic Plc. Coca Cola Plc.
2017 2018 2019 2017 2018 2019 2017 2018 2019
Profitability Ratio
Net Profit
margin (%)
17 15.95 14.52 9.7 9.7 7.14 10.48 10.46 12.1
Return on
capital
employed (%)
20.01 19.06 15.97 16.59 15.74 12.84 8.77 9.33 10.98
Liquidity Ratio
Current Ratio 1.52 1.62 1.44 0.93 0.93 0.81 1.01 0.79 0.75
Quick Ratio 1.22 1.29 1.14 0.69 0.73 0.6 0.81 0.61 0.58
Financial Leverage Ratio
and net profit margin along with the earning per share to measure financial growth and
performance. The company measure its financial sustainability by using the total debt service cover
ratio and assets sustainability ratio (Taous and et.al., 2020).
Nature of Decision The coca cola company required short-term decisions to achieve its financial goals of
profit maximization and high earning per share.
Impact of decision on both financial goals and performance
Currently, the coco cola company net profit margin and return on capital employed is
12.1 and 10.9% while its earning per share is 12.
The short-term decision regarding allowing discount on product will help the company to
increase its profit and earning per share financial goals and performance (Perini and et.al.,
2019).
1b Critical evaluation of the performance of the companies using latest three year financial and
non-financial data
Particulars AG Barr Plc. Britvic Plc. Coca Cola Plc.
2017 2018 2019 2017 2018 2019 2017 2018 2019
Profitability Ratio
Net Profit
margin (%)
17 15.95 14.52 9.7 9.7 7.14 10.48 10.46 12.1
Return on
capital
employed (%)
20.01 19.06 15.97 16.59 15.74 12.84 8.77 9.33 10.98
Liquidity Ratio
Current Ratio 1.52 1.62 1.44 0.93 0.93 0.81 1.01 0.79 0.75
Quick Ratio 1.22 1.29 1.14 0.69 0.73 0.6 0.81 0.61 0.58
Financial Leverage Ratio
Debt-equity
Ratio
14.07 12.77 14.26 200.12 196.85 163.86 122.99 119.74 144.27
Assets based
solvency ratio
69.83 70.33 69.92 21.04 21.43 23.72 36.74 36.03 32.95
Efficiency Ratio
Trade
Receivable
collection
days
73 70 77 71 75 80 56 52 50
Trade Payable
payment days
24 26 20 61 64 68 34 35 34
Inventory
holding days
30 24 20 10 15 20 20 25 30
Market Test Ratio
Earnings Per
share
19 17 14 33 34 35 10 15 12
Non-financial Ratio (Per employee ratio)
Operating
revenue per
employee
273 292 271 295 314 322 418 442 442
Shareholders
fund per
employees
208 219 219 70 79 86 252 252 226
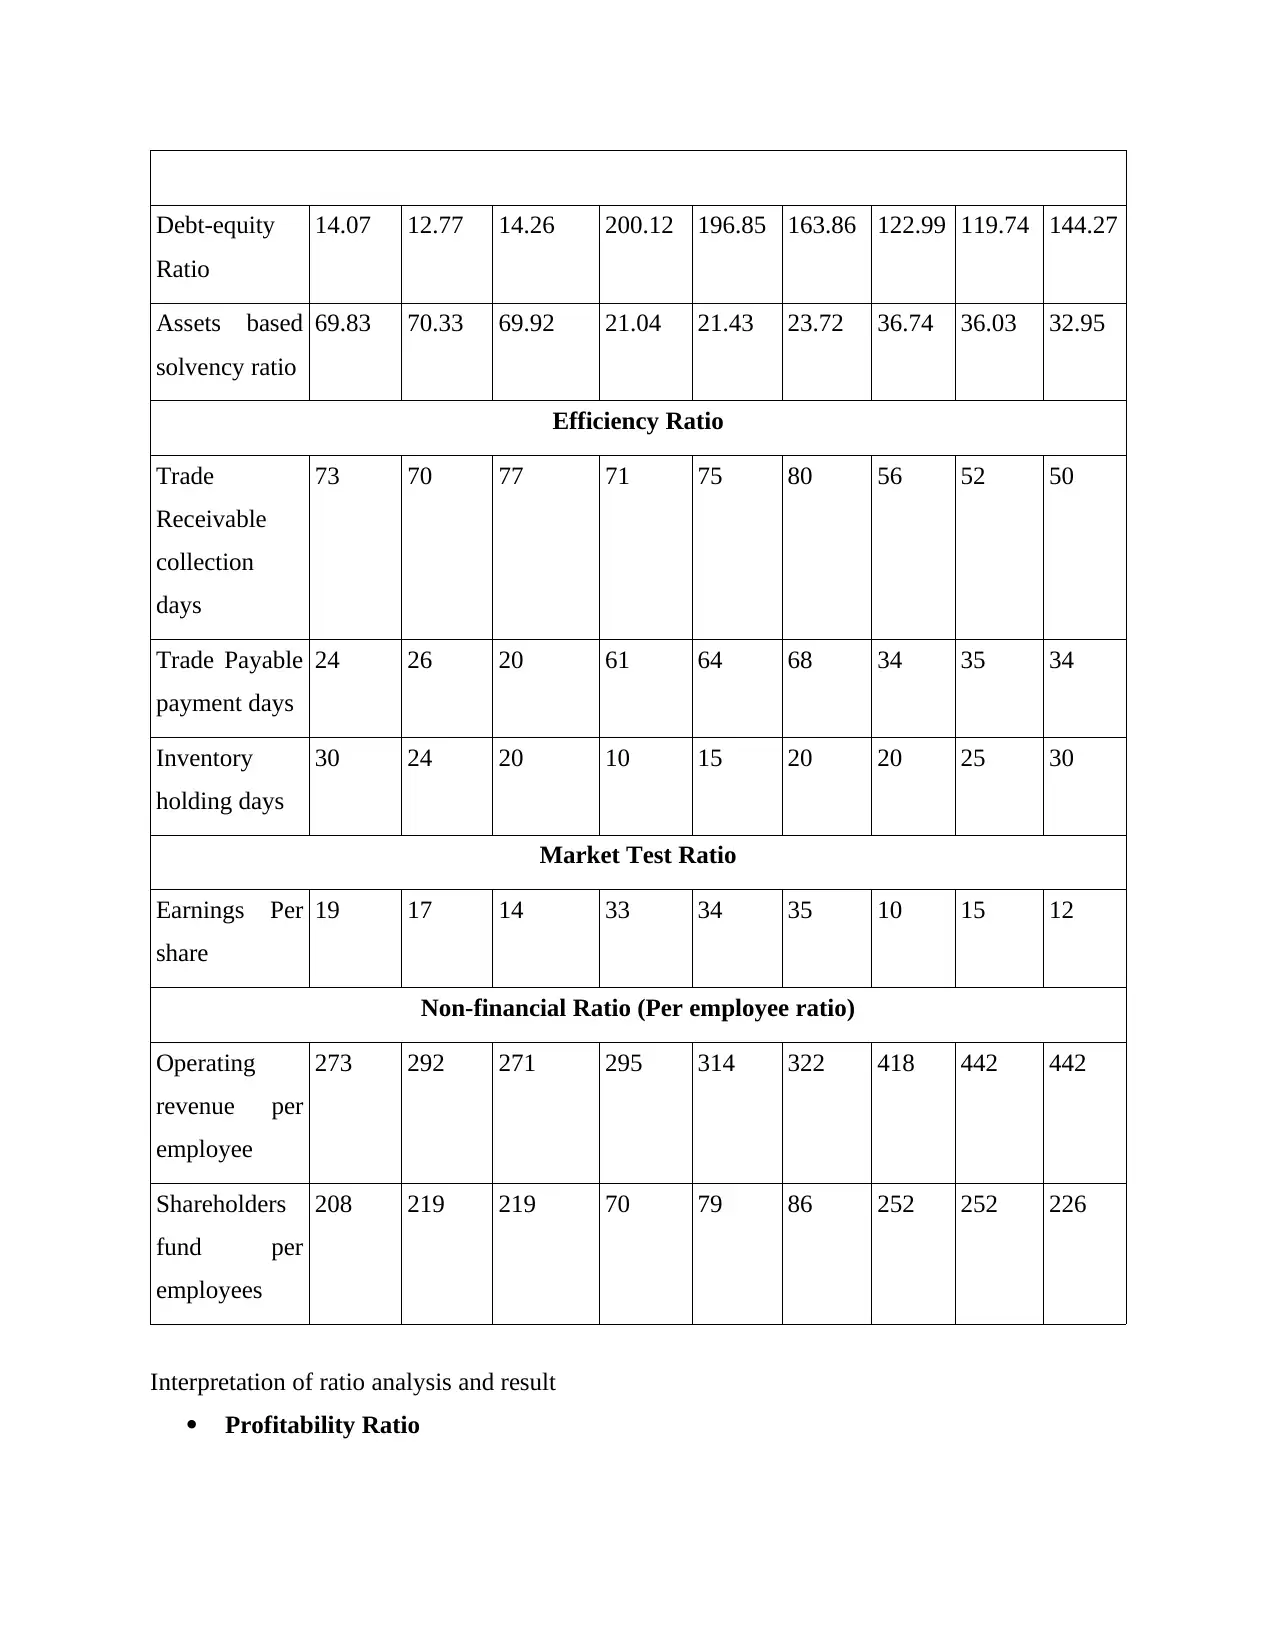
Interpretation of ratio analysis and result
Profitability Ratio
Ratio
14.07 12.77 14.26 200.12 196.85 163.86 122.99 119.74 144.27
Assets based
solvency ratio
69.83 70.33 69.92 21.04 21.43 23.72 36.74 36.03 32.95
Efficiency Ratio
Trade
Receivable
collection
days
73 70 77 71 75 80 56 52 50
Trade Payable
payment days
24 26 20 61 64 68 34 35 34
Inventory
holding days
30 24 20 10 15 20 20 25 30
Market Test Ratio
Earnings Per
share
19 17 14 33 34 35 10 15 12
Non-financial Ratio (Per employee ratio)
Operating
revenue per
employee
273 292 271 295 314 322 418 442 442
Shareholders
fund per
employees
208 219 219 70 79 86 252 252 226
Interpretation of ratio analysis and result
Profitability Ratio
⊘ This is a preview!⊘
Do you want full access?
Subscribe today to unlock all pages.
Trusted by 1+ million students worldwide
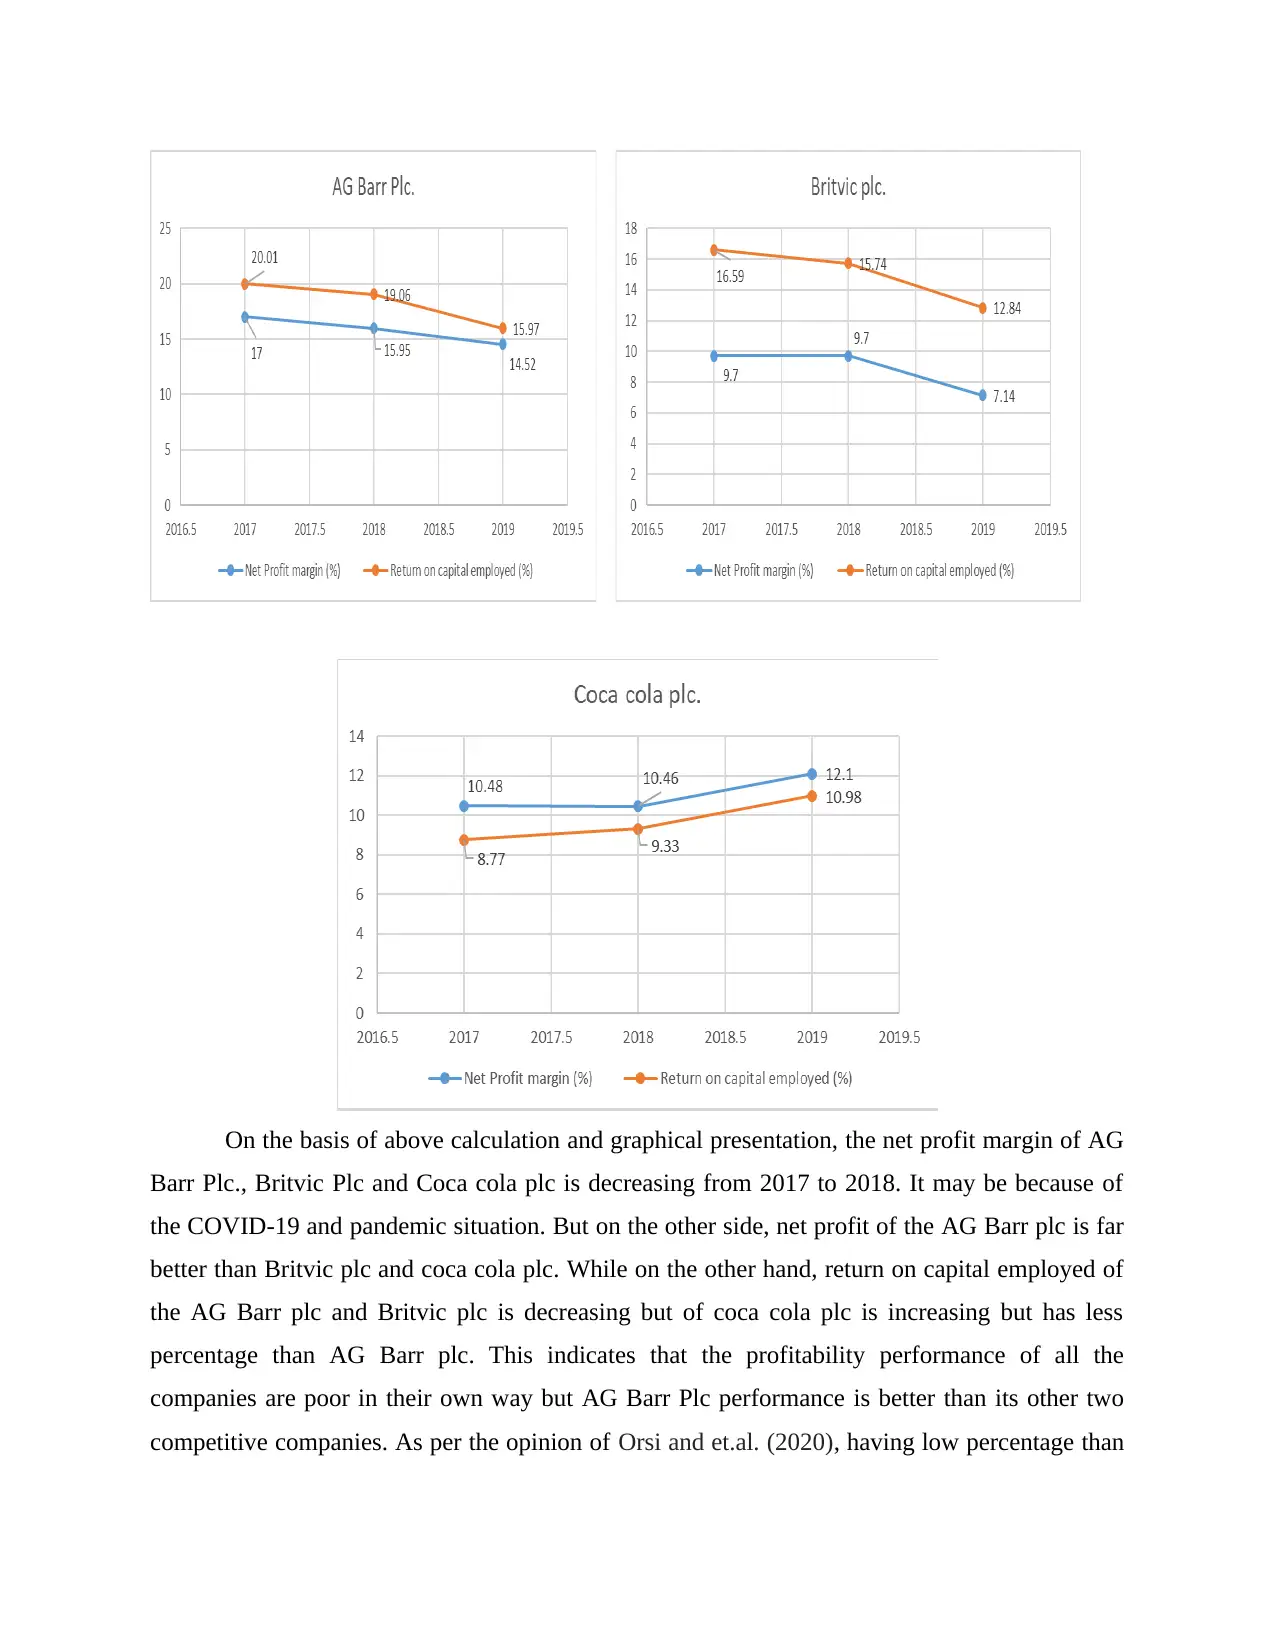
On the basis of above calculation and graphical presentation, the net profit margin of AG
Barr Plc., Britvic Plc and Coca cola plc is decreasing from 2017 to 2018. It may be because of
the COVID-19 and pandemic situation. But on the other side, net profit of the AG Barr plc is far
better than Britvic plc and coca cola plc. While on the other hand, return on capital employed of
the AG Barr plc and Britvic plc is decreasing but of coca cola plc is increasing but has less
percentage than AG Barr plc. This indicates that the profitability performance of all the
companies are poor in their own way but AG Barr Plc performance is better than its other two
competitive companies. As per the opinion of Orsi and et.al. (2020), having low percentage than
Paraphrase This Document
Need a fresh take? Get an instant paraphrase of this document with our AI Paraphraser
previous year indicate poor performance while high percentage indicate better profitability
performance.
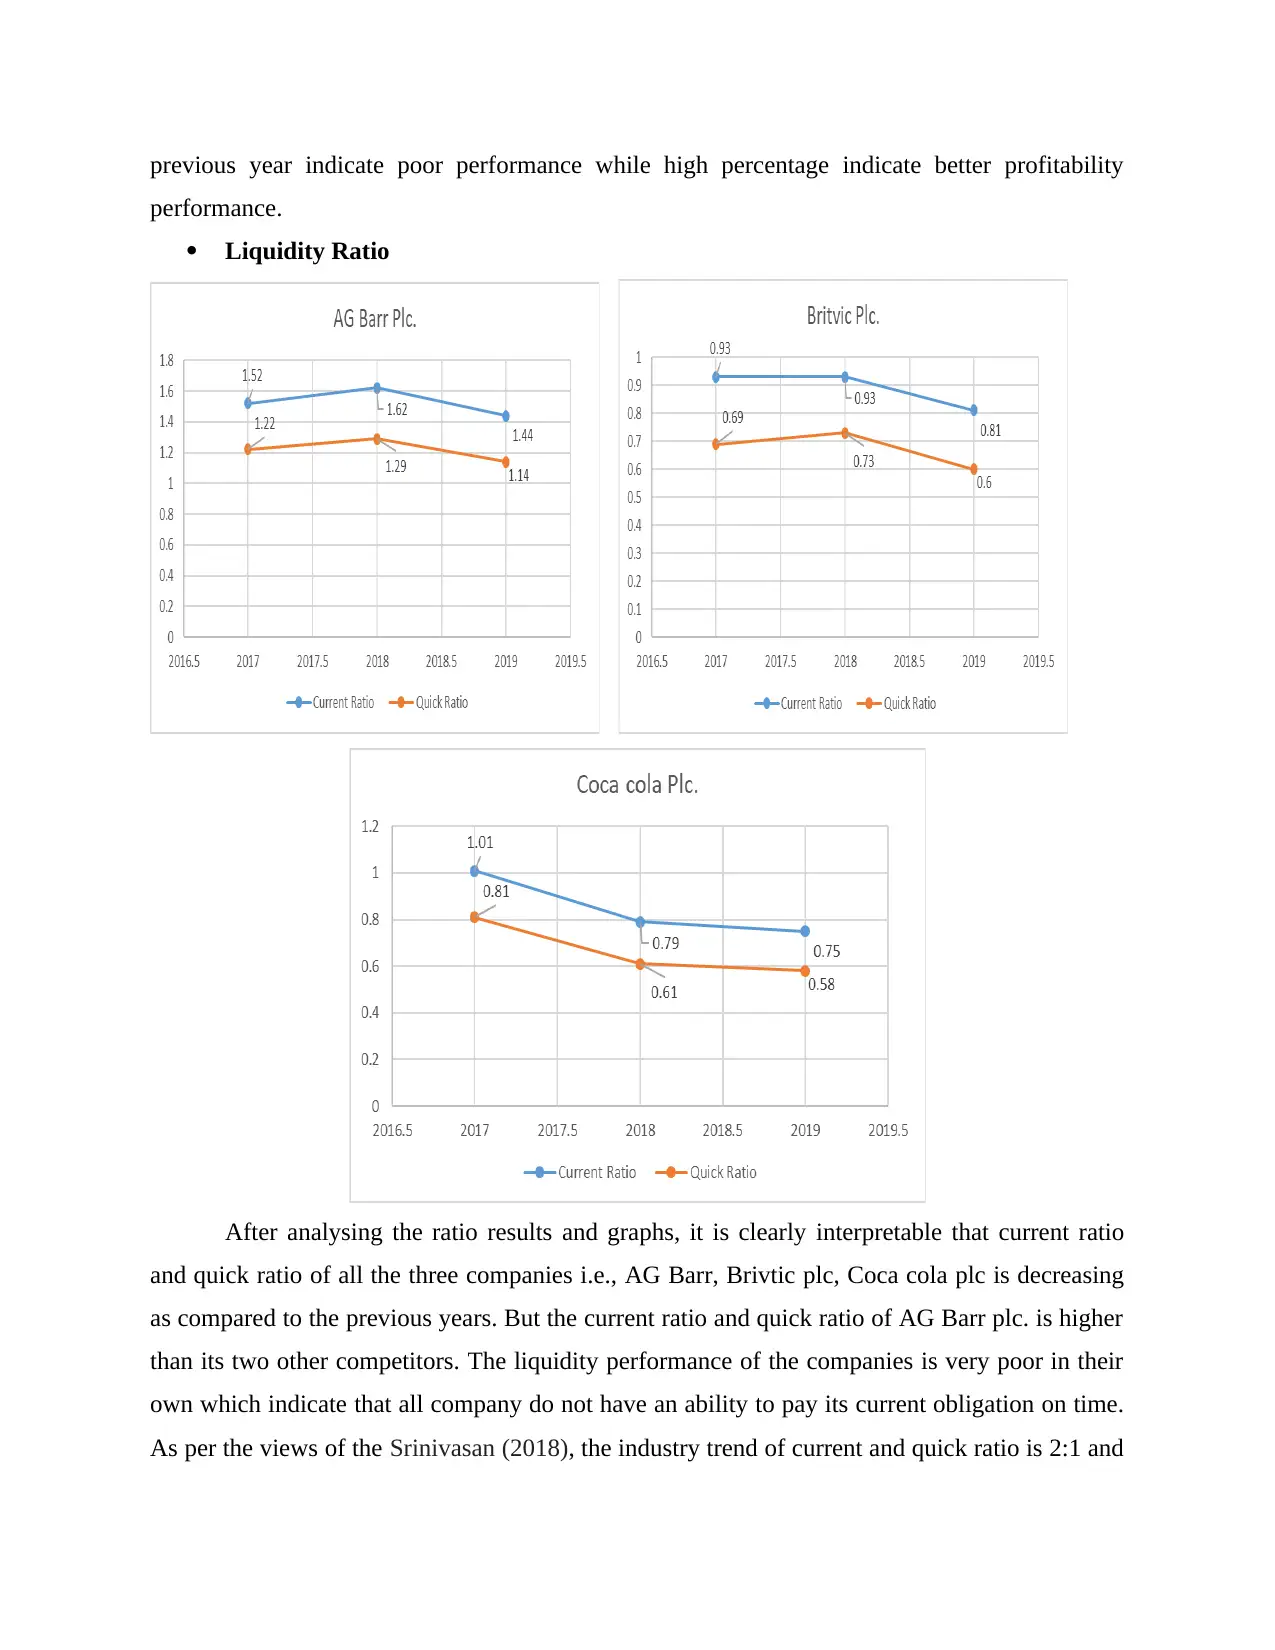
Liquidity Ratio
After analysing the ratio results and graphs, it is clearly interpretable that current ratio
and quick ratio of all the three companies i.e., AG Barr, Brivtic plc, Coca cola plc is decreasing
as compared to the previous years. But the current ratio and quick ratio of AG Barr plc. is higher
than its two other competitors. The liquidity performance of the companies is very poor in their
own which indicate that all company do not have an ability to pay its current obligation on time.
As per the views of the Srinivasan (2018), the industry trend of current and quick ratio is 2:1 and
performance.
Liquidity Ratio
After analysing the ratio results and graphs, it is clearly interpretable that current ratio
and quick ratio of all the three companies i.e., AG Barr, Brivtic plc, Coca cola plc is decreasing
as compared to the previous years. But the current ratio and quick ratio of AG Barr plc. is higher
than its two other competitors. The liquidity performance of the companies is very poor in their
own which indicate that all company do not have an ability to pay its current obligation on time.
As per the views of the Srinivasan (2018), the industry trend of current and quick ratio is 2:1 and
1:1 respectively and all the companies are unable to touch the standard which indicating poor
liquidity performance of the companies.
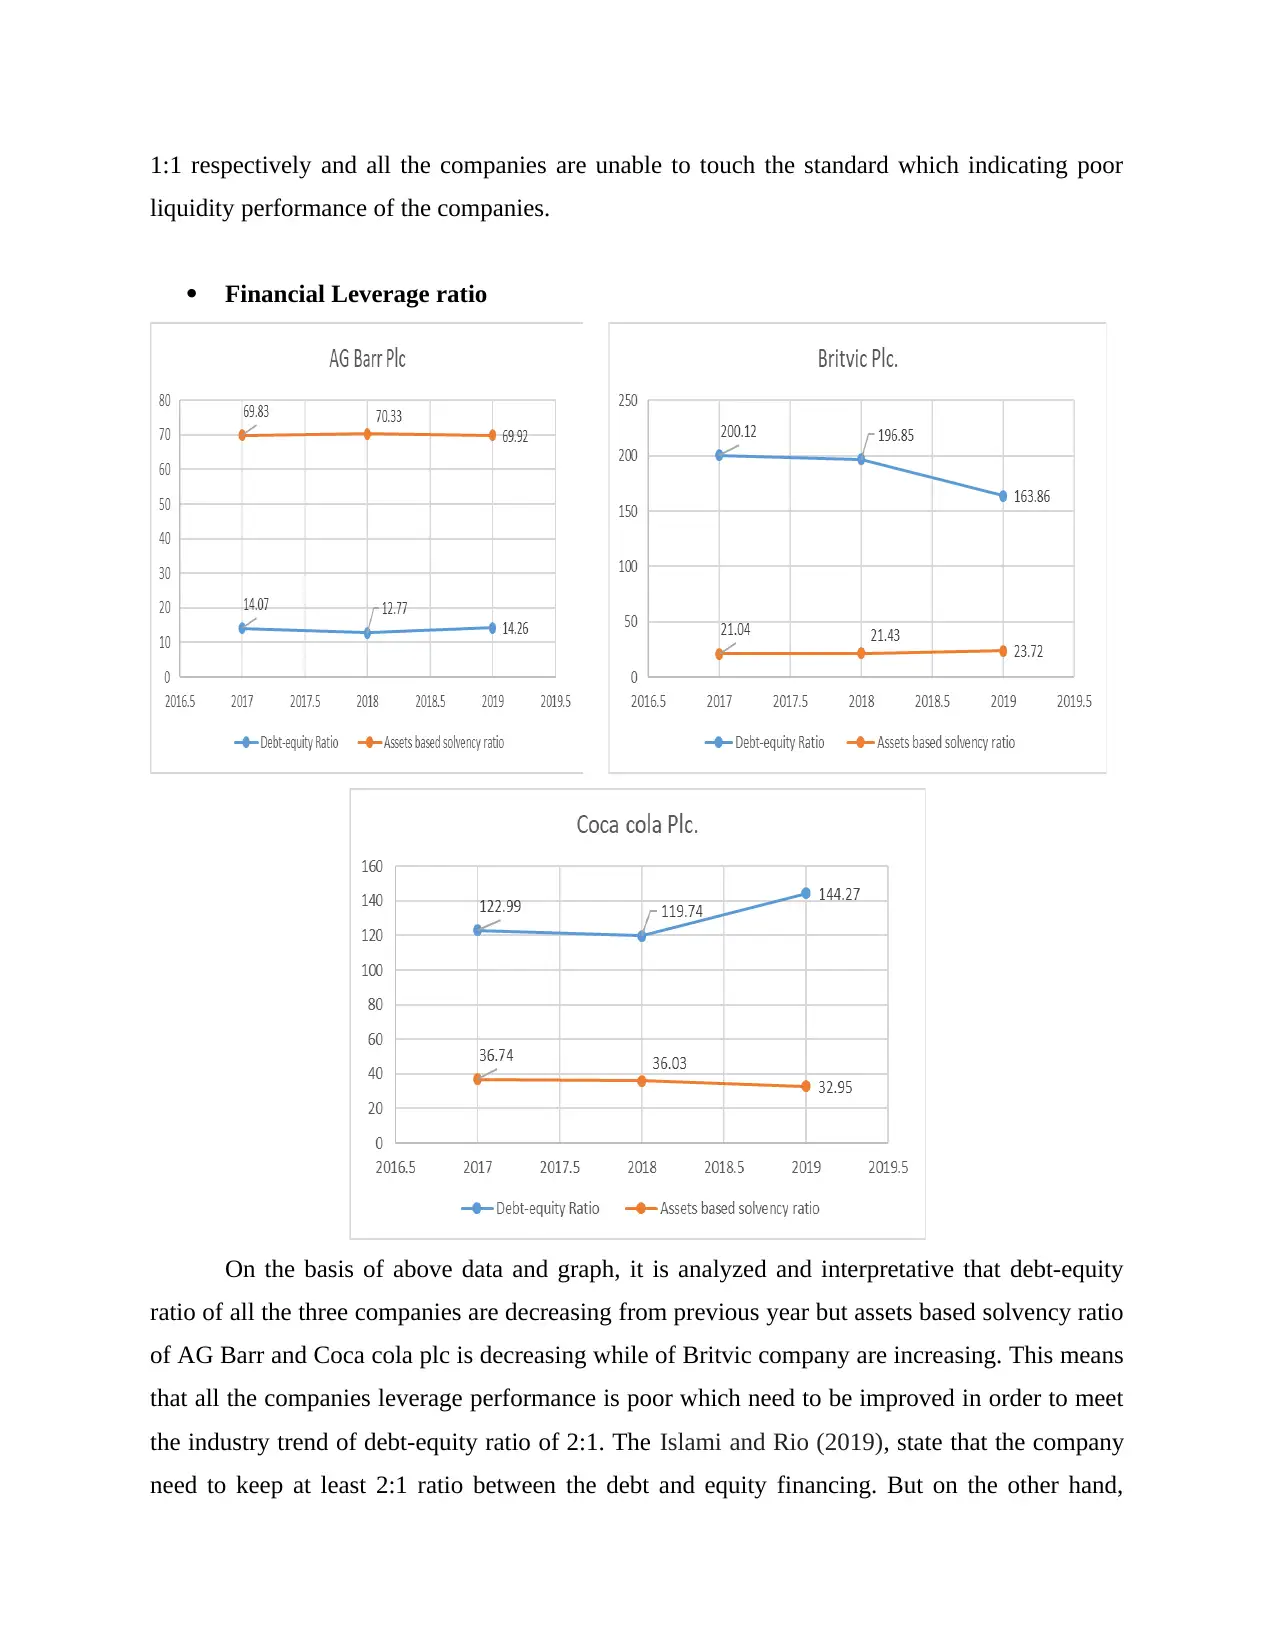
Financial Leverage ratio
On the basis of above data and graph, it is analyzed and interpretative that debt-equity
ratio of all the three companies are decreasing from previous year but assets based solvency ratio
of AG Barr and Coca cola plc is decreasing while of Britvic company are increasing. This means
that all the companies leverage performance is poor which need to be improved in order to meet
the industry trend of debt-equity ratio of 2:1. The Islami and Rio (2019), state that the company
need to keep at least 2:1 ratio between the debt and equity financing. But on the other hand,
liquidity performance of the companies.
Financial Leverage ratio
On the basis of above data and graph, it is analyzed and interpretative that debt-equity
ratio of all the three companies are decreasing from previous year but assets based solvency ratio
of AG Barr and Coca cola plc is decreasing while of Britvic company are increasing. This means
that all the companies leverage performance is poor which need to be improved in order to meet
the industry trend of debt-equity ratio of 2:1. The Islami and Rio (2019), state that the company
need to keep at least 2:1 ratio between the debt and equity financing. But on the other hand,
⊘ This is a preview!⊘
Do you want full access?
Subscribe today to unlock all pages.
Trusted by 1+ million students worldwide
Nagaraja and et.al. (2020), state that company need to issue more shares than debt as debt
financing increases the fixed interest cost of the company.
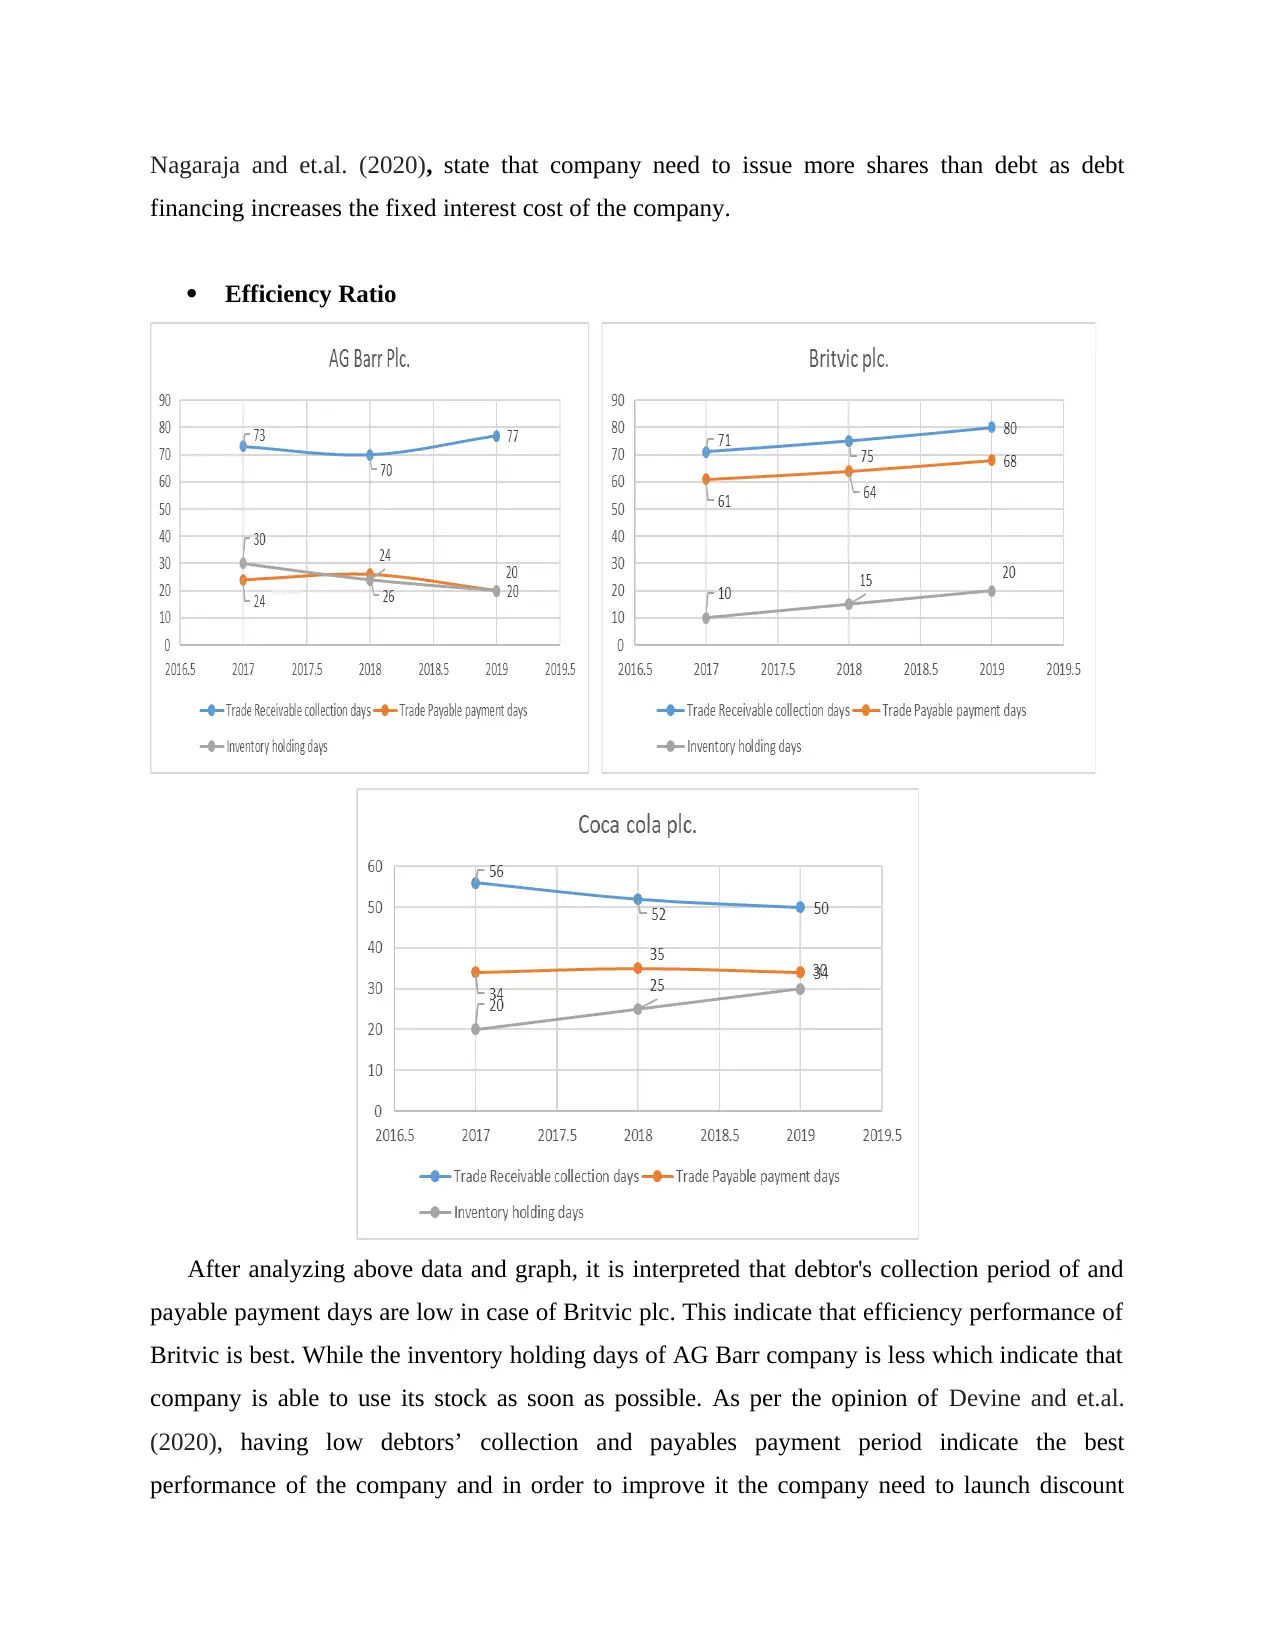
Efficiency Ratio
After analyzing above data and graph, it is interpreted that debtor's collection period of and
payable payment days are low in case of Britvic plc. This indicate that efficiency performance of
Britvic is best. While the inventory holding days of AG Barr company is less which indicate that
company is able to use its stock as soon as possible. As per the opinion of Devine and et.al.
(2020), having low debtors’ collection and payables payment period indicate the best
performance of the company and in order to improve it the company need to launch discount
financing increases the fixed interest cost of the company.
Efficiency Ratio
After analyzing above data and graph, it is interpreted that debtor's collection period of and
payable payment days are low in case of Britvic plc. This indicate that efficiency performance of
Britvic is best. While the inventory holding days of AG Barr company is less which indicate that
company is able to use its stock as soon as possible. As per the opinion of Devine and et.al.
(2020), having low debtors’ collection and payables payment period indicate the best
performance of the company and in order to improve it the company need to launch discount
Paraphrase This Document
Need a fresh take? Get an instant paraphrase of this document with our AI Paraphraser
schemes. This also improve the credit worthiness of the company and help them to increase
customer trust and loyalty.
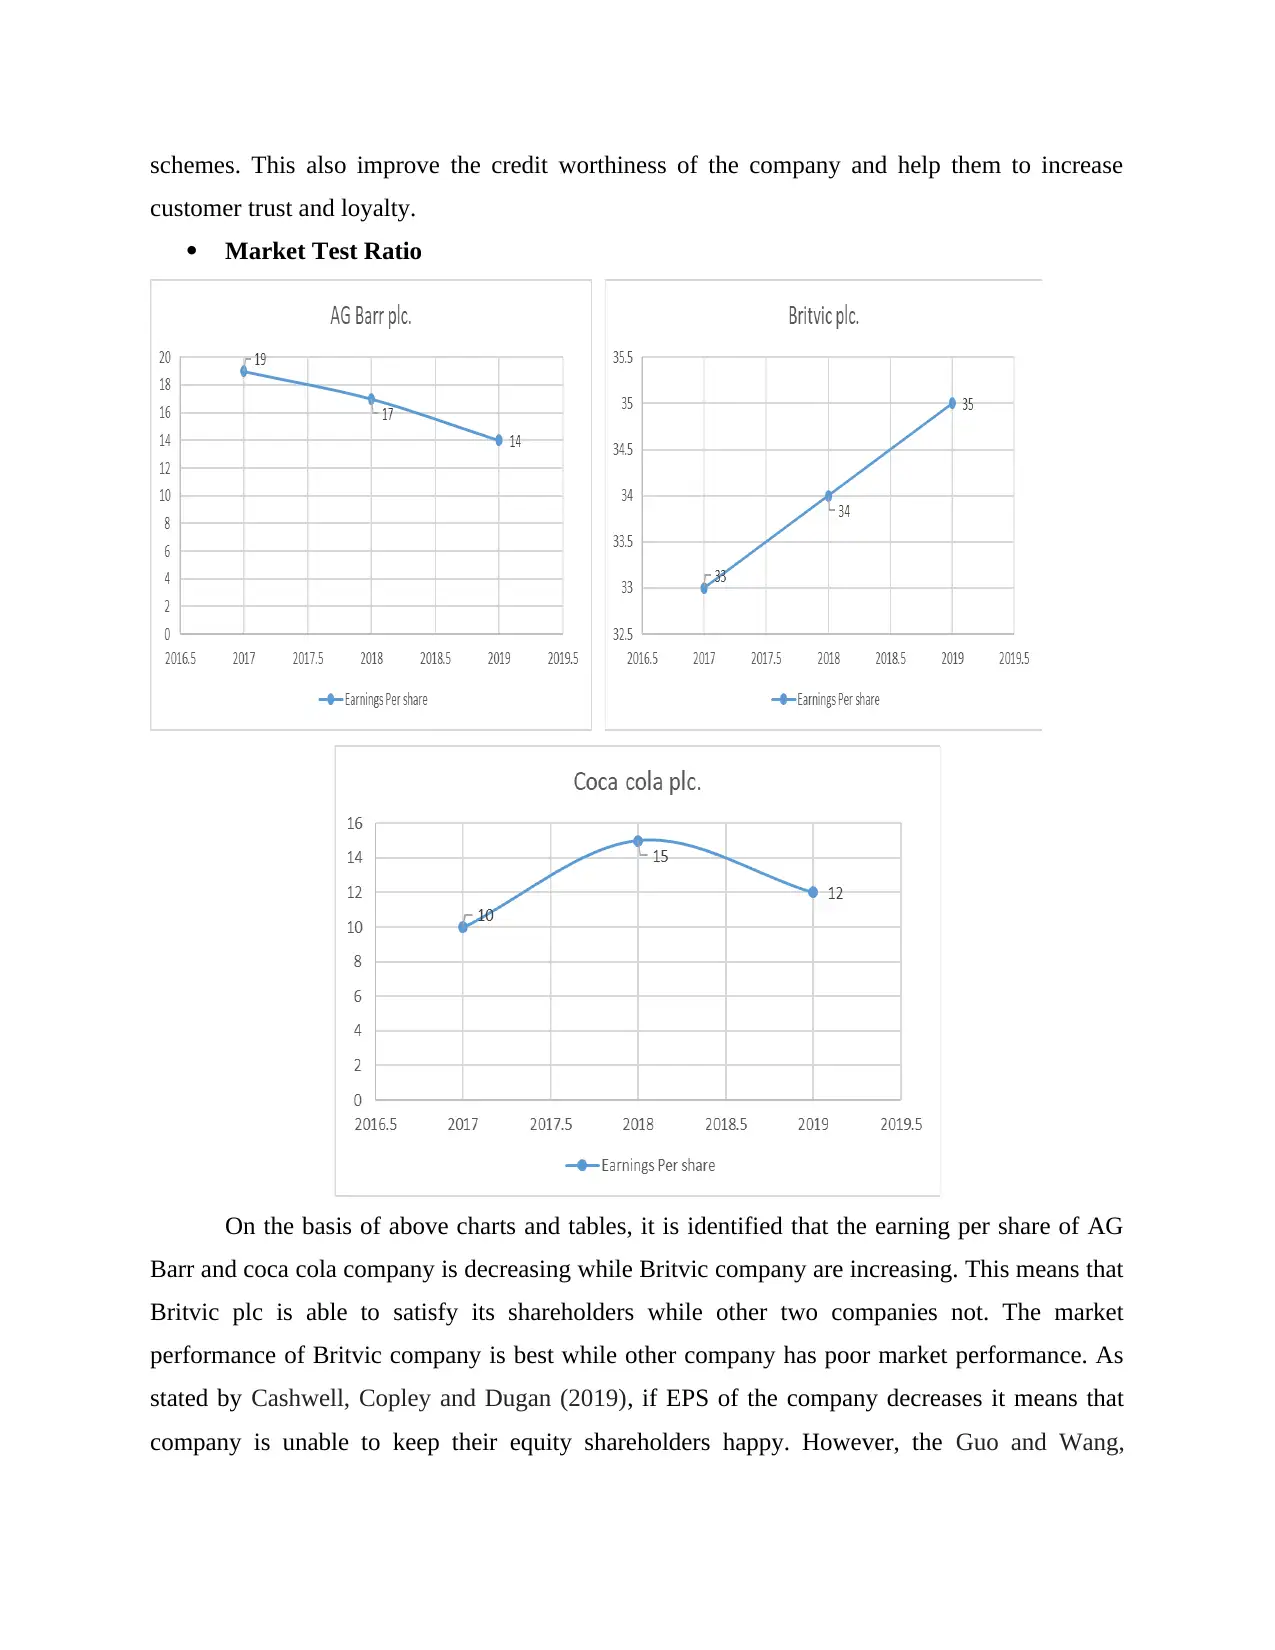
Market Test Ratio
On the basis of above charts and tables, it is identified that the earning per share of AG
Barr and coca cola company is decreasing while Britvic company are increasing. This means that
Britvic plc is able to satisfy its shareholders while other two companies not. The market
performance of Britvic company is best while other company has poor market performance. As
stated by Cashwell, Copley and Dugan (2019), if EPS of the company decreases it means that
company is unable to keep their equity shareholders happy. However, the Guo and Wang,
customer trust and loyalty.
Market Test Ratio
On the basis of above charts and tables, it is identified that the earning per share of AG
Barr and coca cola company is decreasing while Britvic company are increasing. This means that
Britvic plc is able to satisfy its shareholders while other two companies not. The market
performance of Britvic company is best while other company has poor market performance. As
stated by Cashwell, Copley and Dugan (2019), if EPS of the company decreases it means that
company is unable to keep their equity shareholders happy. However, the Guo and Wang,
(2019), state that sometime low EPS could mean that company is retaining the money for their
future development with the consent of their equity shareholders.
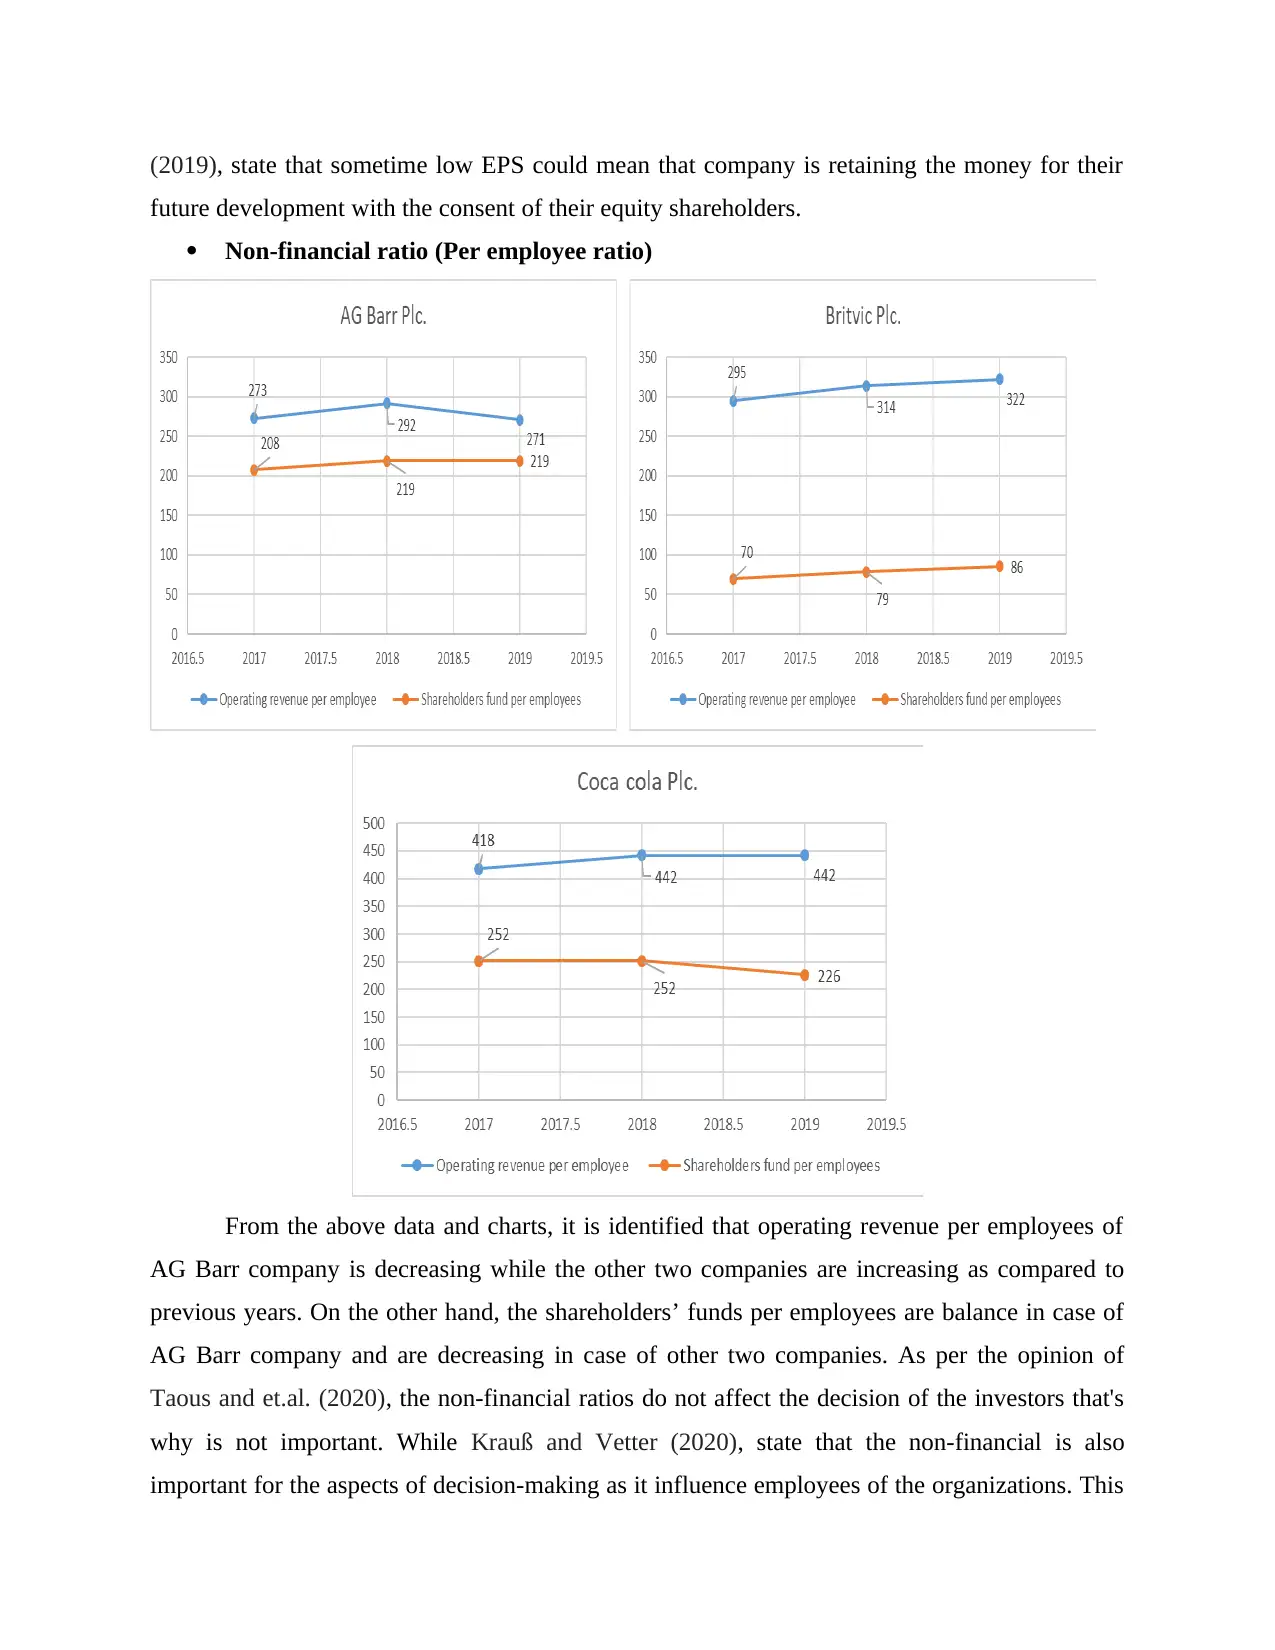
Non-financial ratio (Per employee ratio)
From the above data and charts, it is identified that operating revenue per employees of
AG Barr company is decreasing while the other two companies are increasing as compared to
previous years. On the other hand, the shareholders’ funds per employees are balance in case of
AG Barr company and are decreasing in case of other two companies. As per the opinion of
Taous and et.al. (2020), the non-financial ratios do not affect the decision of the investors that's
why is not important. While Krauß and Vetter (2020), state that the non-financial is also
important for the aspects of decision-making as it influence employees of the organizations. This
future development with the consent of their equity shareholders.
Non-financial ratio (Per employee ratio)
From the above data and charts, it is identified that operating revenue per employees of
AG Barr company is decreasing while the other two companies are increasing as compared to
previous years. On the other hand, the shareholders’ funds per employees are balance in case of
AG Barr company and are decreasing in case of other two companies. As per the opinion of
Taous and et.al. (2020), the non-financial ratios do not affect the decision of the investors that's
why is not important. While Krauß and Vetter (2020), state that the non-financial is also
important for the aspects of decision-making as it influence employees of the organizations. This
⊘ This is a preview!⊘
Do you want full access?
Subscribe today to unlock all pages.
Trusted by 1+ million students worldwide
1 out of 19
Related Documents


Your All-in-One AI-Powered Toolkit for Academic Success.
+13062052269
info@desklib.com
Available 24*7 on WhatsApp / Email
![[object Object]](/_next/static/media/star-bottom.7253800d.svg)
Unlock your academic potential
Copyright © 2020–2026 A2Z Services. All Rights Reserved. Developed and managed by ZUCOL.