Detailed Financial Analysis and Performance of AGL Energy
VerifiedAdded on 2021/06/15
|19
|4052
|66
Report
AI Summary
This report provides a comprehensive financial analysis of AGL Energy Limited, evaluating its performance through the examination of financial statements, including the cash flow statement and balance sheet, over several years. The report compares AGL Energy's profitability with its competitor, Origin Energy, and utilizes ratio analysis to assess its financial condition, including return on assets, inventory turnover, quick ratio, and price-earnings ratio. Furthermore, it explores the management's role in acting in the best interest of the company, referencing the director's report and ethical standards. The analysis covers key financial metrics, including revenue, net profit, gross profit, and various financial ratios, offering a detailed perspective on AGL Energy's financial health, efficiency, and market position within the energy sector, with comparisons to its major competitor, Origin Energy.

Accounting for Business
1
1
Paraphrase This Document
Need a fresh take? Get an instant paraphrase of this document with our AI Paraphraser
Executive Summary
This report demonstrates the important of gaining an analysis of the different items of the
financial statements of a business entity for evaluation of its financial performance. In this
context, the financial performance of AGL Energy Limited is evaluated with the use of its
financial statements such as cash flows and balance sheet over the last few years. The report has
also adopted the use of ratio analysis technique fro depiction of its financial condition to the
investors. The information from the director’s report related to the management efficiency is also
provided for guiding the decision-making process of investors.
2
Contents
Introduction.................................................................................................................................................4
Section 1: Financial Standing of AGL Energy during the past financial years...............................................4
Part 1.1: Profitability position of AGL Energy during the last two years and its comparison with
competitor Origin Energy........................................................................................................................4
Part 1.2: Analyses of cash flow statement of AGL Energy........................................................................7
Part 1.3: Evaluation of financial position of AGL Energy through analyzing the balance sheet...............8
Section 2: Calculation of financial ratios of AGL Energy for last three years..............................................10
Return on Assets:...................................................................................................................................11
Inventory Turnover Ratio:.....................................................................................................................11
Quick Ratio:...........................................................................................................................................12
Price Earnings Ratio:..............................................................................................................................13
Section 3: Explanation of the Management working in the best Interest of AGL Energy Limited for
guiding the decision-making of Investors..................................................................................................13
Analysis of Corporate Governance Statements & Practice of Integrity Policy.......................................13
Management Approach Towards..........................................................................................................14
Risk Management..............................................................................................................................14
Financial Reporting............................................................................................................................15
Information Processing & Accounting functions................................................................................15
Business Operations..............................................................................................................................16
Investments & Investment Activities.....................................................................................................16
Financing & Financing Activities............................................................................................................16
Industry Size..........................................................................................................................................17
Major Players/Competitors...................................................................................................................17
Market Shares of Industry Players.........................................................................................................17
Conclusion.................................................................................................................................................18
References.................................................................................................................................................19
3
⊘ This is a preview!⊘
Do you want full access?
Subscribe today to unlock all pages.
Trusted by 1+ million students worldwide
Introduction
This report depicts an overview of the organizational performance of a selected company
within Australia listed on ASX. The organizational performance is evaluated by examining the
financial standing of the selected company through carrying out the analysis of its profitability
by comparing its current year financial figure with the previous one and also from its competitors
operating within the same industry. Also, the analysis of the cash flow statement is undertaken
for identifying the financial, operating and investing activities of the selected company. Also, the
financial condition of the selected company is evaluated on the basis of the financial figures
presented in its balance sheet. In addition to this, the report has examined the financial
performance of the company with the use of ratio analysis technique by adopting the use of
mainly return on assets, inventory turnover, quick ratio and price-earnings ratio over the last
three financial years. Lastly, on the basis of director’s report, the report has also carried out an
evaluation of the role of management of the selected company acting in its best interest by
adopting the ethical standards for protecting the investor confidence.
Section 1: Financial Standing of AGL Energy during the past financial
years
Part 1.1: Profitability position of AGL Energy during the last two years and its
comparison with competitor Origin Energy
The financial standing of AGL Energy Ltd for the past two years and its comparison with
its competitor Origin Energy is carried out as follows:
Comparison of current financial data with previous financial data
Profit and loss Statement
AGL Energy
Comparison of financial items of current year with financial items of previous year
The amount are shown as $ million
Financial Items 2016 2017 Increase/Decrease
Continuing operations
In
amount in %
4
Paraphrase This Document
Need a fresh take? Get an instant paraphrase of this document with our AI Paraphraser
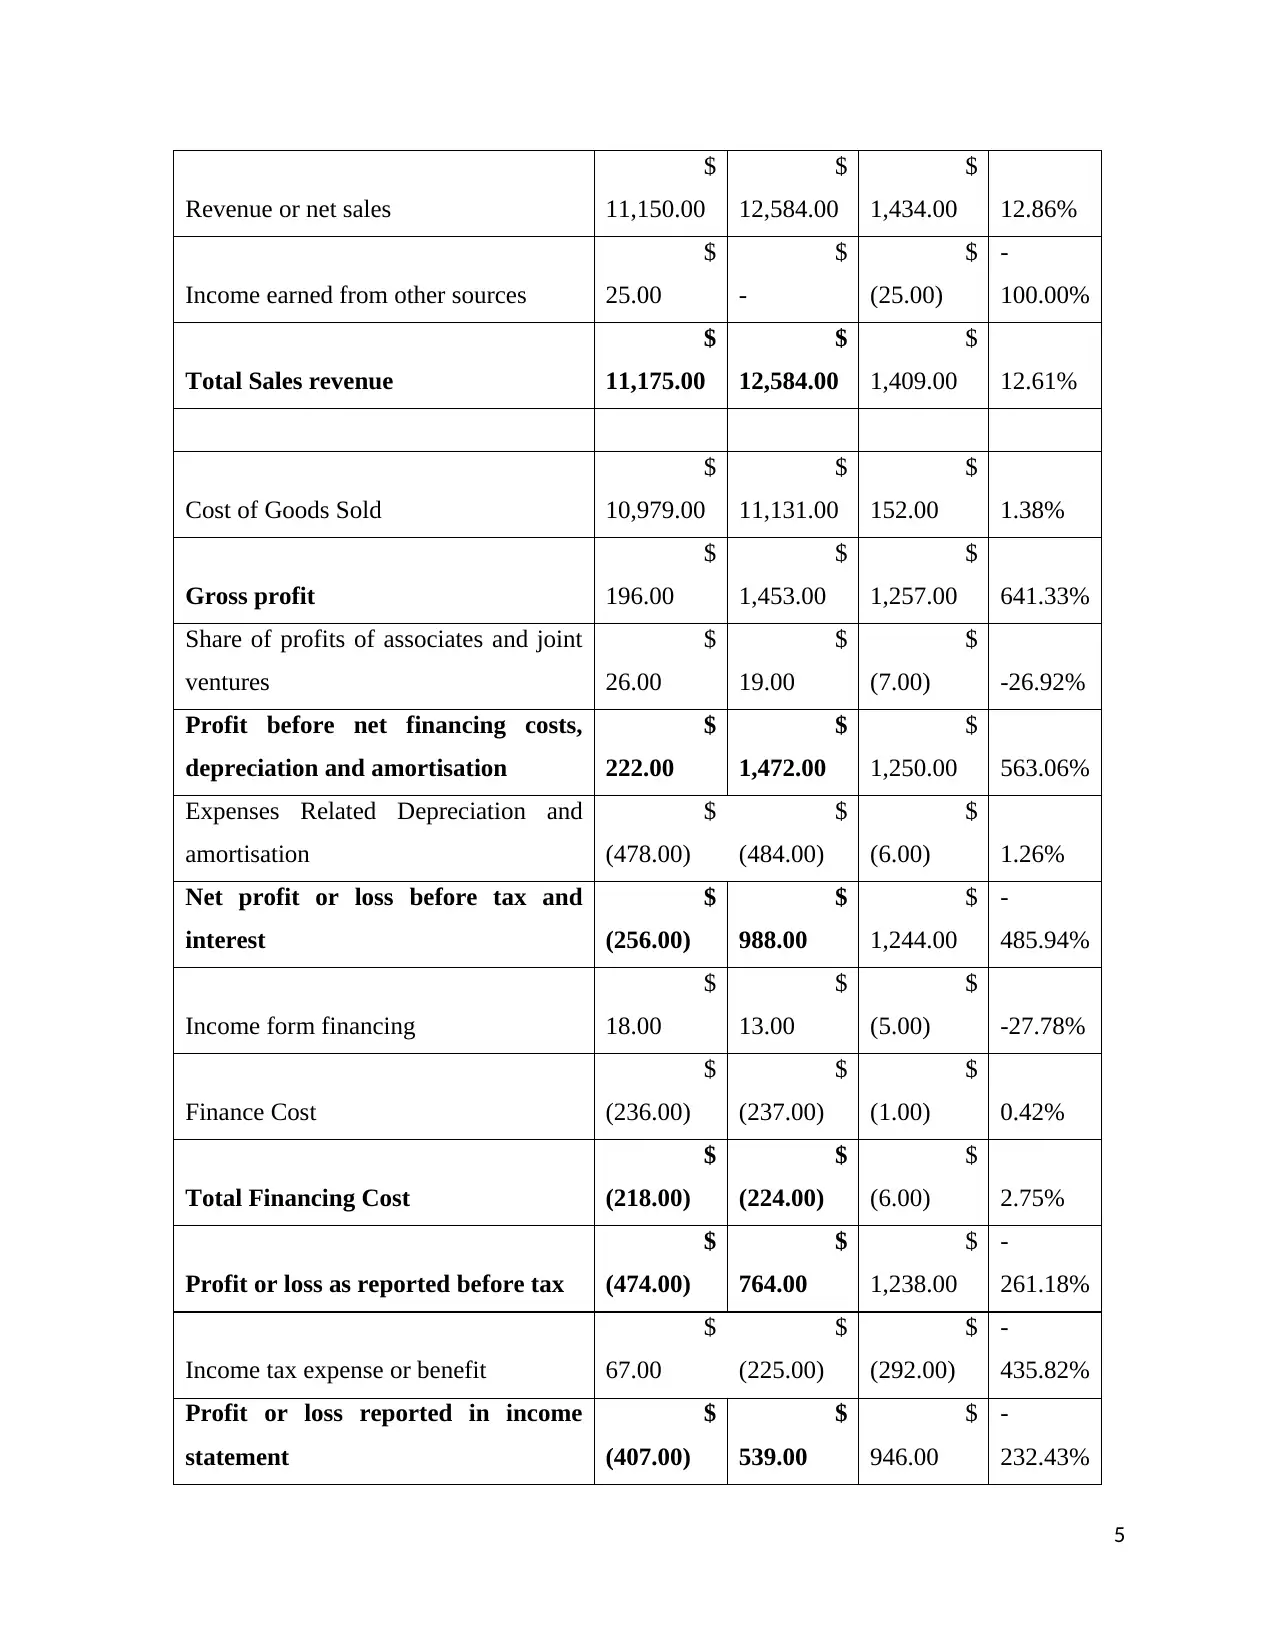
Revenue or net sales
$
11,150.00
$
12,584.00
$
1,434.00 12.86%
Income earned from other sources
$
25.00
$
-
$
(25.00)
-
100.00%
Total Sales revenue
$
11,175.00
$
12,584.00
$
1,409.00 12.61%
Cost of Goods Sold
$
10,979.00
$
11,131.00
$
152.00 1.38%
Gross profit
$
196.00
$
1,453.00
$
1,257.00 641.33%
Share of profits of associates and joint
ventures
$
26.00
$
19.00
$
(7.00) -26.92%
Profit before net financing costs,
depreciation and amortisation
$
222.00
$
1,472.00
$
1,250.00 563.06%
Expenses Related Depreciation and
amortisation
$
(478.00)
$
(484.00)
$
(6.00) 1.26%
Net profit or loss before tax and
interest
$
(256.00)
$
988.00
$
1,244.00
-
485.94%
Income form financing
$
18.00
$
13.00
$
(5.00) -27.78%
Finance Cost
$
(236.00)
$
(237.00)
$
(1.00) 0.42%
Total Financing Cost
$
(218.00)
$
(224.00)
$
(6.00) 2.75%
Profit or loss as reported before tax
$
(474.00)
$
764.00
$
1,238.00
-
261.18%
Income tax expense or benefit
$
67.00
$
(225.00)
$
(292.00)
-
435.82%
Profit or loss reported in income
statement
$
(407.00)
$
539.00
$
946.00
-
232.43%
5
$
-
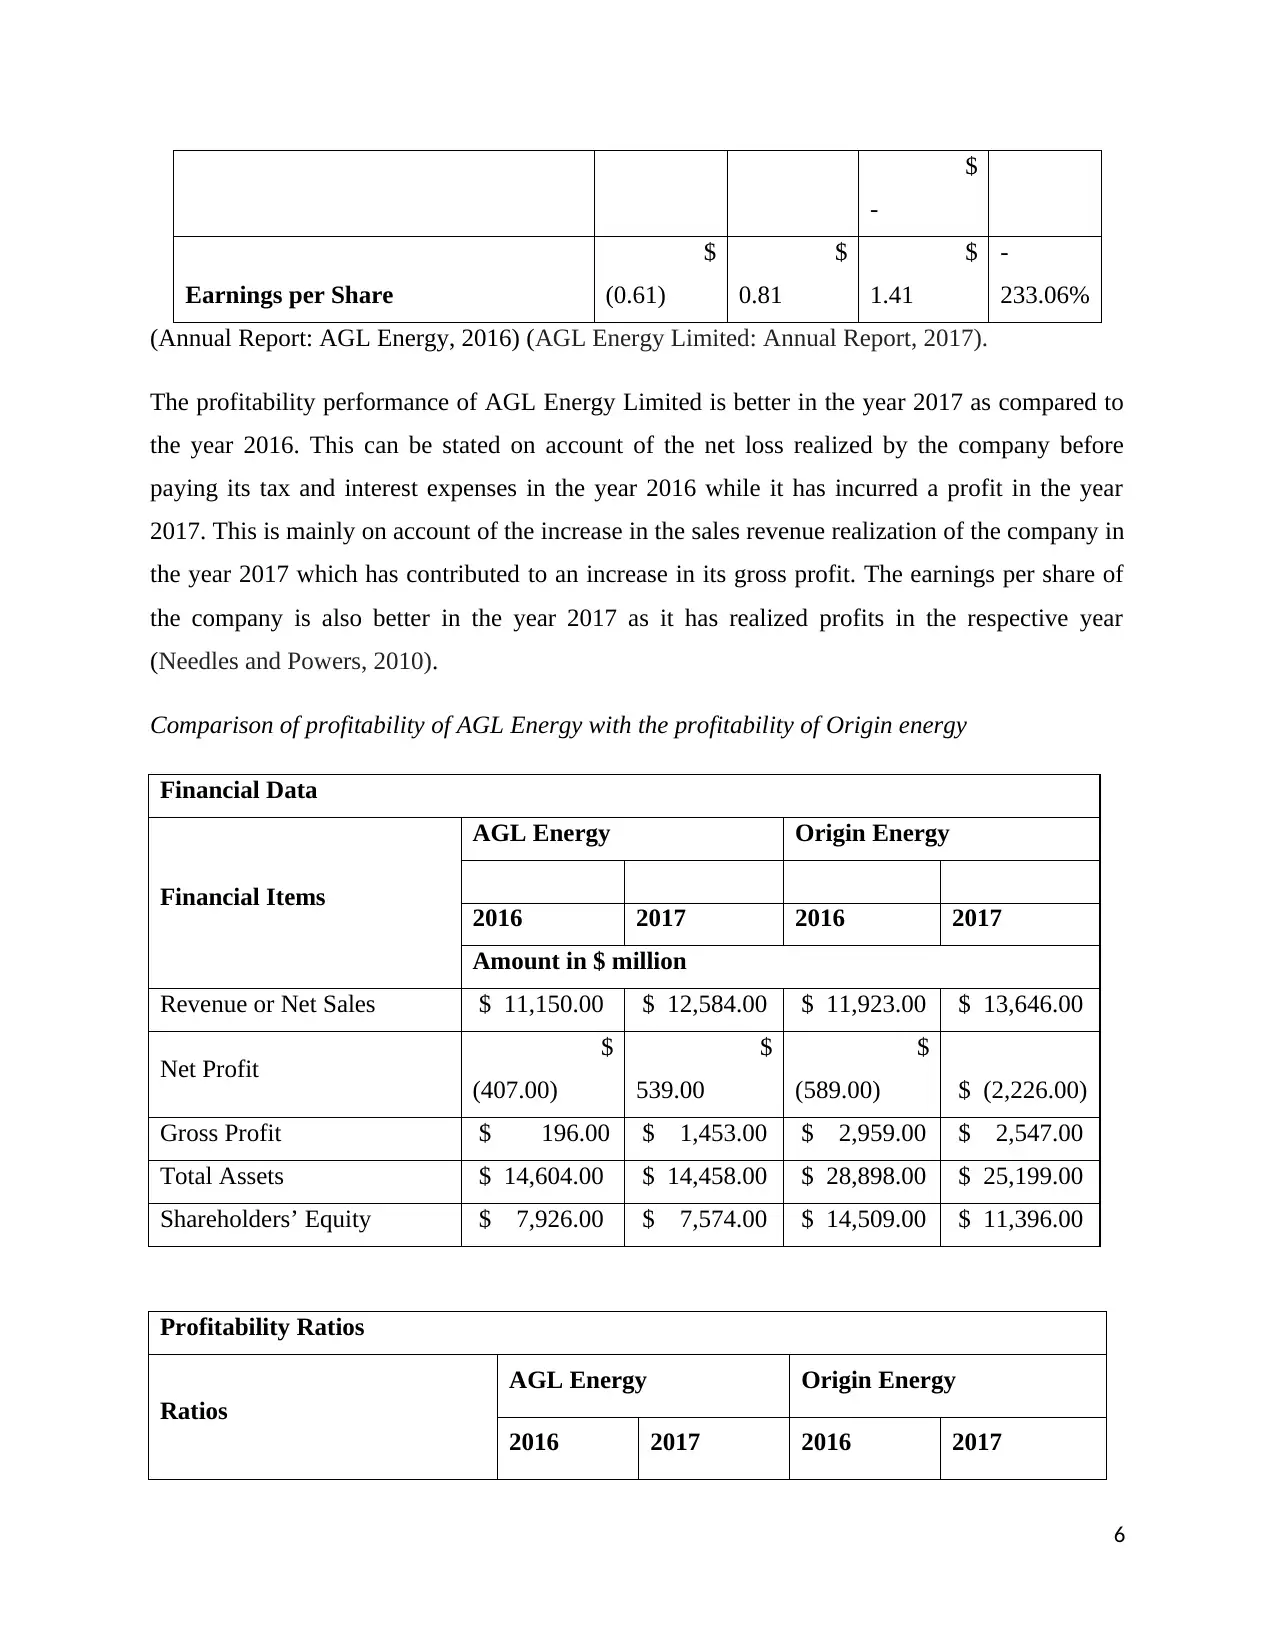
Earnings per Share
$
(0.61)
$
0.81
$
1.41
-
233.06%
(Annual Report: AGL Energy, 2016) (AGL Energy Limited: Annual Report, 2017).
The profitability performance of AGL Energy Limited is better in the year 2017 as compared to
the year 2016. This can be stated on account of the net loss realized by the company before
paying its tax and interest expenses in the year 2016 while it has incurred a profit in the year
2017. This is mainly on account of the increase in the sales revenue realization of the company in
the year 2017 which has contributed to an increase in its gross profit. The earnings per share of
the company is also better in the year 2017 as it has realized profits in the respective year
(Needles and Powers, 2010).
Comparison of profitability of AGL Energy with the profitability of Origin energy
Financial Data
Financial Items
AGL Energy Origin Energy
2016 2017 2016 2017
Amount in $ million
Revenue or Net Sales $ 11,150.00 $ 12,584.00 $ 11,923.00 $ 13,646.00
Net Profit $
(407.00)
$
539.00
$
(589.00) $ (2,226.00)
Gross Profit $ 196.00 $ 1,453.00 $ 2,959.00 $ 2,547.00
Total Assets $ 14,604.00 $ 14,458.00 $ 28,898.00 $ 25,199.00
Shareholders’ Equity $ 7,926.00 $ 7,574.00 $ 14,509.00 $ 11,396.00
Profitability Ratios
Ratios
AGL Energy Origin Energy
2016 2017 2016 2017
6
-
Earnings per Share
$
(0.61)
$
0.81
$
1.41
-
233.06%
(Annual Report: AGL Energy, 2016) (AGL Energy Limited: Annual Report, 2017).
The profitability performance of AGL Energy Limited is better in the year 2017 as compared to
the year 2016. This can be stated on account of the net loss realized by the company before
paying its tax and interest expenses in the year 2016 while it has incurred a profit in the year
2017. This is mainly on account of the increase in the sales revenue realization of the company in
the year 2017 which has contributed to an increase in its gross profit. The earnings per share of
the company is also better in the year 2017 as it has realized profits in the respective year
(Needles and Powers, 2010).
Comparison of profitability of AGL Energy with the profitability of Origin energy
Financial Data
Financial Items
AGL Energy Origin Energy
2016 2017 2016 2017
Amount in $ million
Revenue or Net Sales $ 11,150.00 $ 12,584.00 $ 11,923.00 $ 13,646.00
Net Profit $
(407.00)
$
539.00
$
(589.00) $ (2,226.00)
Gross Profit $ 196.00 $ 1,453.00 $ 2,959.00 $ 2,547.00
Total Assets $ 14,604.00 $ 14,458.00 $ 28,898.00 $ 25,199.00
Shareholders’ Equity $ 7,926.00 $ 7,574.00 $ 14,509.00 $ 11,396.00
Profitability Ratios
Ratios
AGL Energy Origin Energy
2016 2017 2016 2017
6
⊘ This is a preview!⊘
Do you want full access?
Subscribe today to unlock all pages.
Trusted by 1+ million students worldwide
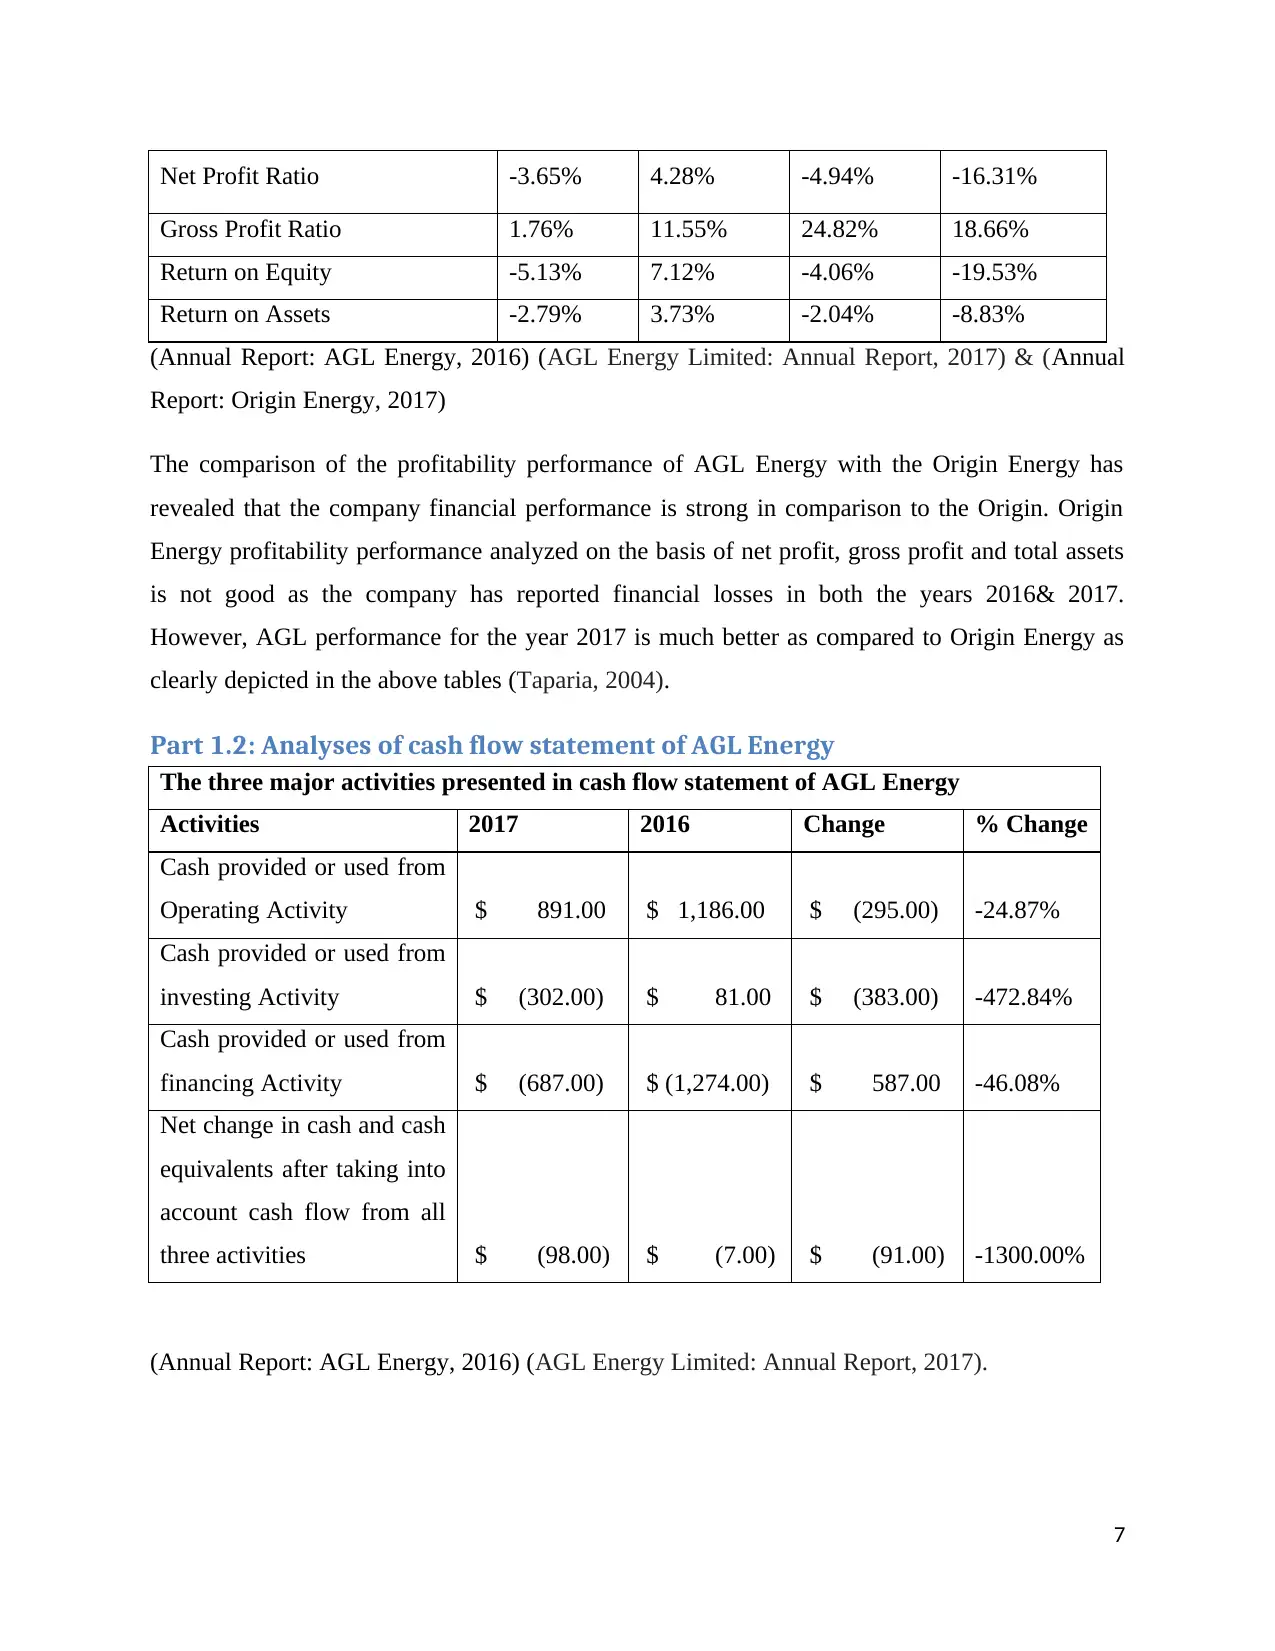
Net Profit Ratio -3.65% 4.28% -4.94% -16.31%
Gross Profit Ratio 1.76% 11.55% 24.82% 18.66%
Return on Equity -5.13% 7.12% -4.06% -19.53%
Return on Assets -2.79% 3.73% -2.04% -8.83%
(Annual Report: AGL Energy, 2016) (AGL Energy Limited: Annual Report, 2017) & (Annual
Report: Origin Energy, 2017)
The comparison of the profitability performance of AGL Energy with the Origin Energy has
revealed that the company financial performance is strong in comparison to the Origin. Origin
Energy profitability performance analyzed on the basis of net profit, gross profit and total assets
is not good as the company has reported financial losses in both the years 2016& 2017.
However, AGL performance for the year 2017 is much better as compared to Origin Energy as
clearly depicted in the above tables (Taparia, 2004).
Part 1.2: Analyses of cash flow statement of AGL Energy
The three major activities presented in cash flow statement of AGL Energy
Activities 2017 2016 Change % Change
Cash provided or used from
Operating Activity $ 891.00 $ 1,186.00 $ (295.00) -24.87%
Cash provided or used from
investing Activity $ (302.00) $ 81.00 $ (383.00) -472.84%
Cash provided or used from
financing Activity $ (687.00) $ (1,274.00) $ 587.00 -46.08%
Net change in cash and cash
equivalents after taking into
account cash flow from all
three activities $ (98.00) $ (7.00) $ (91.00) -1300.00%
(Annual Report: AGL Energy, 2016) (AGL Energy Limited: Annual Report, 2017).
7
Paraphrase This Document
Need a fresh take? Get an instant paraphrase of this document with our AI Paraphraser
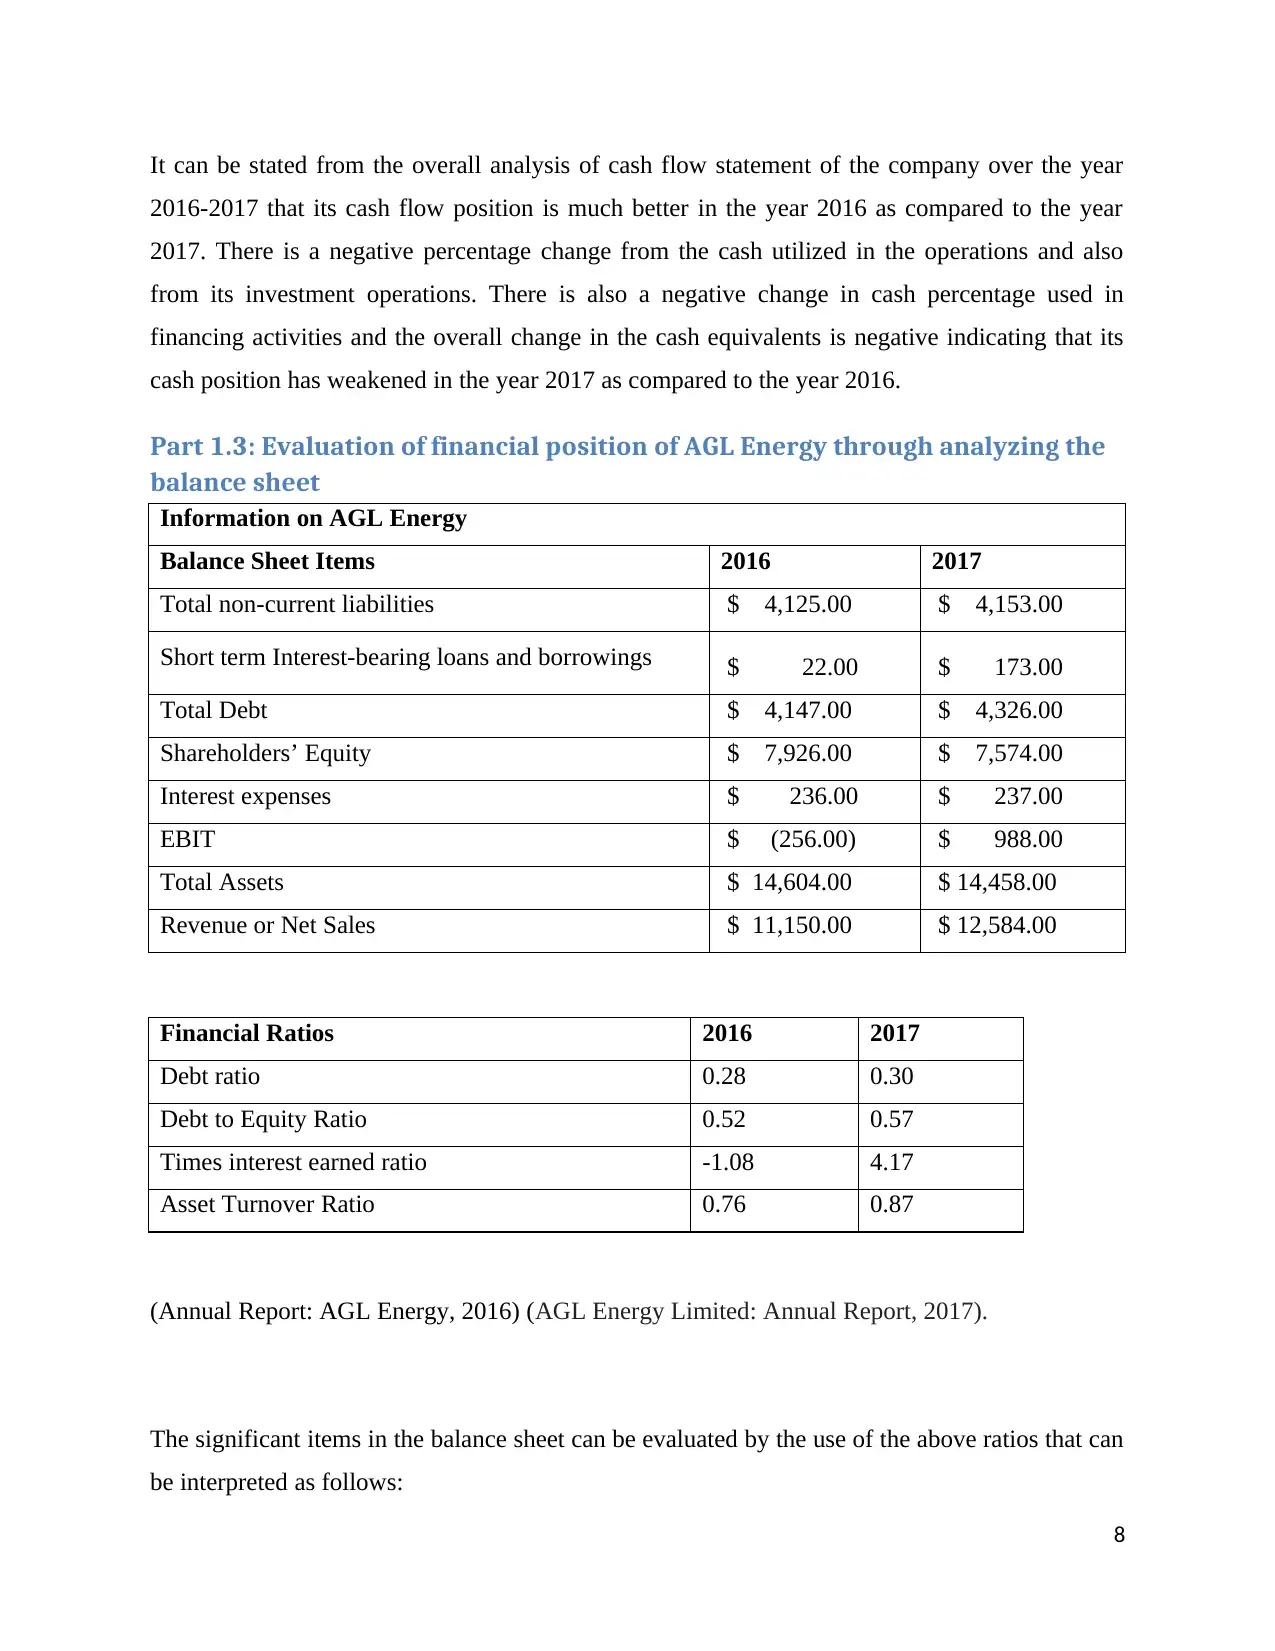
It can be stated from the overall analysis of cash flow statement of the company over the year
2016-2017 that its cash flow position is much better in the year 2016 as compared to the year
2017. There is a negative percentage change from the cash utilized in the operations and also
from its investment operations. There is also a negative change in cash percentage used in
financing activities and the overall change in the cash equivalents is negative indicating that its
cash position has weakened in the year 2017 as compared to the year 2016.
Part 1.3: Evaluation of financial position of AGL Energy through analyzing the
balance sheet
Information on AGL Energy
Balance Sheet Items 2016 2017
Total non-current liabilities $ 4,125.00 $ 4,153.00
Short term Interest-bearing loans and borrowings $ 22.00 $ 173.00
Total Debt $ 4,147.00 $ 4,326.00
Shareholders’ Equity $ 7,926.00 $ 7,574.00
Interest expenses $ 236.00 $ 237.00
EBIT $ (256.00) $ 988.00
Total Assets $ 14,604.00 $ 14,458.00
Revenue or Net Sales $ 11,150.00 $ 12,584.00
Financial Ratios 2016 2017
Debt ratio 0.28 0.30
Debt to Equity Ratio 0.52 0.57
Times interest earned ratio -1.08 4.17
Asset Turnover Ratio 0.76 0.87
(Annual Report: AGL Energy, 2016) (AGL Energy Limited: Annual Report, 2017).
The significant items in the balance sheet can be evaluated by the use of the above ratios that can
be interpreted as follows:
8
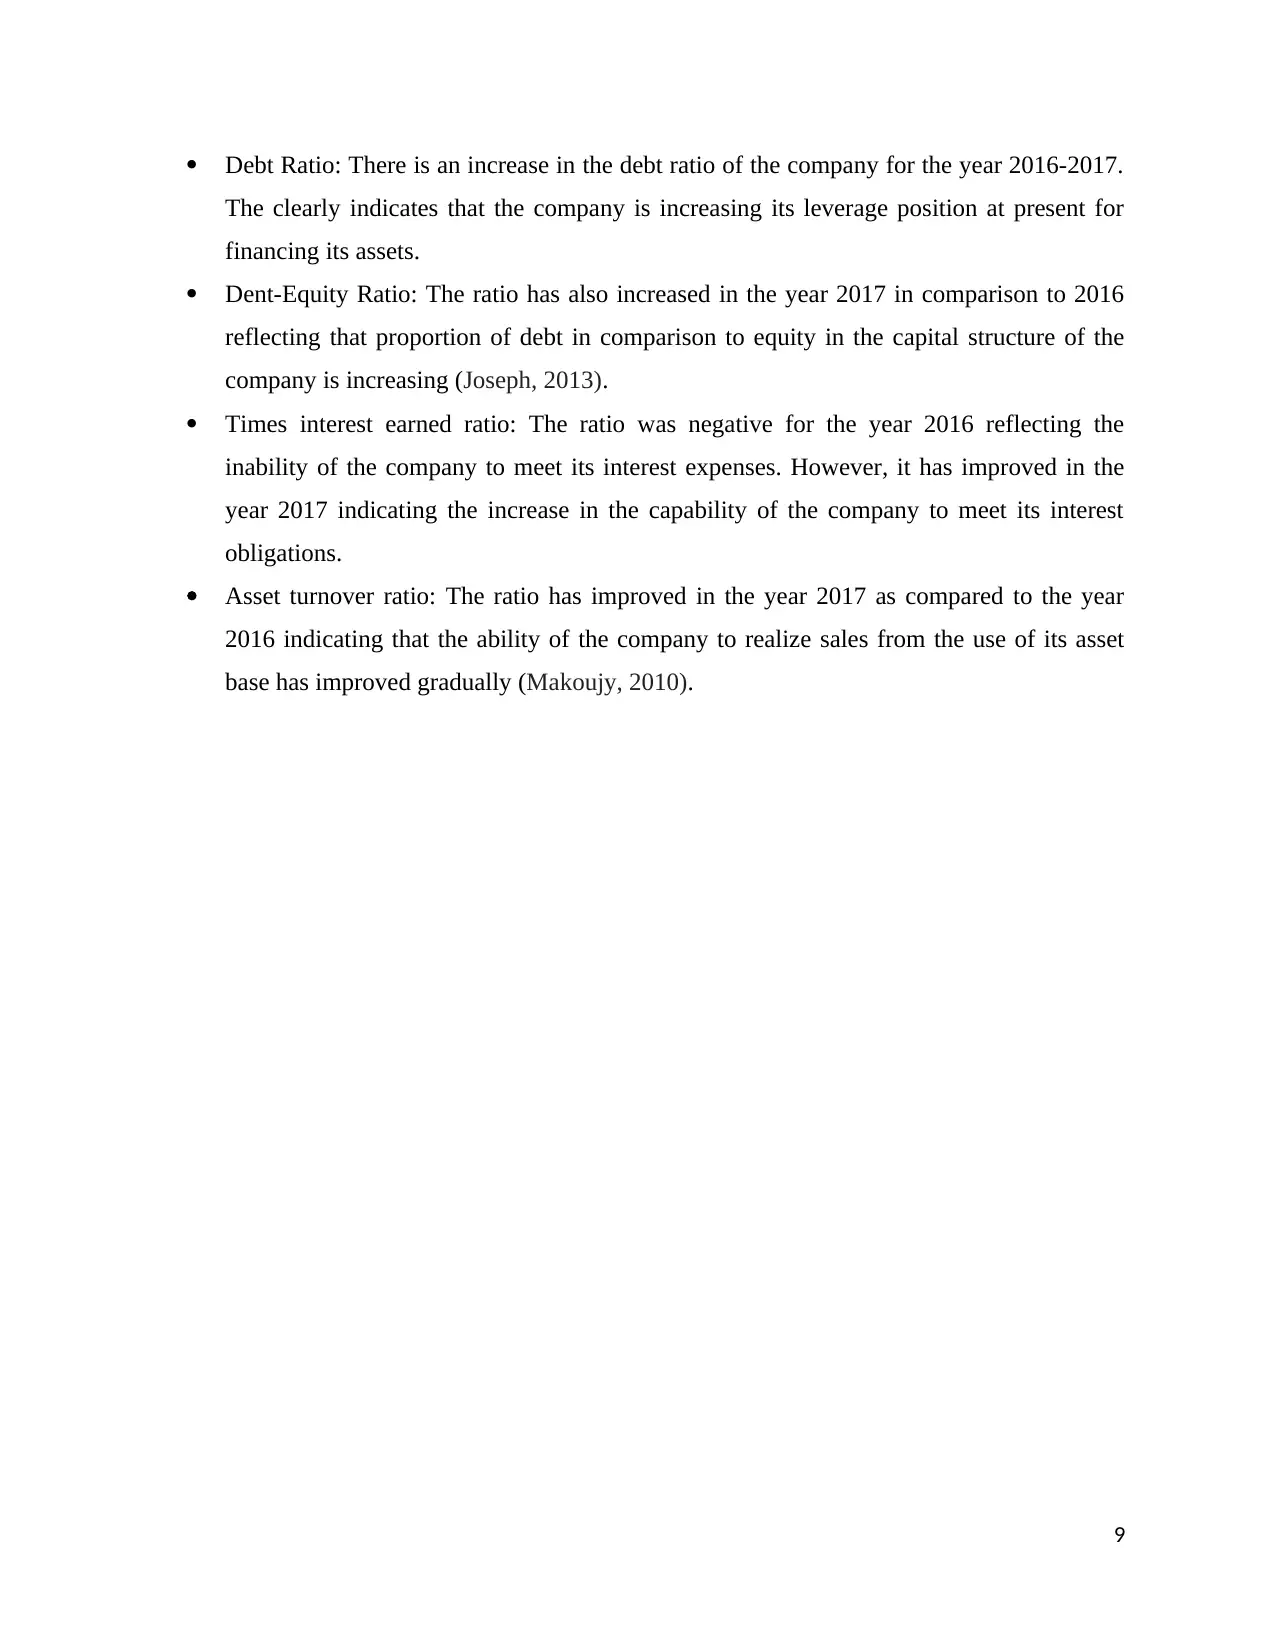
Debt Ratio: There is an increase in the debt ratio of the company for the year 2016-2017.
The clearly indicates that the company is increasing its leverage position at present for
financing its assets.
Dent-Equity Ratio: The ratio has also increased in the year 2017 in comparison to 2016
reflecting that proportion of debt in comparison to equity in the capital structure of the
company is increasing (Joseph, 2013).
Times interest earned ratio: The ratio was negative for the year 2016 reflecting the
inability of the company to meet its interest expenses. However, it has improved in the
year 2017 indicating the increase in the capability of the company to meet its interest
obligations.
Asset turnover ratio: The ratio has improved in the year 2017 as compared to the year
2016 indicating that the ability of the company to realize sales from the use of its asset
base has improved gradually (Makoujy, 2010).
9
⊘ This is a preview!⊘
Do you want full access?
Subscribe today to unlock all pages.
Trusted by 1+ million students worldwide
Section 2: Calculation of financial ratios of AGL Energy for last three
years
Financial Information of AGL Energy
Particulars 2017 2016 2015
Amount in $ millions
Net Profit after tax $ 539.00 $ (407.00) $ 218.00
Total assets $ 14,458.00 $ 14,604.00 $ 15,833.00
Cost of Goods Sold $ 11,131.00 $ 10,979.00 $ 9,759.00
Inventory $ 351.00 $ 414.00 $ 396.00
Average inventory $ 382.50 $ 405.00 $ 293.50
Current Assets $ 3,625.00 $ 3,587.00 $ 3,459.00
Quick Assets $ 3,274.00 $ 3,173.00 $ 3,063.00
Current Liabilities $ 2,731.00 $ 2,553.00 $ 2,373.00
Market price per share (MPS)
(June, 20__) $ 19.70 $ 14.60 $ 12.10
Earnings per share (EPS) $ 0.81
$
(0.61) $ 0.33
(Annual Report: AGL Energy, 2015) (Annual Report: AGL Energy, 2016) (AGL Energy
Limited: Annual Report, 2017).
Ratios Formula 2017 2016 2015
Profitability Ratio
Return on Assets Net Profit after tax/Total Assets 3.73% -2.79% 1.38%
Efficiency Ratios
Inventory Turnover
Ratio
Cost of Goods Sold/Average
Inventory 29.10 27.11 33.25
Liquidity Ratios
Quick Ratio Quick Assets/Current 1.20 1.24 1.29
10
Paraphrase This Document
Need a fresh take? Get an instant paraphrase of this document with our AI Paraphraser
Liabilities
Market Ratios
Price Earnings Ratio
Market price per
share/Earnings per share 24.47 -24.13 36.67
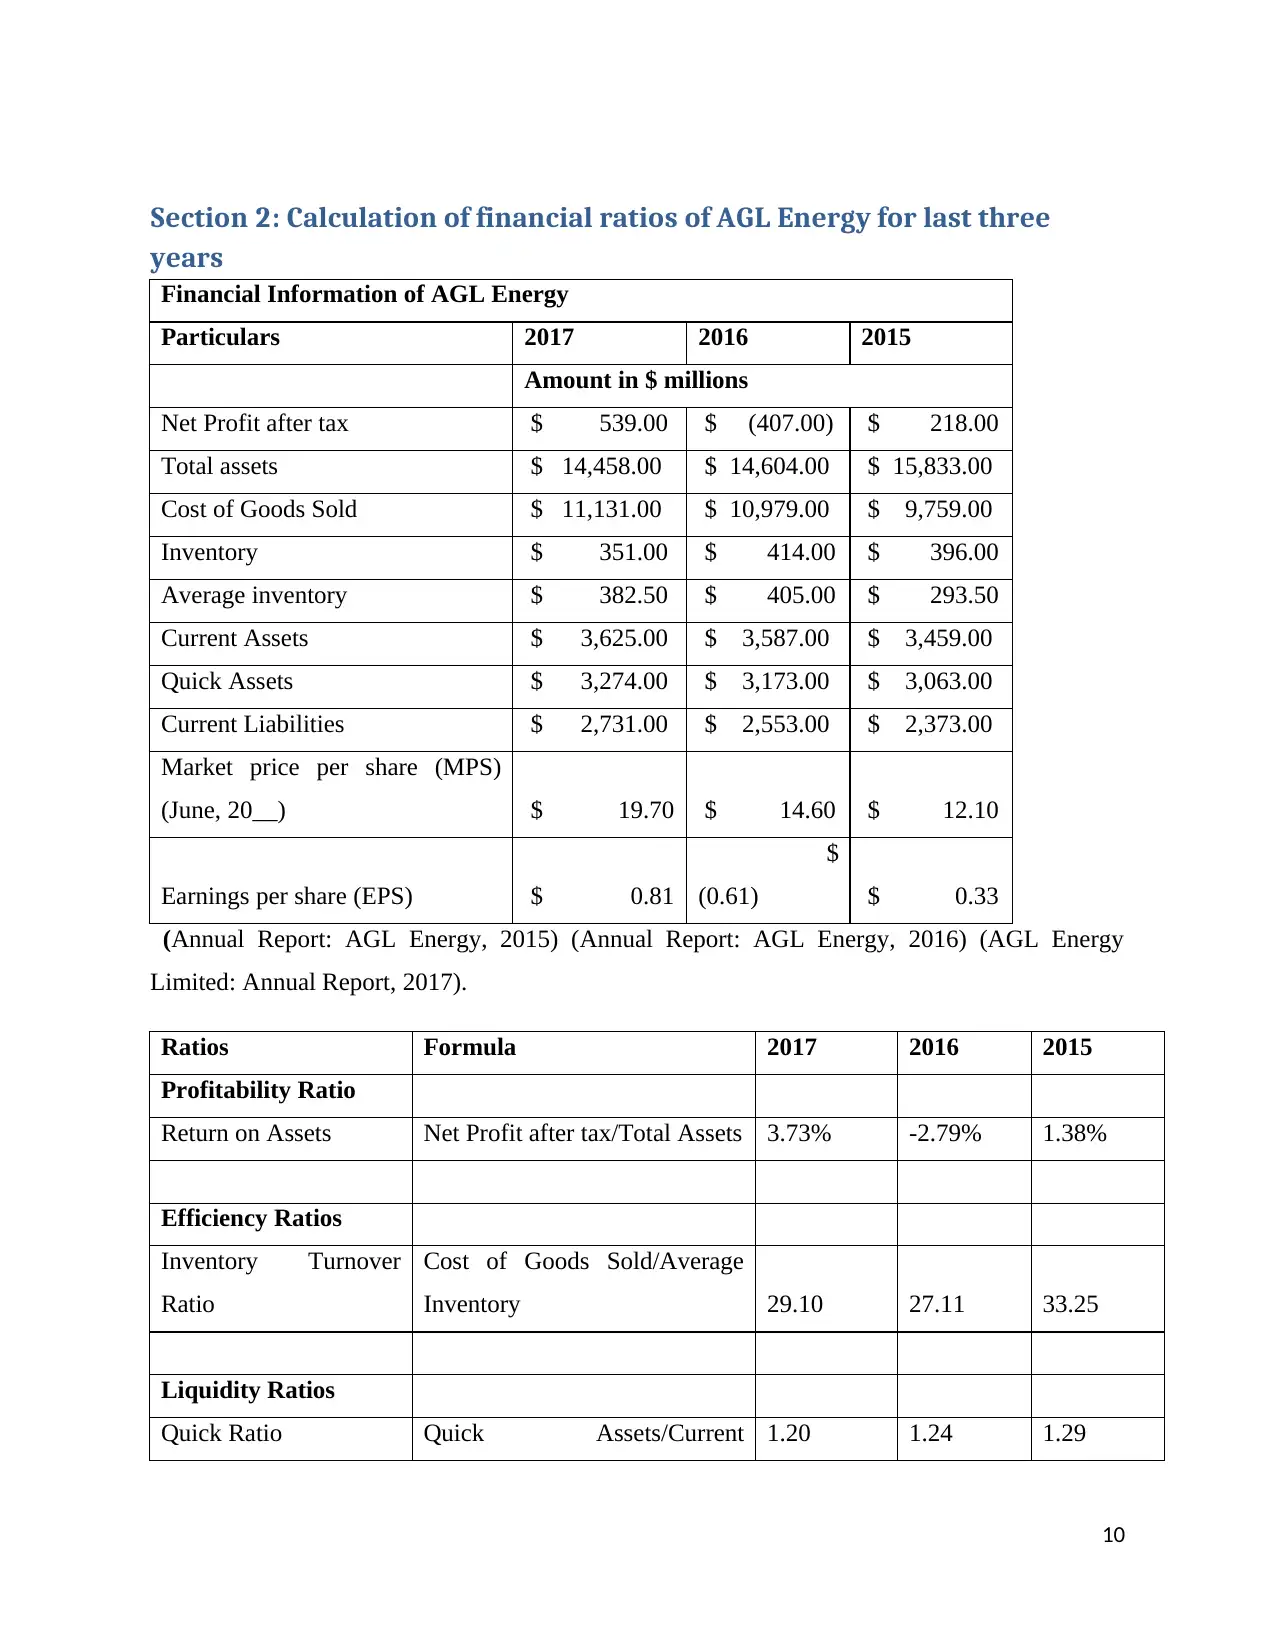
Return on Assets: The return on assets ratio is useful for depicting the overall profits realized
by an entity in comparison to the resources consumed. The total income realized by a company
with the use of its asset base is depicted with the use of this ratio. The return on assets ratio of
AGL Energy Limited has increased significantly from the year 2015-2017 depicting that its
efficiency to realize profits from the use of asset has improved. However, the ratio was worst for
the company in the year 2016 as a negative ratio depicts the financial loss and negative returns
from asset utilization (Palepu and Healy, 2007).
2017 2016 2015
-3.00%
-2.00%
-1.00%
0.00%
1.00%
2.00%
3.00%
4.00%
Return on Assets
Percentage
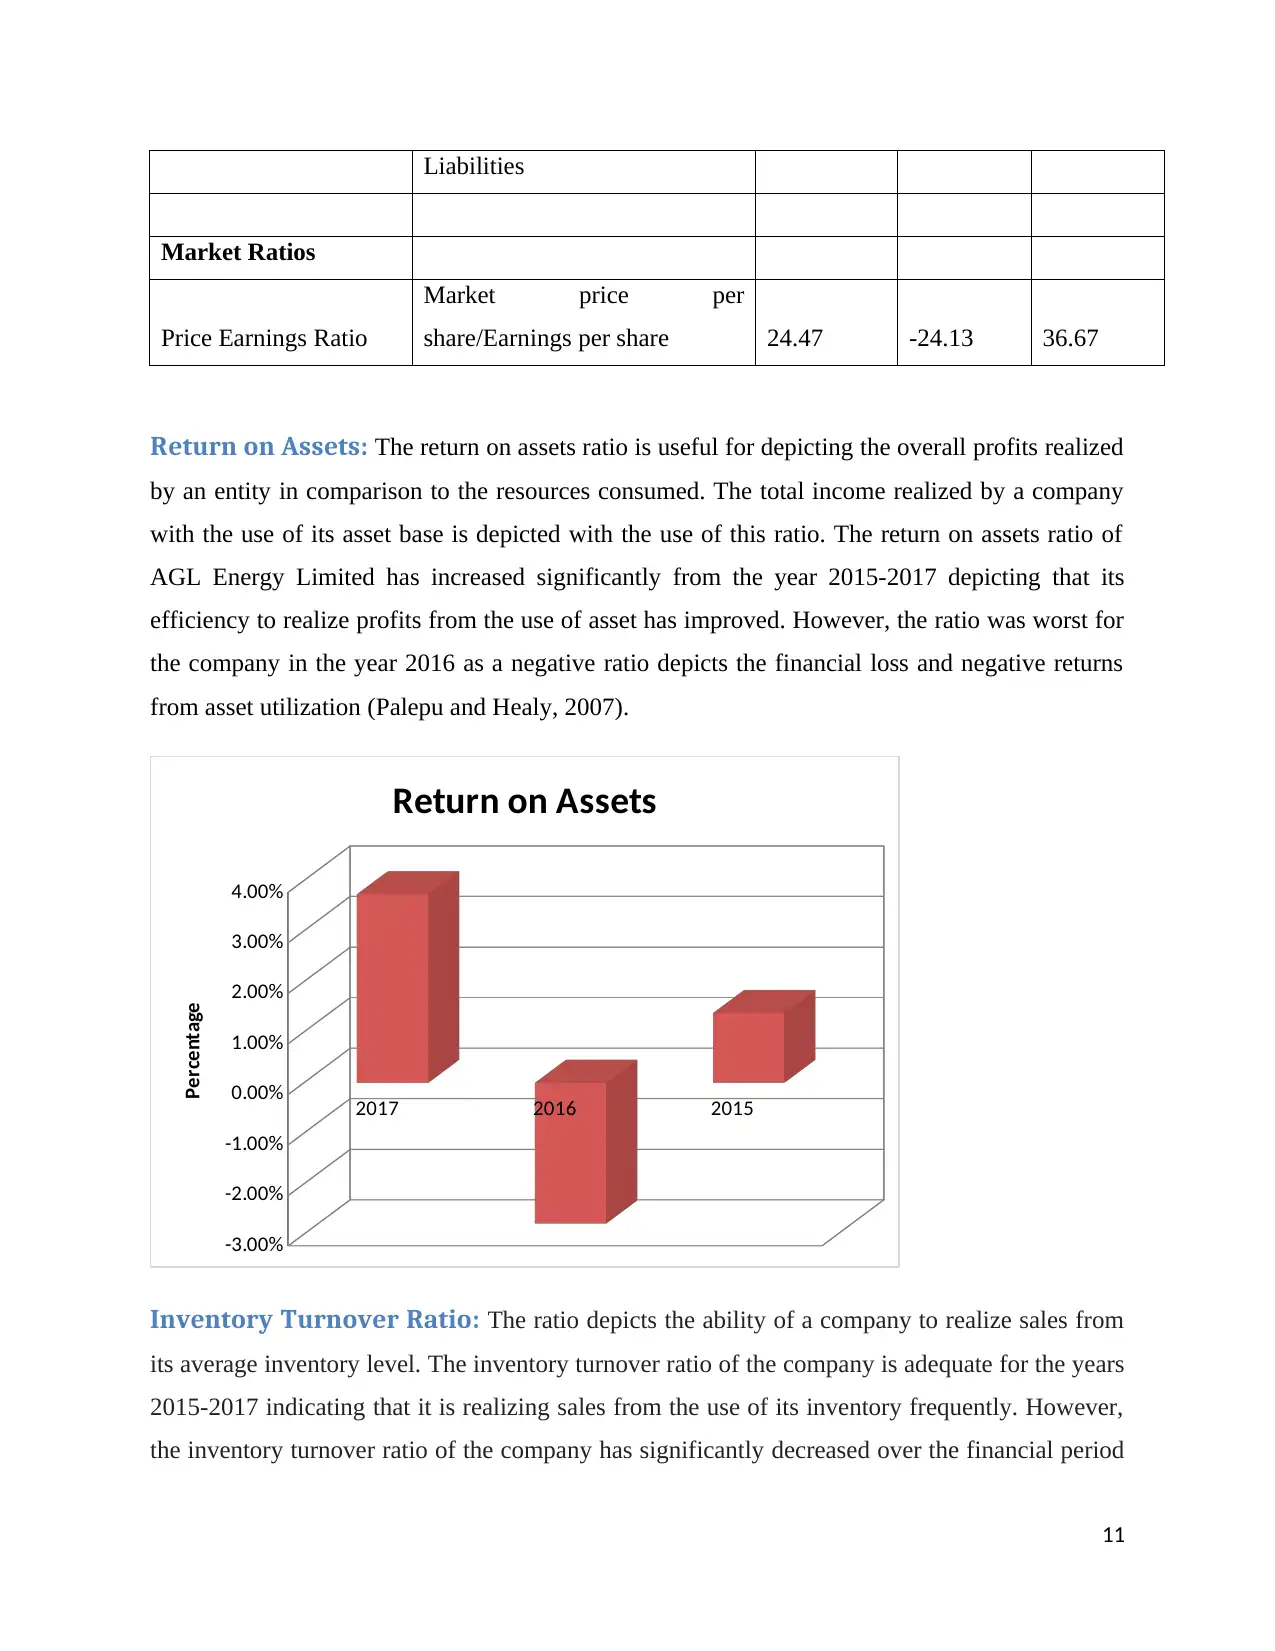
Inventory Turnover Ratio: The ratio depicts the ability of a company to realize sales from
its average inventory level. The inventory turnover ratio of the company is adequate for the years
2015-2017 indicating that it is realizing sales from the use of its inventory frequently. However,
the inventory turnover ratio of the company has significantly decreased over the financial period
11
Market Ratios
Price Earnings Ratio
Market price per
share/Earnings per share 24.47 -24.13 36.67
Return on Assets: The return on assets ratio is useful for depicting the overall profits realized
by an entity in comparison to the resources consumed. The total income realized by a company
with the use of its asset base is depicted with the use of this ratio. The return on assets ratio of
AGL Energy Limited has increased significantly from the year 2015-2017 depicting that its
efficiency to realize profits from the use of asset has improved. However, the ratio was worst for
the company in the year 2016 as a negative ratio depicts the financial loss and negative returns
from asset utilization (Palepu and Healy, 2007).
2017 2016 2015
-3.00%
-2.00%
-1.00%
0.00%
1.00%
2.00%
3.00%
4.00%
Return on Assets
Percentage
Inventory Turnover Ratio: The ratio depicts the ability of a company to realize sales from
its average inventory level. The inventory turnover ratio of the company is adequate for the years
2015-2017 indicating that it is realizing sales from the use of its inventory frequently. However,
the inventory turnover ratio of the company has significantly decreased over the financial period
11
2015-2017 indicating that its efficiency to realize sales from inventory is decreasing which can
impact its profitability position in the future context (Tracy, 2012).
2017 2016 2015
0.00
5.00
10.00
15.00
20.00
25.00
30.00
35.00
Inventory Turnover Ratio
In times
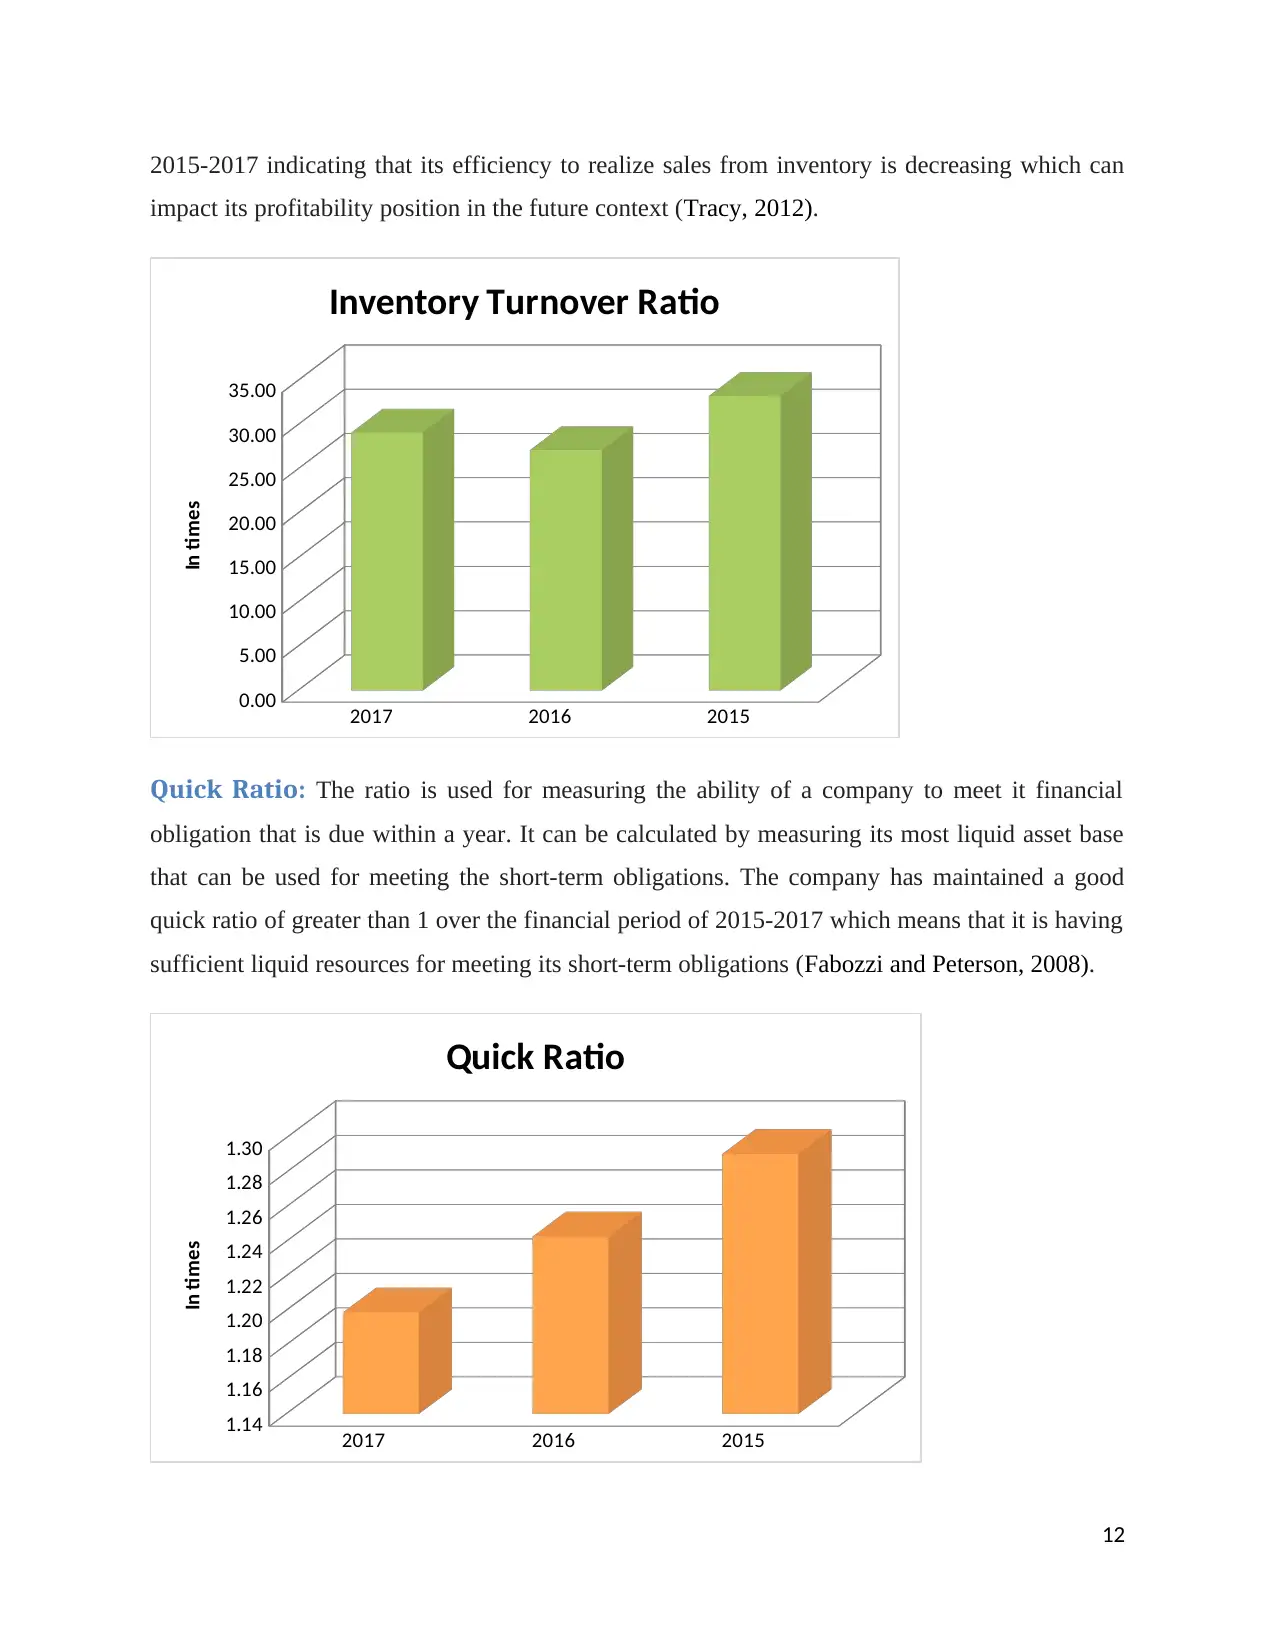
Quick Ratio: The ratio is used for measuring the ability of a company to meet it financial
obligation that is due within a year. It can be calculated by measuring its most liquid asset base
that can be used for meeting the short-term obligations. The company has maintained a good
quick ratio of greater than 1 over the financial period of 2015-2017 which means that it is having
sufficient liquid resources for meeting its short-term obligations (Fabozzi and Peterson, 2008).
2017 2016 2015
1.14
1.16
1.18
1.20
1.22
1.24
1.26
1.28
1.30
Quick Ratio
In times
12
impact its profitability position in the future context (Tracy, 2012).
2017 2016 2015
0.00
5.00
10.00
15.00
20.00
25.00
30.00
35.00
Inventory Turnover Ratio
In times
Quick Ratio: The ratio is used for measuring the ability of a company to meet it financial
obligation that is due within a year. It can be calculated by measuring its most liquid asset base
that can be used for meeting the short-term obligations. The company has maintained a good
quick ratio of greater than 1 over the financial period of 2015-2017 which means that it is having
sufficient liquid resources for meeting its short-term obligations (Fabozzi and Peterson, 2008).
2017 2016 2015
1.14
1.16
1.18
1.20
1.22
1.24
1.26
1.28
1.30
Quick Ratio
In times
12
⊘ This is a preview!⊘
Do you want full access?
Subscribe today to unlock all pages.
Trusted by 1+ million students worldwide
1 out of 19
Related Documents


Your All-in-One AI-Powered Toolkit for Academic Success.
+13062052269
info@desklib.com
Available 24*7 on WhatsApp / Email
![[object Object]](/_next/static/media/star-bottom.7253800d.svg)
Unlock your academic potential
Copyright © 2020–2026 A2Z Services. All Rights Reserved. Developed and managed by ZUCOL.