Financial Performance Analysis of Automotive Holdings Group (AHG)
VerifiedAdded on 2020/12/09
|17
|5339
|331
Report
AI Summary
This report provides a comprehensive financial and legal analysis of Automotive Holdings Group (AHG), an ASX-listed company in the automotive industry. The report begins with an overview of AHG, its ownership structure, and governance. It then delves into a detailed ratio analysis, covering liquidity, solvency, efficiency, profitability, and market value ratios for 2016 and 2017. The analysis includes calculations and interpretations of current ratios, quick ratios, debt ratios, debt-to-equity ratios, asset turnover, net profit margins, ROE, ROA, EPS, and PE ratios. The report also explores significant announcements and determines the CAPM and WACC for AHG. Furthermore, it discusses dividend policies and concludes with recommendations. The report aims to assess AHG's financial health, performance, and market position, providing insights for stakeholders and potential investors. The report is contributed by a student to be published on the website Desklib, which is a platform providing all the necessary AI based study tools for students.

BUSINESS AND
CORPORATE LAW
CORPORATE LAW
Paraphrase This Document
Need a fresh take? Get an instant paraphrase of this document with our AI Paraphraser
TABLE OF CONTENTS
INTRODUCTION...........................................................................................................................1
QUESTIONS...................................................................................................................................1
1 Overview of Automotive Holdings Group..........................................................................1
2.Specifying the ownership and governance structure...........................................................2
3. Identifying fundamental ratios of Automotive Holding Group..........................................3
4.Analysing the share price of Automotive Holding Group with the help of ASX disclosures. 8
5. Determining the significant announcement of Automotive Holding Group....................10
6. Measuring the CAPM of Automotive Holding Group.....................................................11
7. Analysing WACC for Automotive Holding Group..........................................................12
8.Determining the debt ratio of Automotive Holding Group...............................................13
9. Discussing the dividend policies of company..................................................................13
10. Recommendation for client............................................................................................14
REFERENCES..............................................................................................................................15
INTRODUCTION
To have appropriate governance over the company's activities and performance in market
there is need to have effective legal control over the business. In relation with that Australian
corporation laws are proposed to serve the best legal execution and activities all over the nation.
It manages the trade practices, legal issues and the monetary system of the corporations with
influences of various laws and amendments. It also includes various statutes and laws that were
enacted by Corporate Act 2001 under administration of Australian Securities and Investments
Commission. In the present report there will be analysis base on ASX listed Automotive Holding
Group which is operating in manufacturing serving motor vehicles in Australis. The analysis will
be made over share prices, market value, current beta rate, risk free rate which helps in
determining liquidity, portability, efficiency of the organisation.
QUESTIONS
1 Overview of Automotive Holdings Group
This organisation operates in manufacturing and facilitating the motor vehicles,
refrigerated logistics and relevant products in Australia. It has approximately covered the 190
motor vehicle franchises at 110 dealership locations which are stated in Australia and New
Zealand. It is the largest Automotive industry in Australia which operates in various
segmentation such as Western Australian, New south Wales, Queensland and Victoria. On the
other side, it not only operates Australia but it has wider operational scope in the various cities of
world. It includes subsidiary organisation such as Rand Transport, Harris Refrigerated Transport,
JAT Refrigerated Road Services and Scott's Refrigerated Freight-ways. Similarly, KTM
Sportmotorcycles, Higher Bus, AMCAP and HQVA are also denoted as the subsidiary
businesses of this organisation (AHG Annual report, 2017). Therefore, to bring the appropriate
increment in the revenue, financial health as well as capital structure of the firm there is need to
have appropriate analysis over the facts.
1
⊘ This is a preview!⊘
Do you want full access?
Subscribe today to unlock all pages.
Trusted by 1+ million students worldwide
2.Specifying the ownership and governance structure
Main substantial shareholders:
Main people of Automotive Holding Group Role in organisation
Chairman John McConnell [Managing director]
Board members John McConnell [Managing director]
Giovanni (John) Groppoli [Non-
Executive Director]
Greg Duncan OAM [Chartered
Accountant, investor and Consultant]
Howard Critchley [Non-Executive
Director]
Jane MacKellar [Non-executive
director]
Andrea Hall [Board of director]
CEO John McConnell [Managing director]
2
Paraphrase This Document
Need a fresh take? Get an instant paraphrase of this document with our AI Paraphraser
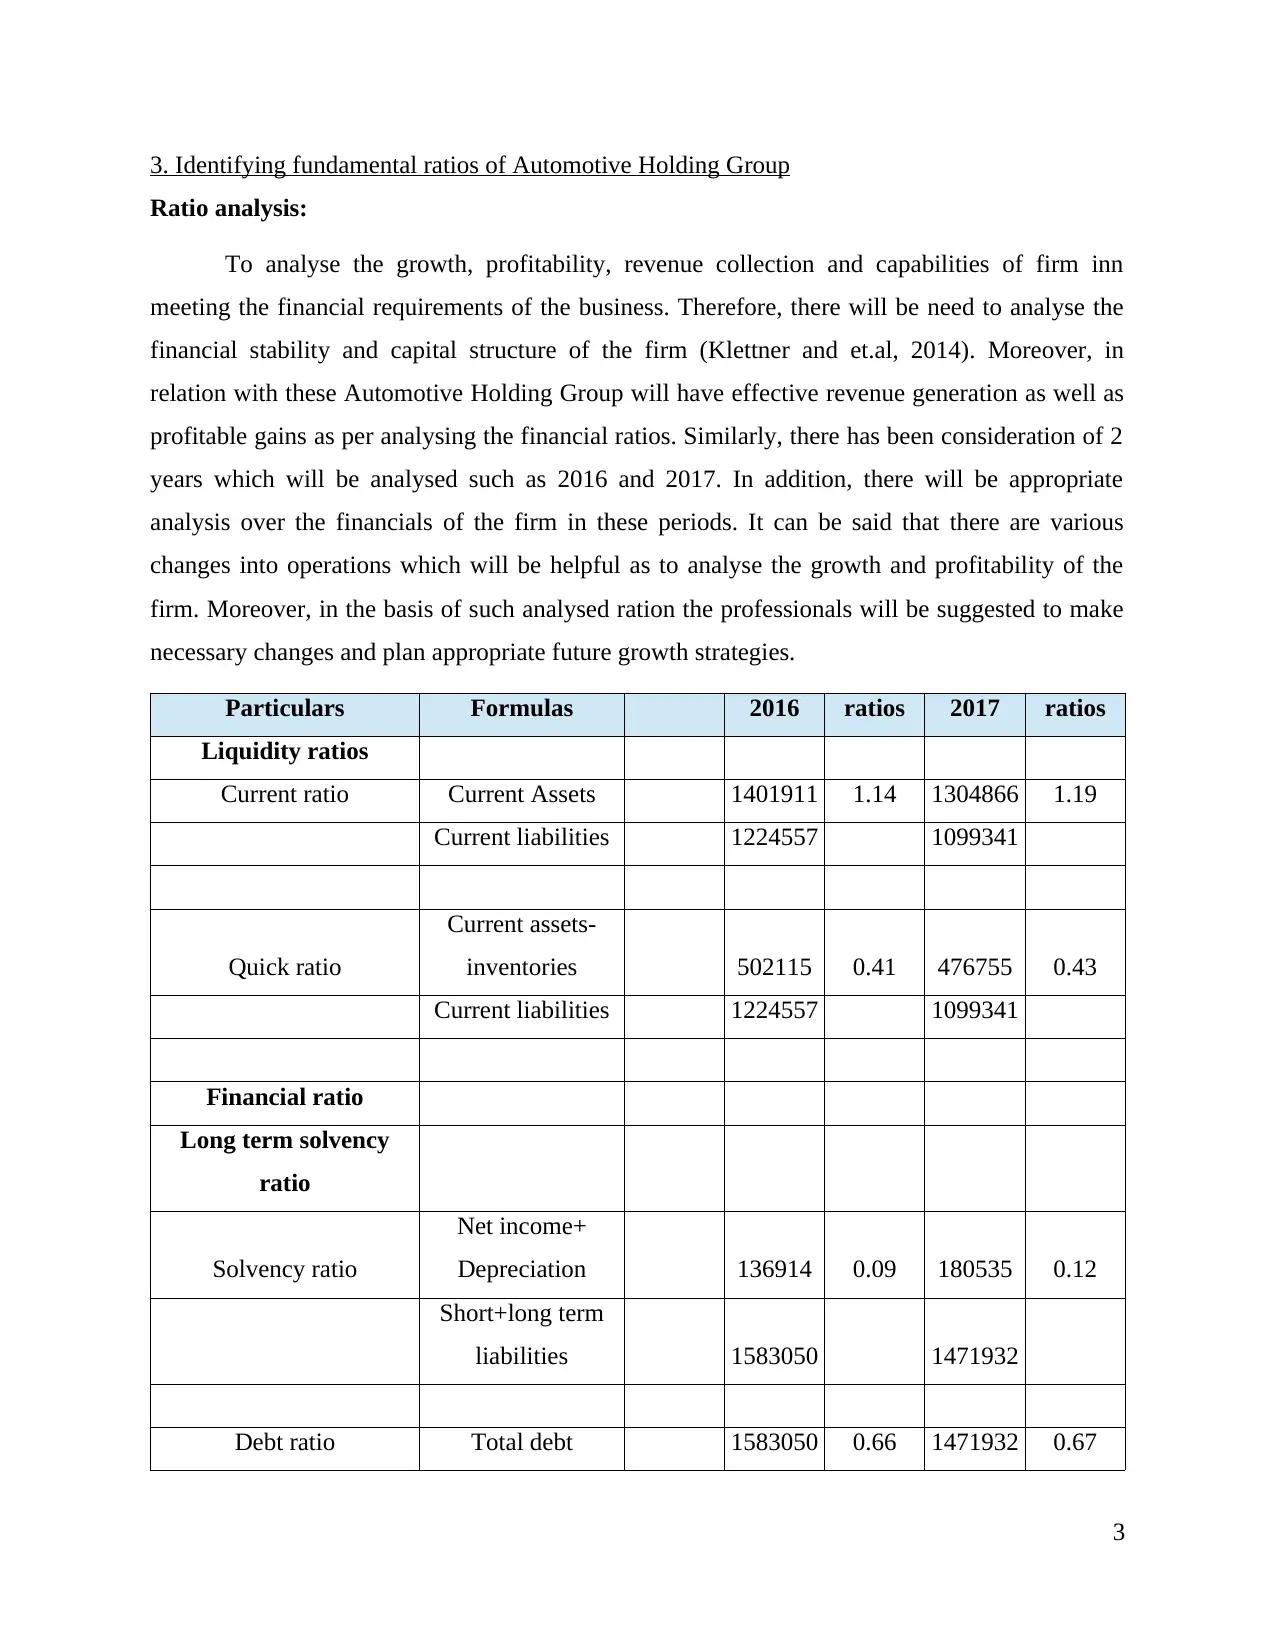
3. Identifying fundamental ratios of Automotive Holding Group
Ratio analysis:
To analyse the growth, profitability, revenue collection and capabilities of firm inn
meeting the financial requirements of the business. Therefore, there will be need to analyse the
financial stability and capital structure of the firm (Klettner and et.al, 2014). Moreover, in
relation with these Automotive Holding Group will have effective revenue generation as well as
profitable gains as per analysing the financial ratios. Similarly, there has been consideration of 2
years which will be analysed such as 2016 and 2017. In addition, there will be appropriate
analysis over the financials of the firm in these periods. It can be said that there are various
changes into operations which will be helpful as to analyse the growth and profitability of the
firm. Moreover, in the basis of such analysed ration the professionals will be suggested to make
necessary changes and plan appropriate future growth strategies.
Particulars Formulas 2016 ratios 2017 ratios
Liquidity ratios
Current ratio Current Assets 1401911 1.14 1304866 1.19
Current liabilities 1224557 1099341
Quick ratio
Current assets-
inventories 502115 0.41 476755 0.43
Current liabilities 1224557 1099341
Financial ratio
Long term solvency
ratio
Solvency ratio
Net income+
Depreciation 136914 0.09 180535 0.12
Short+long term
liabilities 1583050 1471932
Debt ratio Total debt 1583050 0.66 1471932 0.67
3
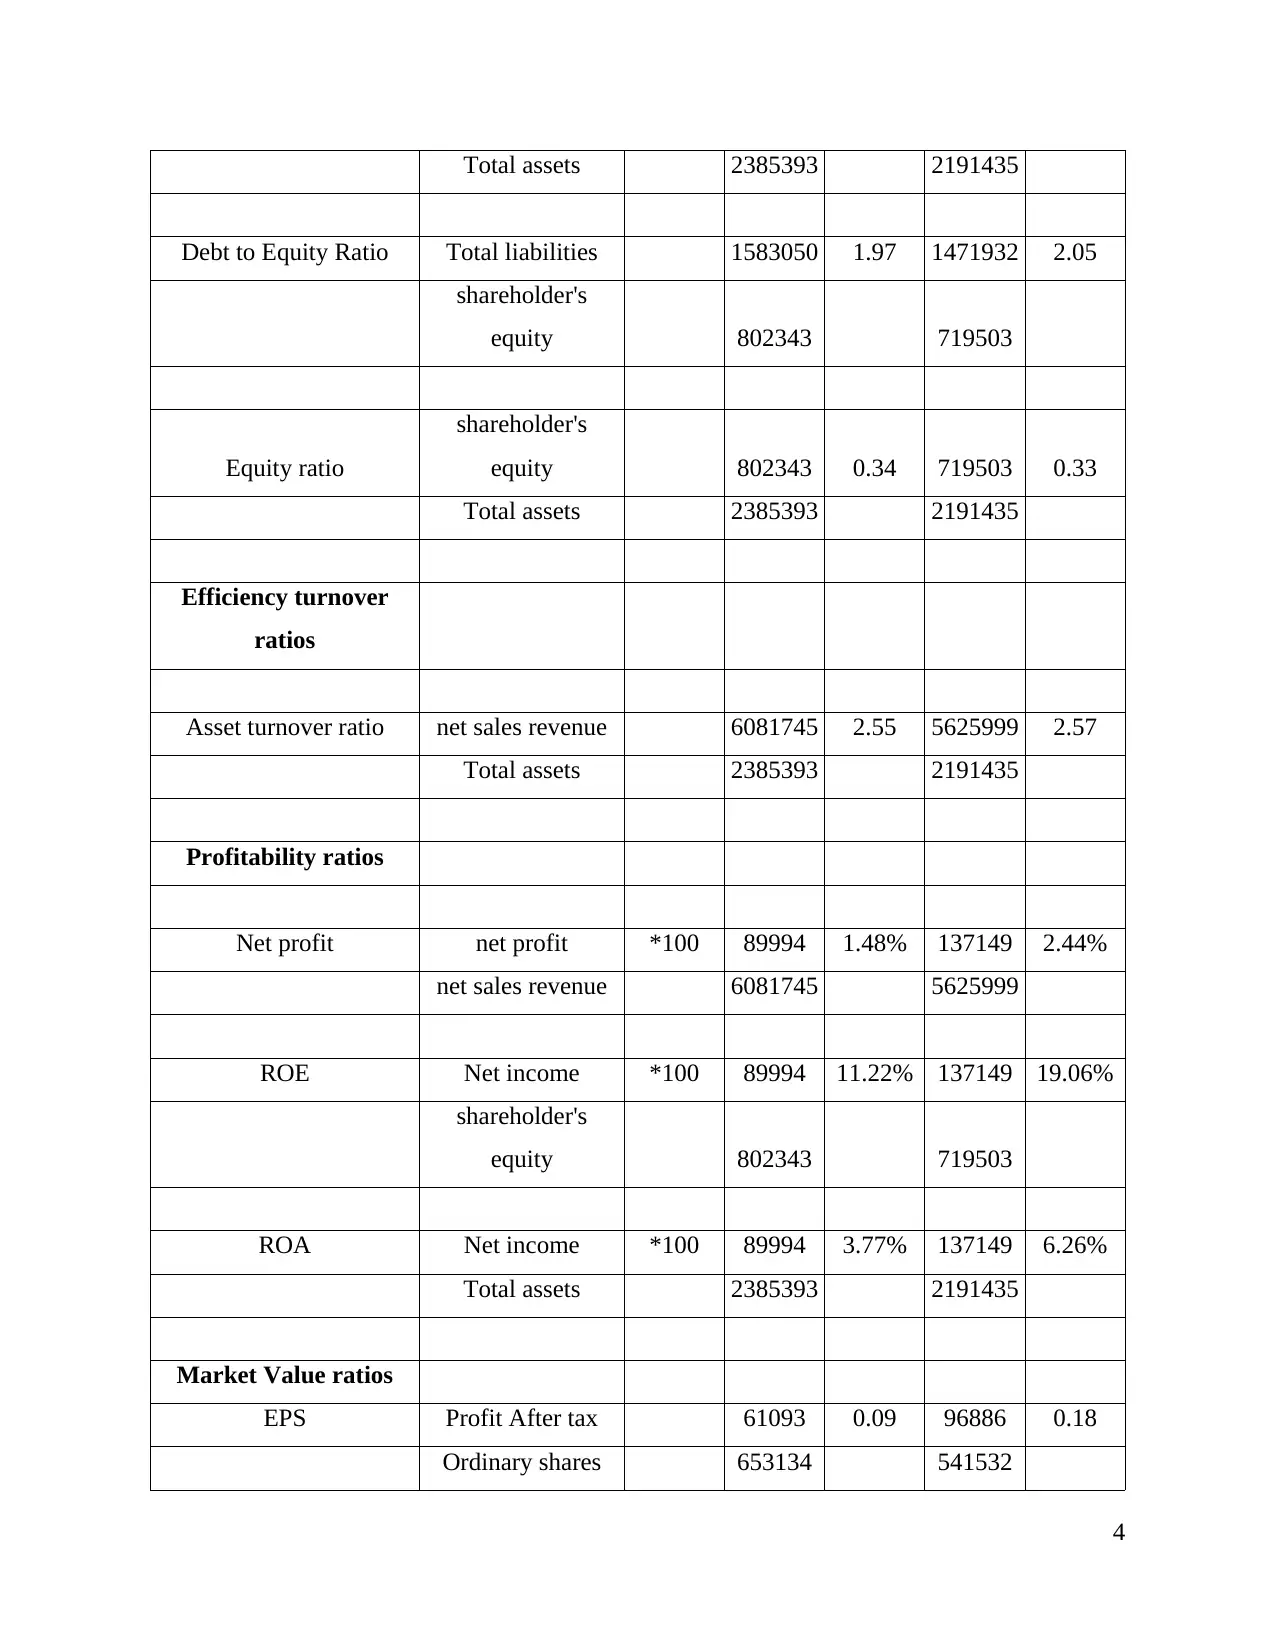
Total assets 2385393 2191435
Debt to Equity Ratio Total liabilities 1583050 1.97 1471932 2.05
shareholder's
equity 802343 719503
Equity ratio
shareholder's
equity 802343 0.34 719503 0.33
Total assets 2385393 2191435
Efficiency turnover
ratios
Asset turnover ratio net sales revenue 6081745 2.55 5625999 2.57
Total assets 2385393 2191435
Profitability ratios
Net profit net profit *100 89994 1.48% 137149 2.44%
net sales revenue 6081745 5625999
ROE Net income *100 89994 11.22% 137149 19.06%
shareholder's
equity 802343 719503
ROA Net income *100 89994 3.77% 137149 6.26%
Total assets 2385393 2191435
Market Value ratios
EPS Profit After tax 61093 0.09 96886 0.18
Ordinary shares 653134 541532
4
⊘ This is a preview!⊘
Do you want full access?
Subscribe today to unlock all pages.
Trusted by 1+ million students worldwide
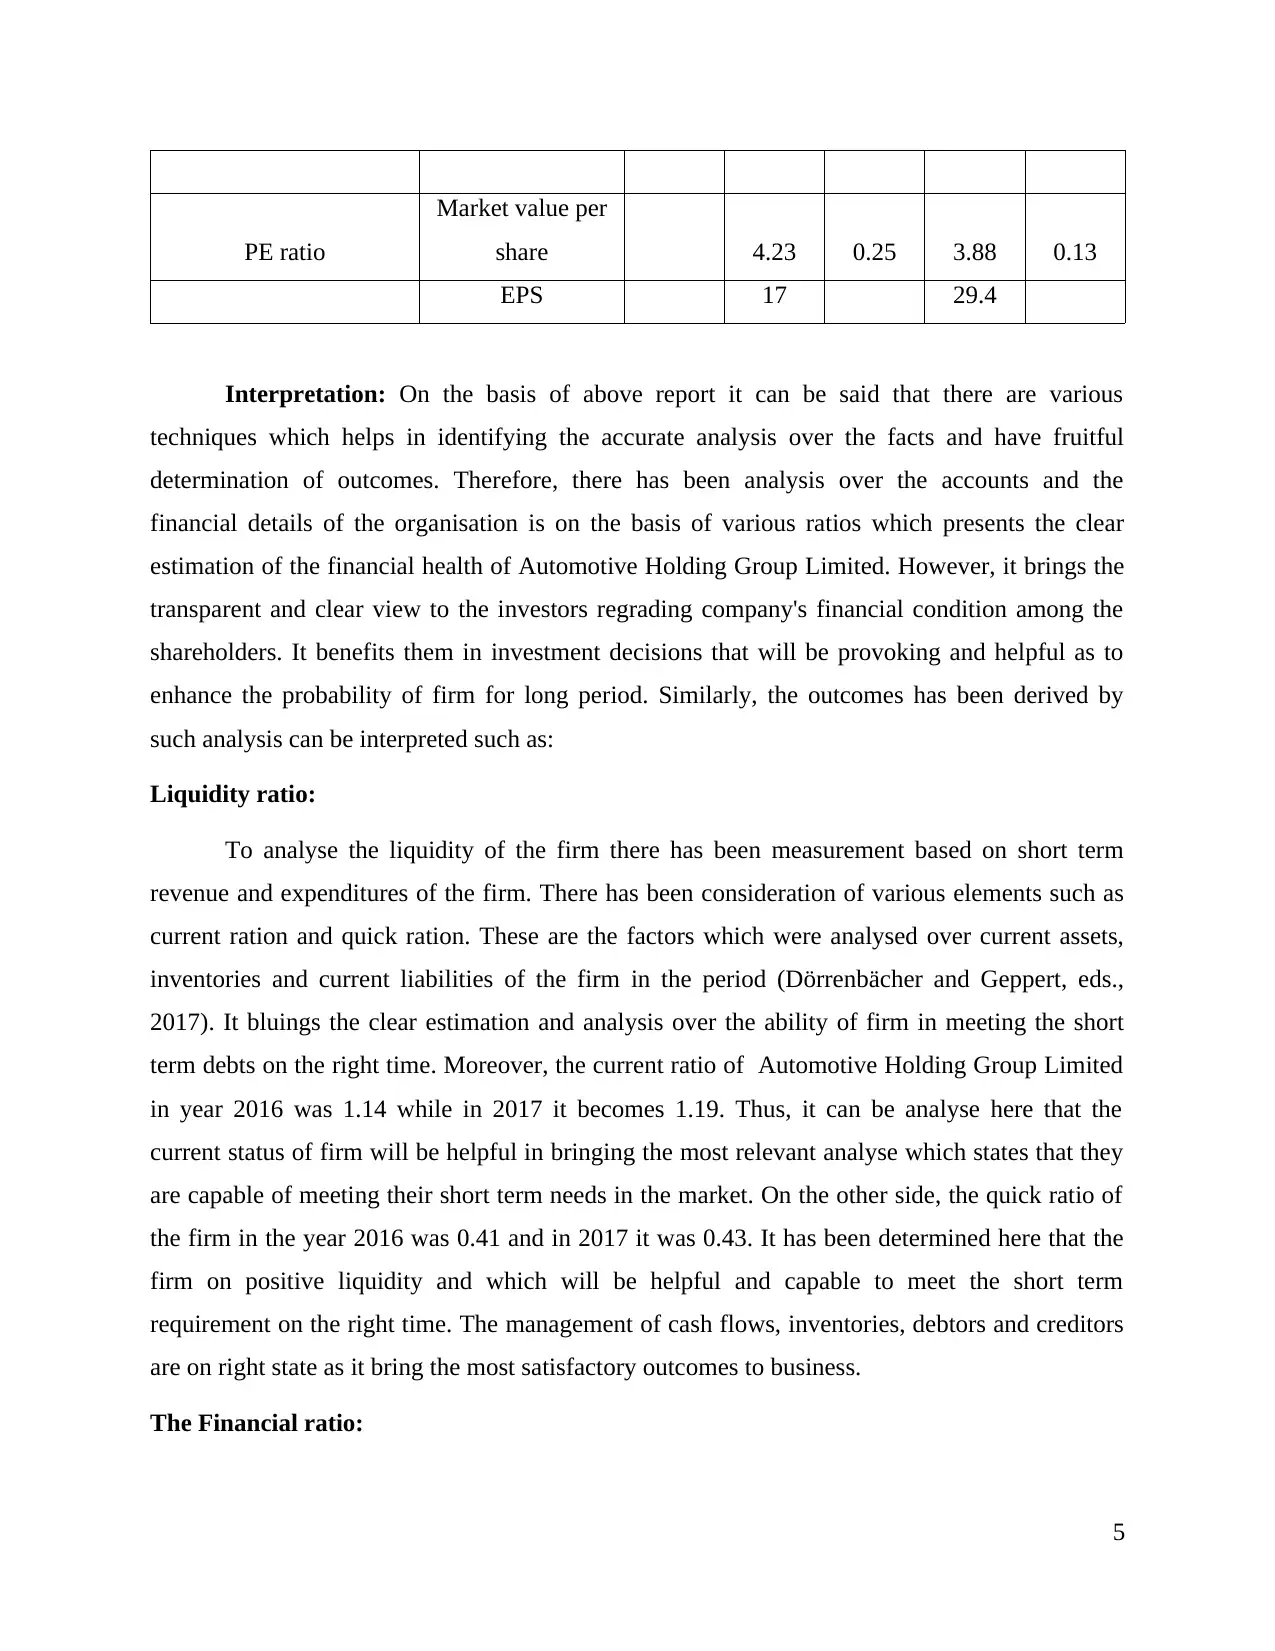
PE ratio
Market value per
share 4.23 0.25 3.88 0.13
EPS 17 29.4
Interpretation: On the basis of above report it can be said that there are various
techniques which helps in identifying the accurate analysis over the facts and have fruitful
determination of outcomes. Therefore, there has been analysis over the accounts and the
financial details of the organisation is on the basis of various ratios which presents the clear
estimation of the financial health of Automotive Holding Group Limited. However, it brings the
transparent and clear view to the investors regrading company's financial condition among the
shareholders. It benefits them in investment decisions that will be provoking and helpful as to
enhance the probability of firm for long period. Similarly, the outcomes has been derived by
such analysis can be interpreted such as:
Liquidity ratio:
To analyse the liquidity of the firm there has been measurement based on short term
revenue and expenditures of the firm. There has been consideration of various elements such as
current ration and quick ration. These are the factors which were analysed over current assets,
inventories and current liabilities of the firm in the period (Dörrenbächer and Geppert, eds.,
2017). It bluings the clear estimation and analysis over the ability of firm in meeting the short
term debts on the right time. Moreover, the current ratio of Automotive Holding Group Limited
in year 2016 was 1.14 while in 2017 it becomes 1.19. Thus, it can be analyse here that the
current status of firm will be helpful in bringing the most relevant analyse which states that they
are capable of meeting their short term needs in the market. On the other side, the quick ratio of
the firm in the year 2016 was 0.41 and in 2017 it was 0.43. It has been determined here that the
firm on positive liquidity and which will be helpful and capable to meet the short term
requirement on the right time. The management of cash flows, inventories, debtors and creditors
are on right state as it bring the most satisfactory outcomes to business.
The Financial ratio:
5
Paraphrase This Document
Need a fresh take? Get an instant paraphrase of this document with our AI Paraphraser
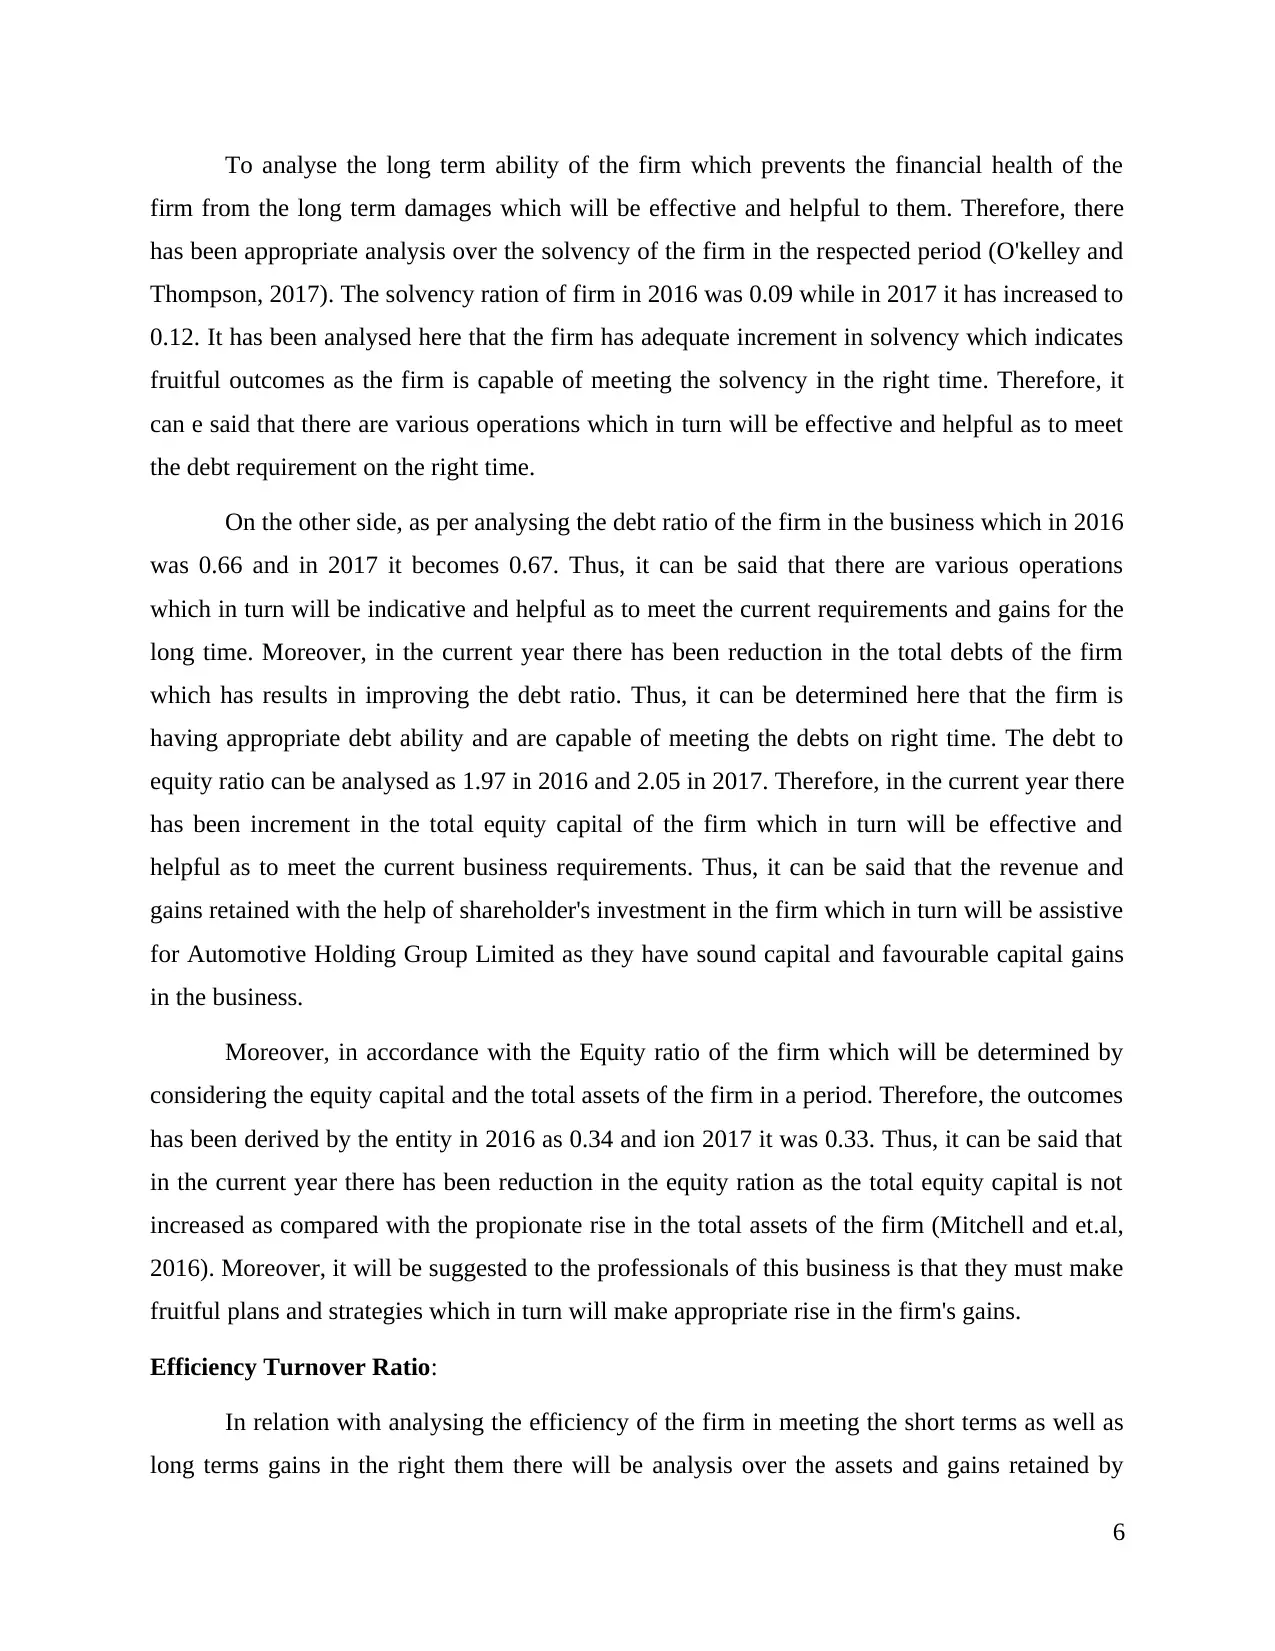
To analyse the long term ability of the firm which prevents the financial health of the
firm from the long term damages which will be effective and helpful to them. Therefore, there
has been appropriate analysis over the solvency of the firm in the respected period (O'kelley and
Thompson, 2017). The solvency ration of firm in 2016 was 0.09 while in 2017 it has increased to
0.12. It has been analysed here that the firm has adequate increment in solvency which indicates
fruitful outcomes as the firm is capable of meeting the solvency in the right time. Therefore, it
can e said that there are various operations which in turn will be effective and helpful as to meet
the debt requirement on the right time.
On the other side, as per analysing the debt ratio of the firm in the business which in 2016
was 0.66 and in 2017 it becomes 0.67. Thus, it can be said that there are various operations
which in turn will be indicative and helpful as to meet the current requirements and gains for the
long time. Moreover, in the current year there has been reduction in the total debts of the firm
which has results in improving the debt ratio. Thus, it can be determined here that the firm is
having appropriate debt ability and are capable of meeting the debts on right time. The debt to
equity ratio can be analysed as 1.97 in 2016 and 2.05 in 2017. Therefore, in the current year there
has been increment in the total equity capital of the firm which in turn will be effective and
helpful as to meet the current business requirements. Thus, it can be said that the revenue and
gains retained with the help of shareholder's investment in the firm which in turn will be assistive
for Automotive Holding Group Limited as they have sound capital and favourable capital gains
in the business.
Moreover, in accordance with the Equity ratio of the firm which will be determined by
considering the equity capital and the total assets of the firm in a period. Therefore, the outcomes
has been derived by the entity in 2016 as 0.34 and ion 2017 it was 0.33. Thus, it can be said that
in the current year there has been reduction in the equity ration as the total equity capital is not
increased as compared with the propionate rise in the total assets of the firm (Mitchell and et.al,
2016). Moreover, it will be suggested to the professionals of this business is that they must make
fruitful plans and strategies which in turn will make appropriate rise in the firm's gains.
Efficiency Turnover Ratio:
In relation with analysing the efficiency of the firm in meeting the short terms as well as
long terms gains in the right them there will be analysis over the assets and gains retained by
6
them in a financial year (Huggins and et.al, 2015). Therefore, to analyse the efficiency of firm
there will be assessment of asset turnover ratio which comprises with analysing the net sales
revenue of the entity over total assets. Thus, in 2016 the asset turnover ratio of entity was 2.55
and in 2017 it raised up to 2.57. It has been determined here that the firm will have effective
revenue and sales of its goods and services which will make the increment in the ration and
develop the favourable efficiency in the market.
Profitability Ratio:
These are the ration which will be indicative and helpful to the business as to have
appropriate rise in the revenue or gains of the firm in the recent times. Therefore, it will be
helpful to communicate these details among the shareholder or investors of the firm which in
turn will be impressive and attractive to them for retaining the dividend benefits. However, with
the help of such analysis will enable them to analyse the profitability of firm in making return to
their shareholders over the period (Godwin, 2015). It will help them in generating the large
number of investors which in turn makes necessary improvements in the share capital of
Automotive Holding Group Limited.
On the other side, the net profit of the firm in the year 2016 was 1.48% and in 2017 it
becomes 2.44% therefore, in the current year there has been rise in the sales revenue as well as
reduction ion the operating expense. Moreover, to make it appropriate and rise it to have
satisfactory gains Automotive Holding Group Limited needs to manage this ratio between 4-8%
of margin. Similarly, the return of equity has been analysed by the researcher is that in 2016 the
firm is capable of giving returns at 11.22% while in 2017 it has risen up to 19.06%. Moreover, in
relation with the total income and equity collected in these period which together represents the
most appropriate and satisfactory analysis over the outcomes on which it can be said that they are
able to bring the satisfactory returns to the investors (Leung and et.al, 2014). There return on
assets of the firm in these respective years has been analysed as per determining the satisfactory
gains such as net income and total assets in a period. In 2016 the returns was 3.77% while in
2017 it was 6.26%. However, in comparison with the previous period Automotive Holding
Group Limited is capable of giving the satisfactory return in the current year.
Market value ratio:
7
⊘ This is a preview!⊘
Do you want full access?
Subscribe today to unlock all pages.
Trusted by 1+ million students worldwide
These are the ratios which ascertains the current prices of the marketable securities on the
publicly held shares of firm. Therefore, it brings the clear determination of the share prices of the
organisation which will be assistive to the equity holder in relation with analysing the prices are
under valued or over valued (Evans, Lignier and Tran-Nam, 2016). Moreover, the shares will be
traded in the capital market over their fair value. Thus, the chances of beating the stock market
become impossible for the investors. However, in relation with Automotive Holding Group
Limited there has been analysis over the market value price of its shares have been analysed
through EPS and PE ratio. Moreover, the earning per share of entity has been analysed here in
2016 as 0.09 and in 2017 it was 0.18. Therefore, in comparing with the last year the firm is more
capable in the current year in terms of making favourable earning per share. Therefore, the firm
is base to have the earning over the invested share capital by the investors in the firm.
On the other side, in a term with PE ratio where the consideration of market value per
share and EPS generated by the firm in the period will have effective gains as to analyse these
ratios. Therefore, in 2016 it was 0.25 and in 2017 it becomes 0.13. Therefore, in the current year
there has been reduction in the market value of Automotive Holding Group Limited's shares.
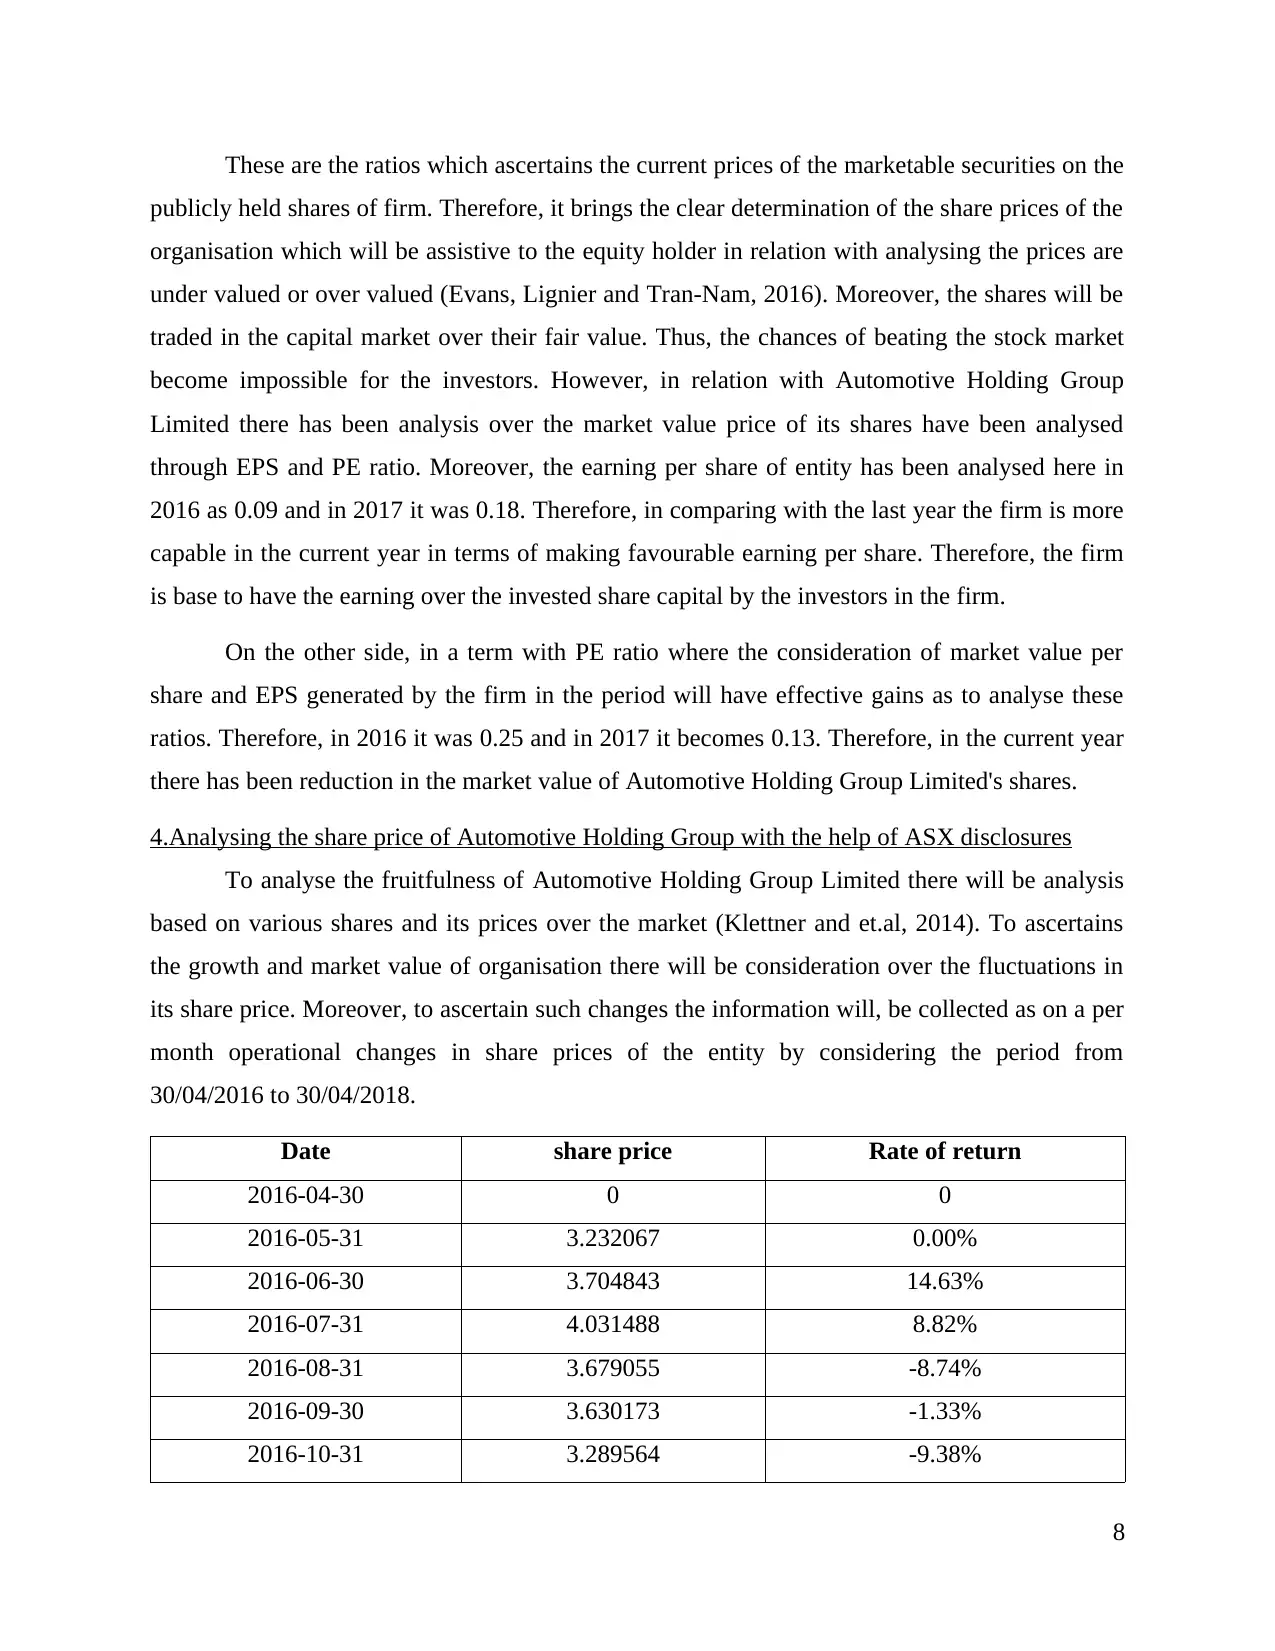
4.Analysing the share price of Automotive Holding Group with the help of ASX disclosures
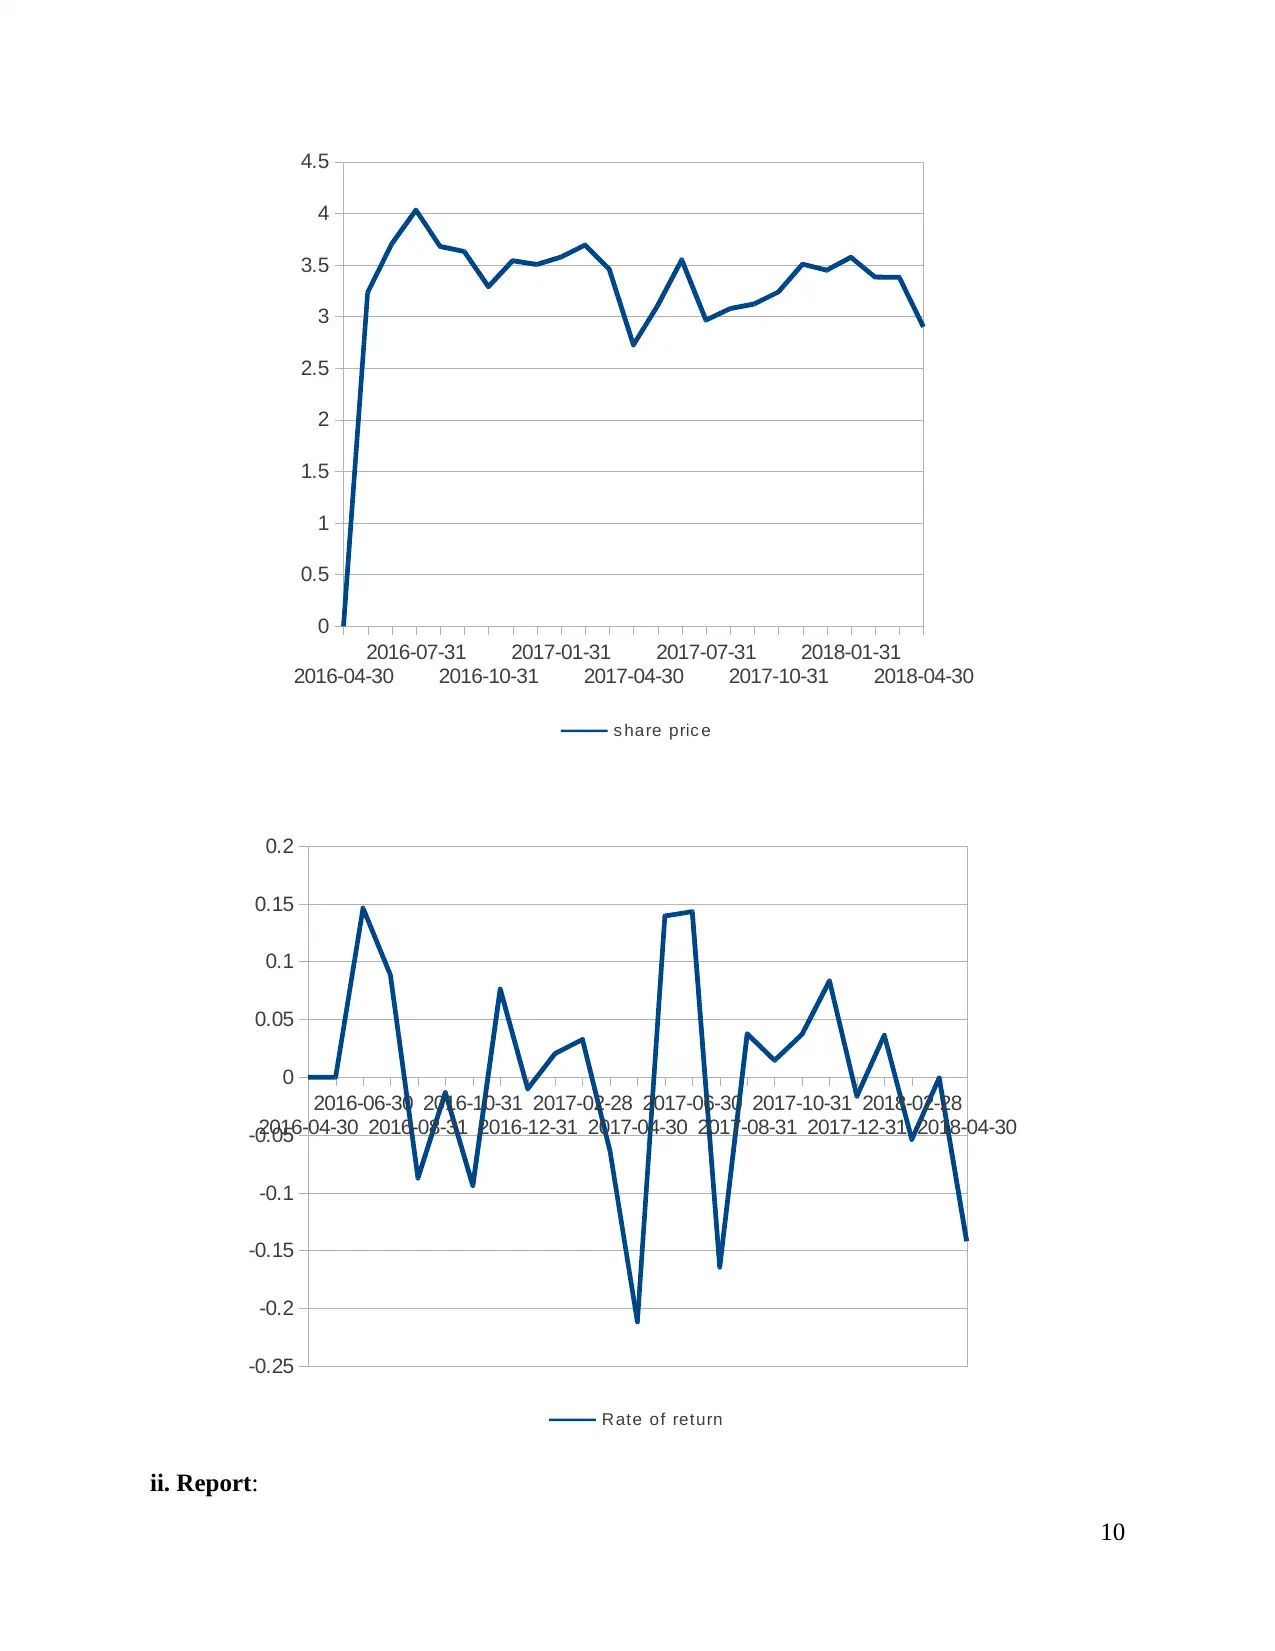
To analyse the fruitfulness of Automotive Holding Group Limited there will be analysis
based on various shares and its prices over the market (Klettner and et.al, 2014). To ascertains
the growth and market value of organisation there will be consideration over the fluctuations in
its share price. Moreover, to ascertain such changes the information will, be collected as on a per
month operational changes in share prices of the entity by considering the period from
30/04/2016 to 30/04/2018.
Date share price Rate of return
2016-04-30 0 0
2016-05-31 3.232067 0.00%
2016-06-30 3.704843 14.63%
2016-07-31 4.031488 8.82%
2016-08-31 3.679055 -8.74%
2016-09-30 3.630173 -1.33%
2016-10-31 3.289564 -9.38%
8
publicly held shares of firm. Therefore, it brings the clear determination of the share prices of the
organisation which will be assistive to the equity holder in relation with analysing the prices are
under valued or over valued (Evans, Lignier and Tran-Nam, 2016). Moreover, the shares will be
traded in the capital market over their fair value. Thus, the chances of beating the stock market
become impossible for the investors. However, in relation with Automotive Holding Group
Limited there has been analysis over the market value price of its shares have been analysed
through EPS and PE ratio. Moreover, the earning per share of entity has been analysed here in
2016 as 0.09 and in 2017 it was 0.18. Therefore, in comparing with the last year the firm is more
capable in the current year in terms of making favourable earning per share. Therefore, the firm
is base to have the earning over the invested share capital by the investors in the firm.
On the other side, in a term with PE ratio where the consideration of market value per
share and EPS generated by the firm in the period will have effective gains as to analyse these
ratios. Therefore, in 2016 it was 0.25 and in 2017 it becomes 0.13. Therefore, in the current year
there has been reduction in the market value of Automotive Holding Group Limited's shares.
4.Analysing the share price of Automotive Holding Group with the help of ASX disclosures
To analyse the fruitfulness of Automotive Holding Group Limited there will be analysis
based on various shares and its prices over the market (Klettner and et.al, 2014). To ascertains
the growth and market value of organisation there will be consideration over the fluctuations in
its share price. Moreover, to ascertain such changes the information will, be collected as on a per
month operational changes in share prices of the entity by considering the period from
30/04/2016 to 30/04/2018.
Date share price Rate of return
2016-04-30 0 0
2016-05-31 3.232067 0.00%
2016-06-30 3.704843 14.63%
2016-07-31 4.031488 8.82%
2016-08-31 3.679055 -8.74%
2016-09-30 3.630173 -1.33%
2016-10-31 3.289564 -9.38%
8
Paraphrase This Document
Need a fresh take? Get an instant paraphrase of this document with our AI Paraphraser
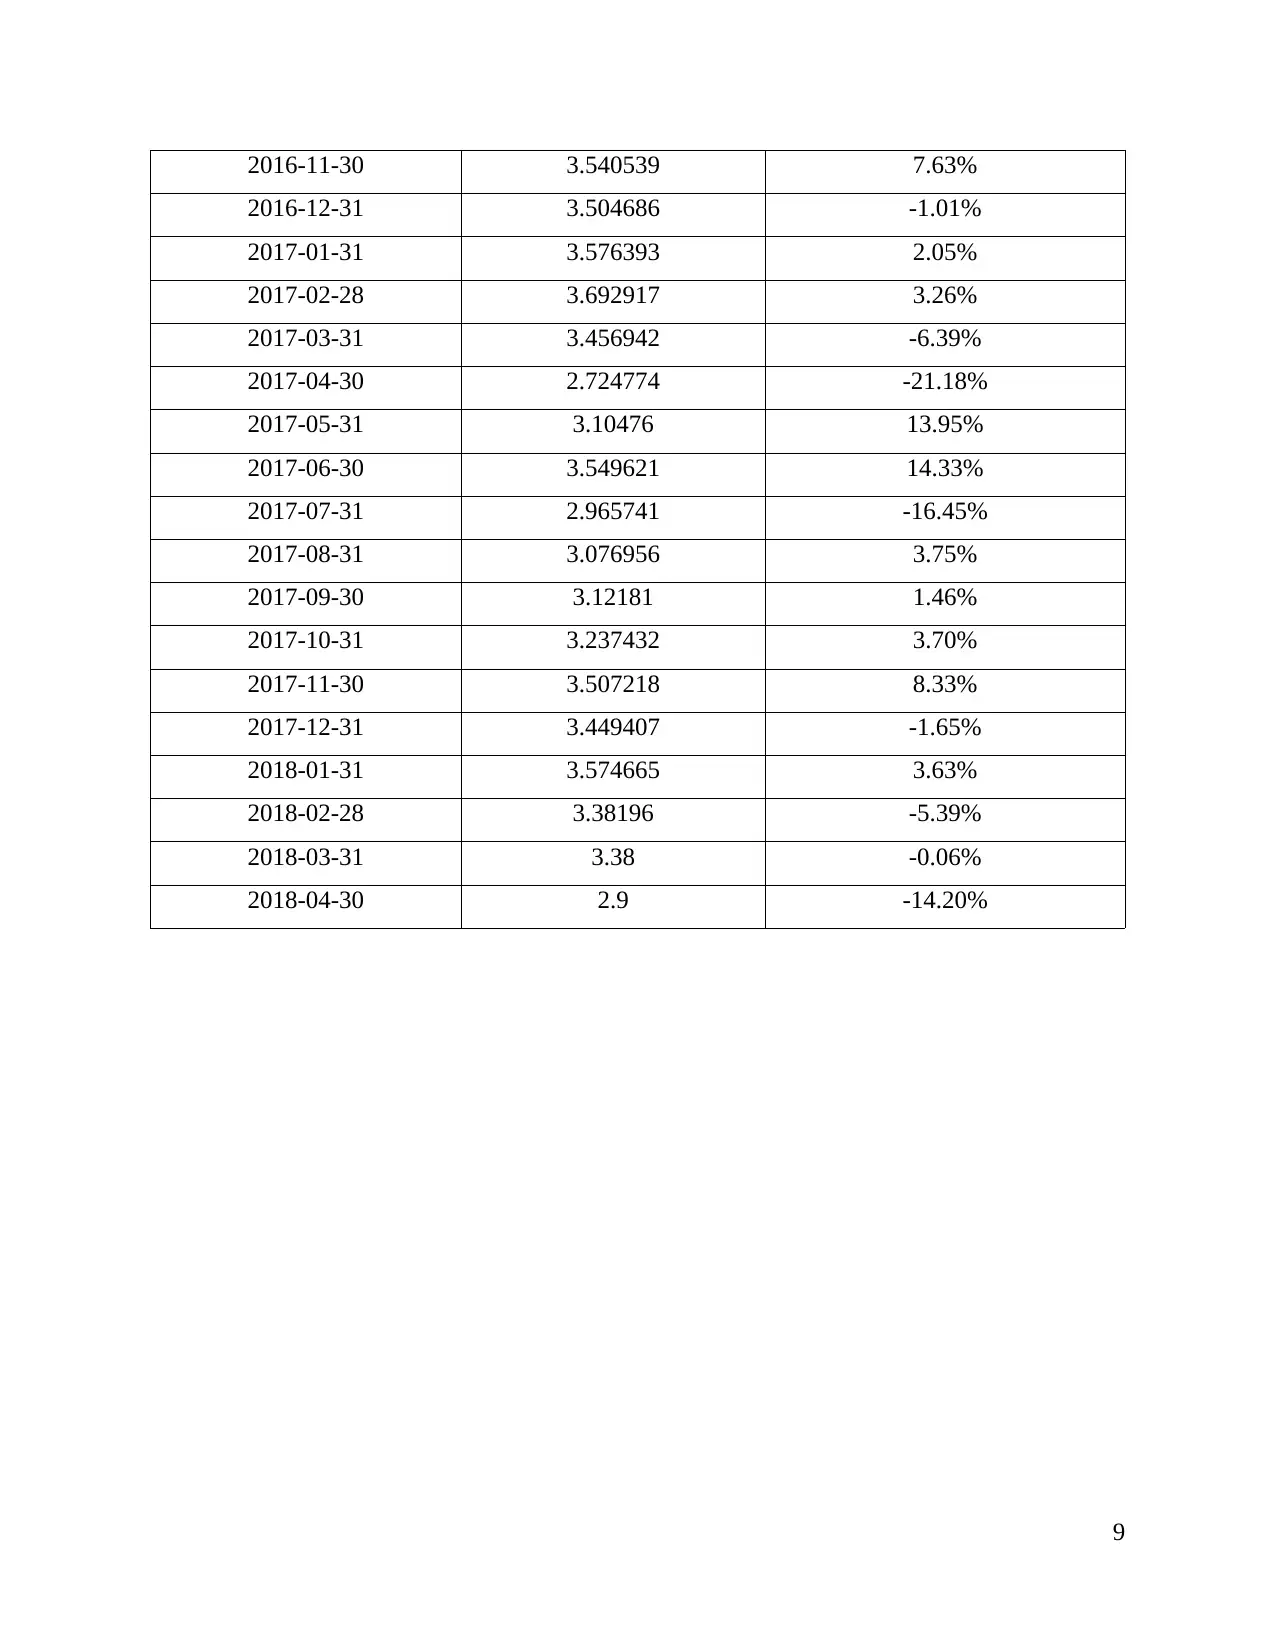
2016-11-30 3.540539 7.63%
2016-12-31 3.504686 -1.01%
2017-01-31 3.576393 2.05%
2017-02-28 3.692917 3.26%
2017-03-31 3.456942 -6.39%
2017-04-30 2.724774 -21.18%
2017-05-31 3.10476 13.95%
2017-06-30 3.549621 14.33%
2017-07-31 2.965741 -16.45%
2017-08-31 3.076956 3.75%
2017-09-30 3.12181 1.46%
2017-10-31 3.237432 3.70%
2017-11-30 3.507218 8.33%
2017-12-31 3.449407 -1.65%
2018-01-31 3.574665 3.63%
2018-02-28 3.38196 -5.39%
2018-03-31 3.38 -0.06%
2018-04-30 2.9 -14.20%
9
2016-04-30
2016-07-31
2016-10-31
2017-01-31
2017-04-30
2017-07-31
2017-10-31
2018-01-31
2018-04-30
0
0.5
1
1.5
2
2.5
3
3.5
4
4.5
s hare pric e
2016-04-30
2016-06-30
2016-08-31
2016-10-31
2016-12-31
2017-02-28
2017-04-30
2017-06-30
2017-08-31
2017-10-31
2017-12-31
2018-02-28
2018-04-30
-0.25
-0.2
-0.15
-0.1
-0.05
0
0.05
0.1
0.15
0.2
Rate of return
ii. Report:
10
⊘ This is a preview!⊘
Do you want full access?
Subscribe today to unlock all pages.
Trusted by 1+ million students worldwide
1 out of 17
Related Documents


Your All-in-One AI-Powered Toolkit for Academic Success.
+13062052269
info@desklib.com
Available 24*7 on WhatsApp / Email
![[object Object]](/_next/static/media/star-bottom.7253800d.svg)
Unlock your academic potential
Copyright © 2020–2026 A2Z Services. All Rights Reserved. Developed and managed by ZUCOL.